Remove benchmark
article thumbnail

Benchmarking B2B Emails

eDataSource

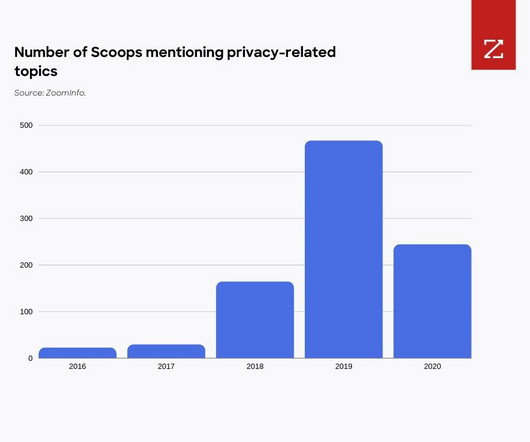
Spam rate trends have been variable, but improved for the first three quarters of 2018, and for the second quarter of 2019. The seventh in our performance benchmark series covers B2B marketing email. This analysis includes eight key industry sectors we classify in this space. in the bottom quartile (Q1 2018).

article thumbnail

2018 Deliverability Benchmarking Series: Q4 Retail

eDataSource

We will also be publishing a full White Paper, benchmarking email performance metrics across all key industries for 2018. The table below shows overall read rate and inbox performance ranked by quartile for the fourth quarters of 2018 and 2017. Our focus today is on Retail and Q4. Key Retail Sectors. Average Read Rates.

Insiders

Sign Up for our Newsletter

This site is protected by reCAPTCHA and the Google Privacy Policy and Terms of Service apply.

article thumbnail

Benchmarking Financial Services

eDataSource

Our benchmark series continues with an analysis of Financial Services. This analysis includes eight key industry sectors: Credit Cards, Debt Elimination and Credit Reporting, Electronic Payment and Wire Services; Financial Institutions; Financial Services and Research; Insurance; Mortgages and Loans; and Real Estate.

article thumbnail

B2B Ecommerce Marketing Benchmarks and Best Practices

KoMarketing Associates

This shows up clearly in search query data, like in the chart from Google Trends below. Even as of the close of 2018, Forrester says US B2B ecommerce had already exceeded $1.1 According to an analysis of the US Commerce Department data done by Internet Retailer, “Consumers spent $517.36 merchants in 2018, up 15.0%

eCommerce 121
article thumbnail

Benchmarking Series: Entertainment Industry

eDataSource

The fifth in our performance benchmark series covers the Entertainment industry. Benchmark data help you set a standard. The tables below show overall read rate and inbox performance ranked best-to-worst by quartile for each quarter of 2018 and 2017, and for the first quarter of 2019.

article thumbnail

Vidyard Releases 2019 Video in Business Benchmark Report; Uncovers Latest Trends on Video Creation, Publishing, Engagement and Analytics Across B2B Markets

Vidyard

Findings from the new report show that the average length of videos is trending shorter and shorter while audiences are opting to engage in videos longer. TL;DR– Your Key Takeaways from the 2019 Video in Business Benchmark Report Average business video length is trending shorter year-over-year: In 2018, the average length was 4.07