


Chrome DevTools is a free tool built into the Chrome browser. Its many features help you audit elements on your website in real time.
Chrome DevTools is a powerful toolbox for technical SEO audits and is just a click away.
Accessing Chrome DevTools
Accessing the DevTools within the Chrome browser is as simple as right-clicking when on a webpage and selecting inspect. This will typically open on the right side of the screen.
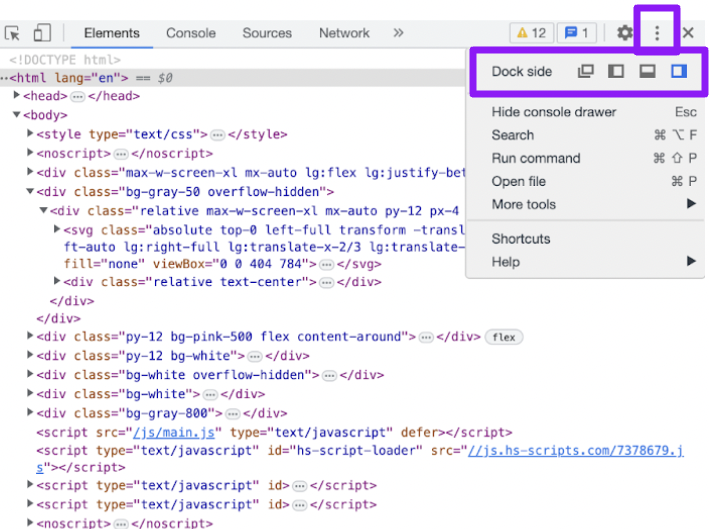
However, you can select to dock it at the bottom, on the left, or even open it in a separate window.
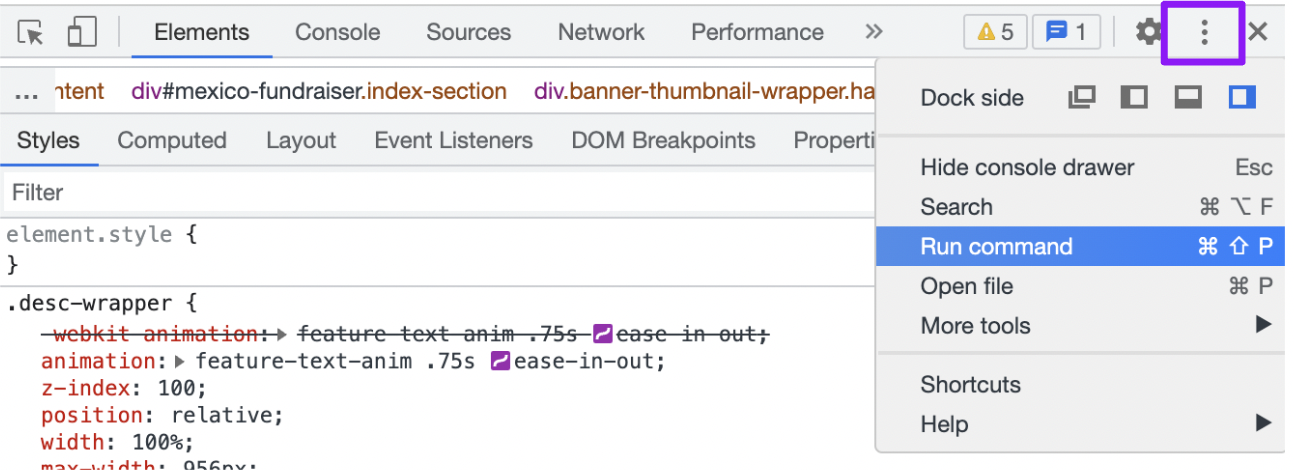
Click on the three dots next to the settings cog and select your preferred dockside.
Building Your Console Drawer
The console drawer is an additional panel containing tools that are hidden by default. The most useful ones for SEO are Coverage, Rendering, and Network Conditions.
You can access the console drawer by clicking the same three dots and selecting “Show console drawer.”
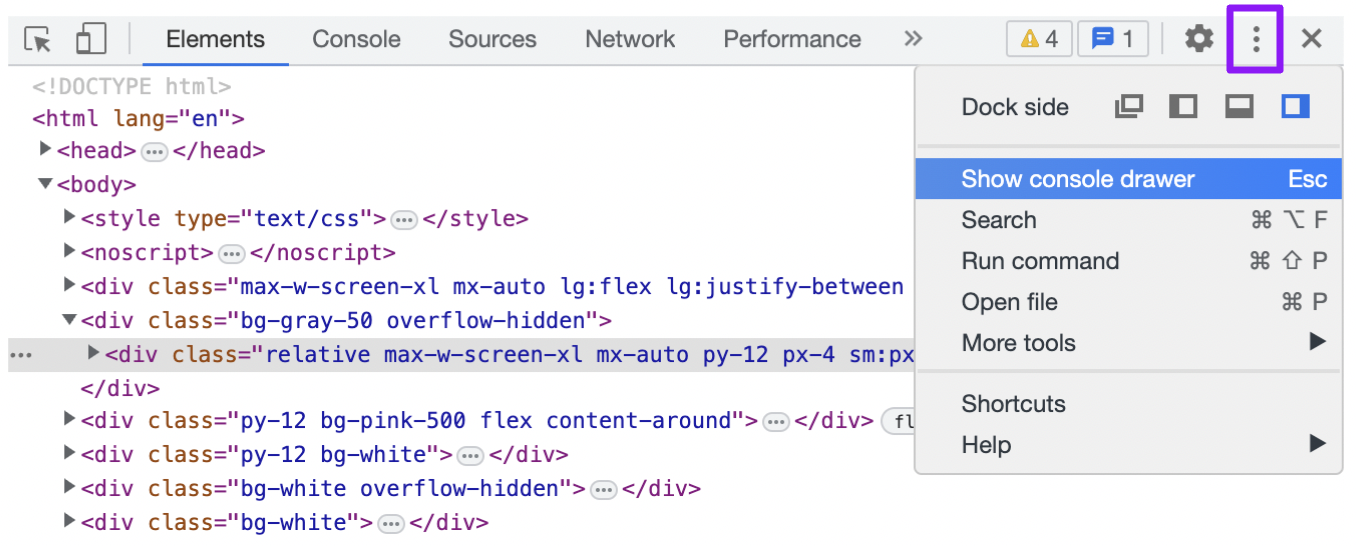
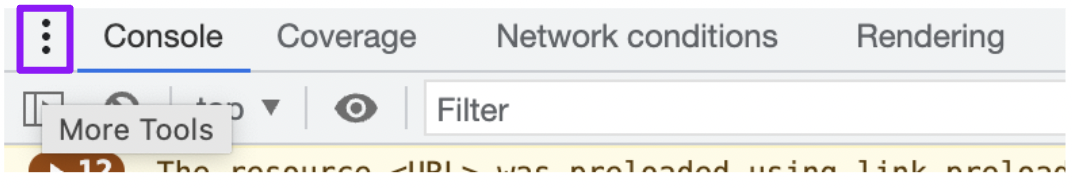
Once this is opened at the bottom of the elements panel, clicking the three dots on there will provide the list of additional tools which can be added in a tab-like format.
SEO Auditing Opportunities
There are different ways to identify issues, validate findings, and review a website’s accessibility for users and search engines.
Ensure Content Is Accessible
Search engines should be able to see and crawl your content. It’s a basic check that’s easy to overlook.
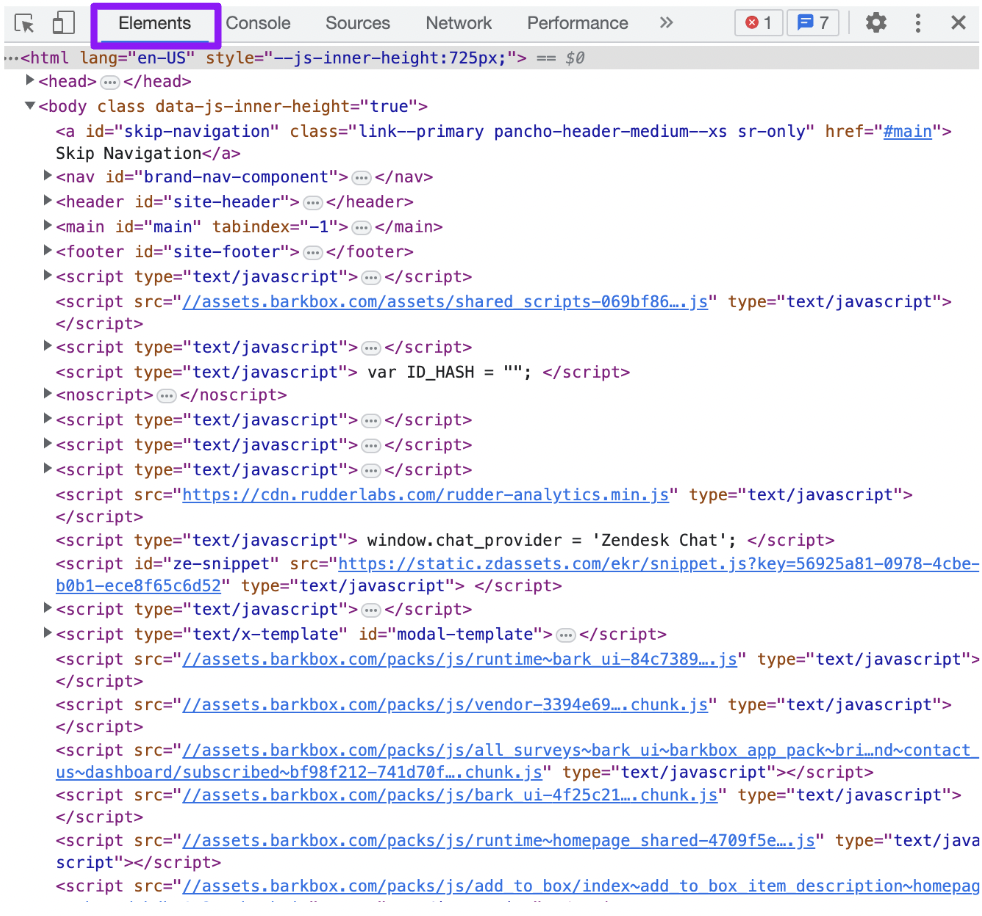
In the Elements panel of DevTools, you can view the Document Object Model (DOM) of your page.
The DOM is the structure of an HTML document; it determines the content that should be on a page, as well as how all of the elements relate to each other. It also allows JavaScript to access and update the page.
This panel shows various elements of content, including meta tags, canonicals, and hreflang tags, as well as the main body content and structure of the page.
The Elements tab shows the JavaScript-rendered version of the page, so you can use it to identify differences between the rendered page and the HTML source code.
Much of modern web content requires JavaScript to load. This can cause issues with the cached version of the page and impact how Google discovers and indexes content.
For example, if JavaScript is used to render a title tag, there will be different versions of it: one that is loaded in the HTML and a different one when JavaScript is rendered. This may make it difficult for Google to know which one to display in SERPs.
If you discover that Google is displaying your content unexpectedly in SERPs, this is a good way to check the page.
JavaScript Parity
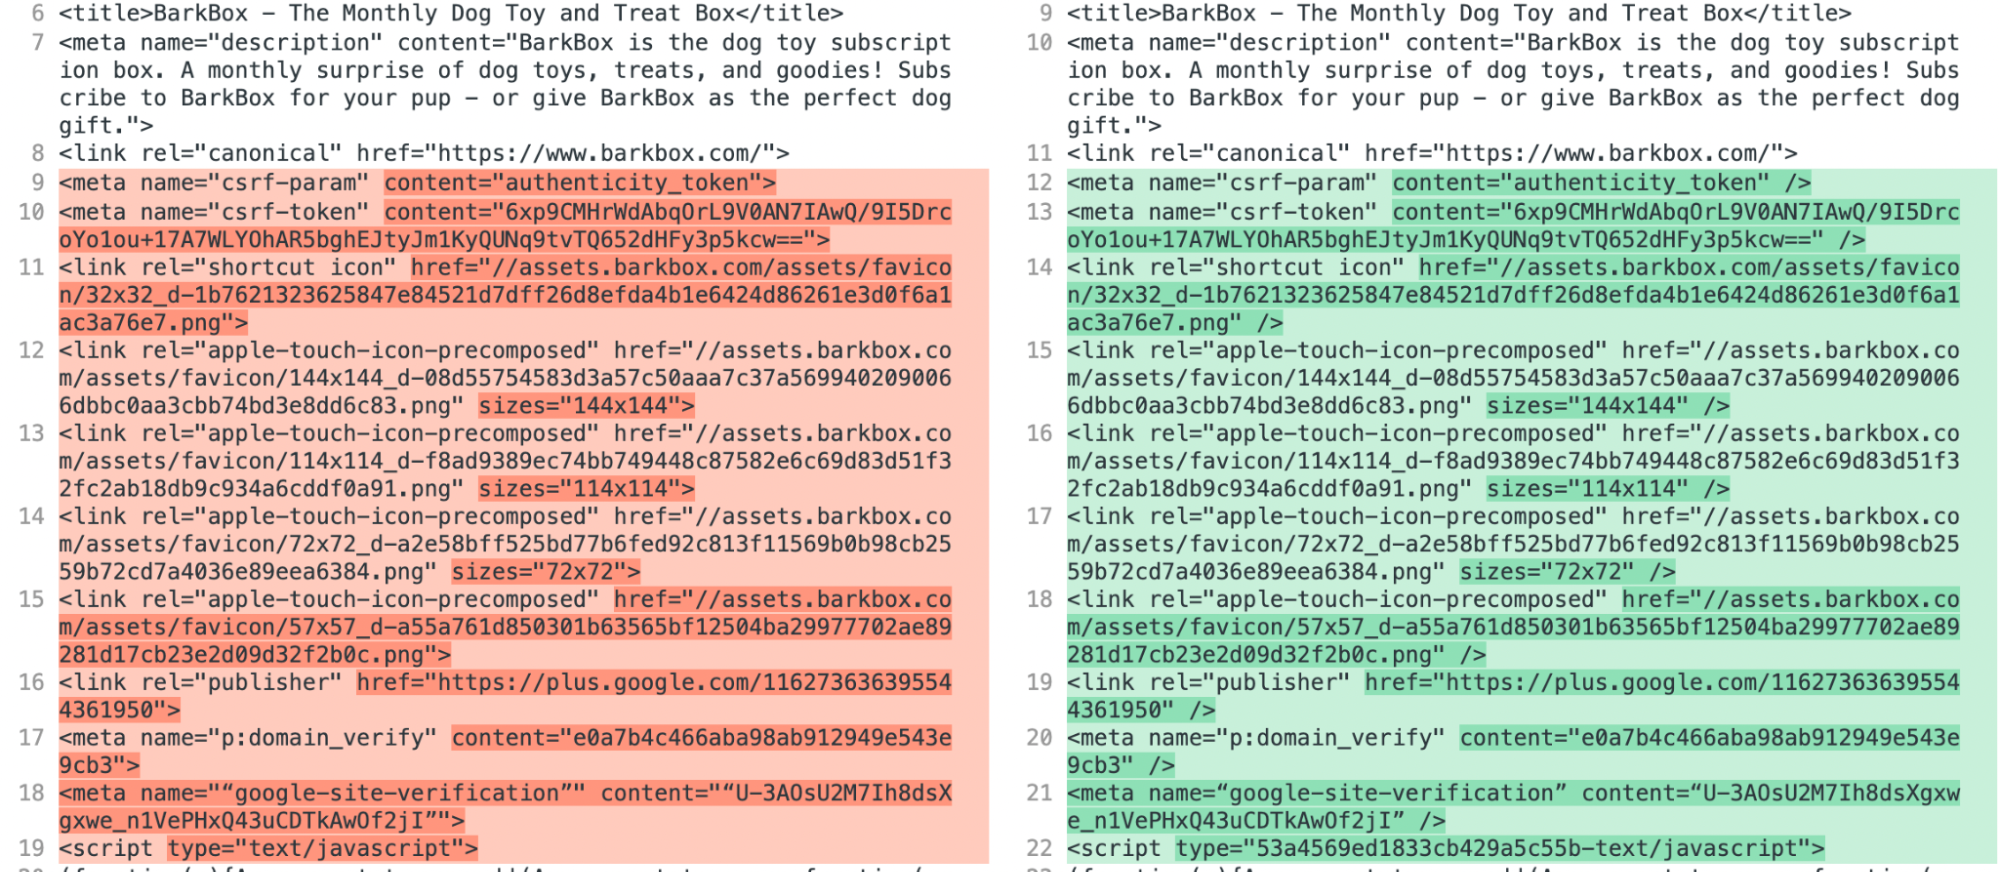
A JavaScript parity test can help you track down issues between the HTML and JavaScript versions of a page.
Right-click within the Elements tab and select Copy > Copy element. This copies the whole JavaScript code of the page. Select the HTML source code with Command or Ctrl+ A. Then use a diffchecker to identify any differences between the two.
You will see a lot of injected scripts within the JavaScript code, but the key things to look for are meta tags, canonicals, indexing tags such as noindex, and the main headings and content elements.
Find And Validate Useful Tags For Search Engines
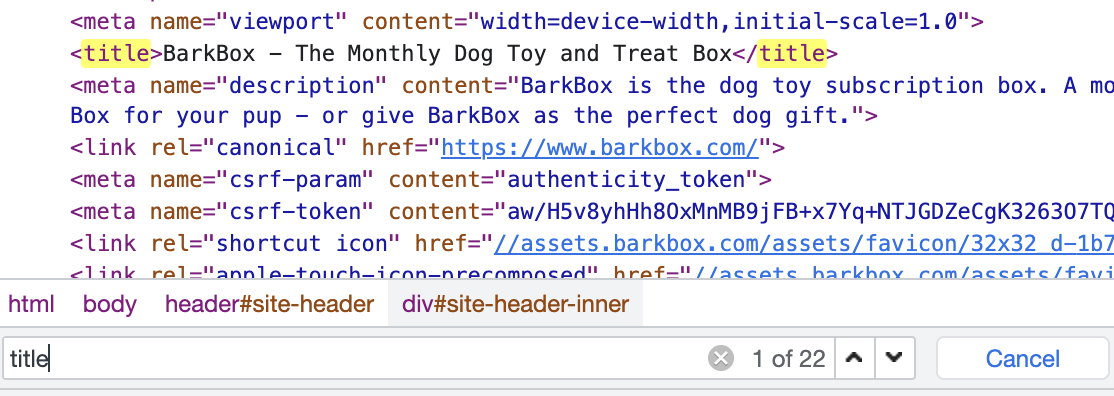
The Elements tab also helps you review tags that guide search engines on how to view and index the page.
For example, you can use the search function to find title and meta tags easily, OG tags and canonicals, as well as hreflang configuration and robot meta tags.
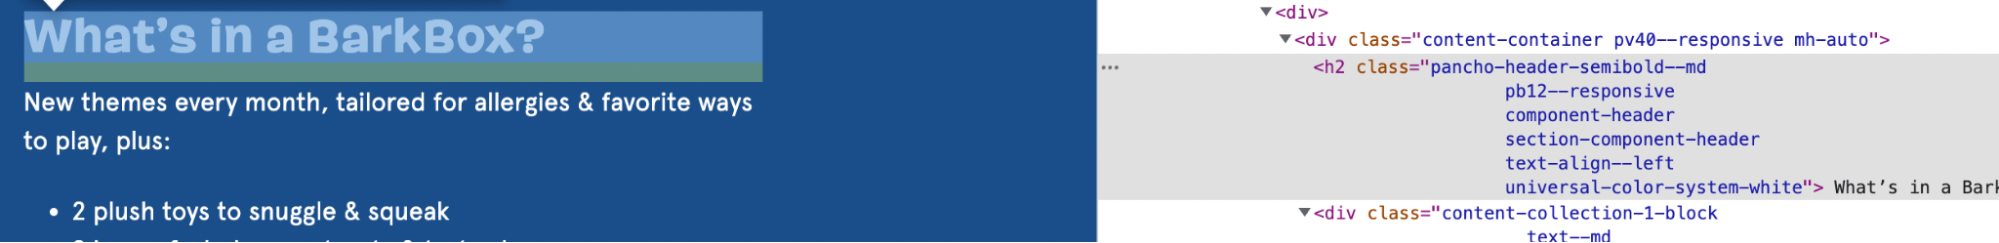
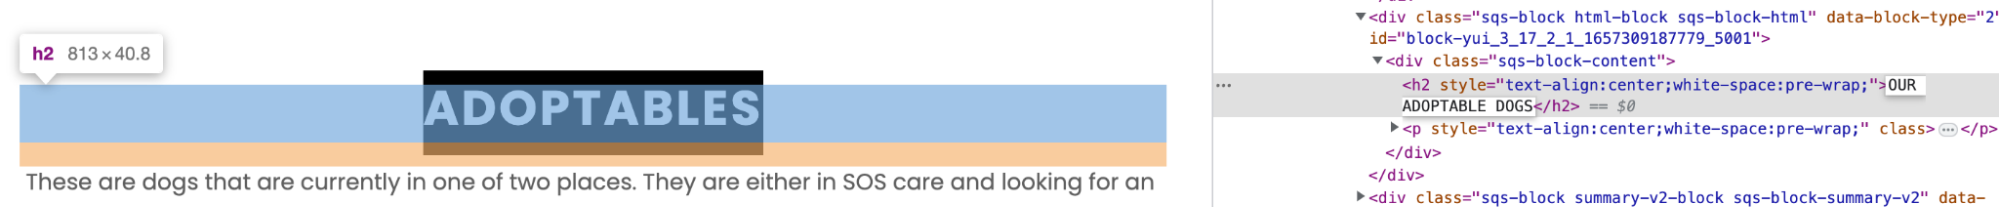
You can also identify the heading structure with the element inspector tool. Use it to verify H1 and H2 tags and their placement.
Verify Alt Text
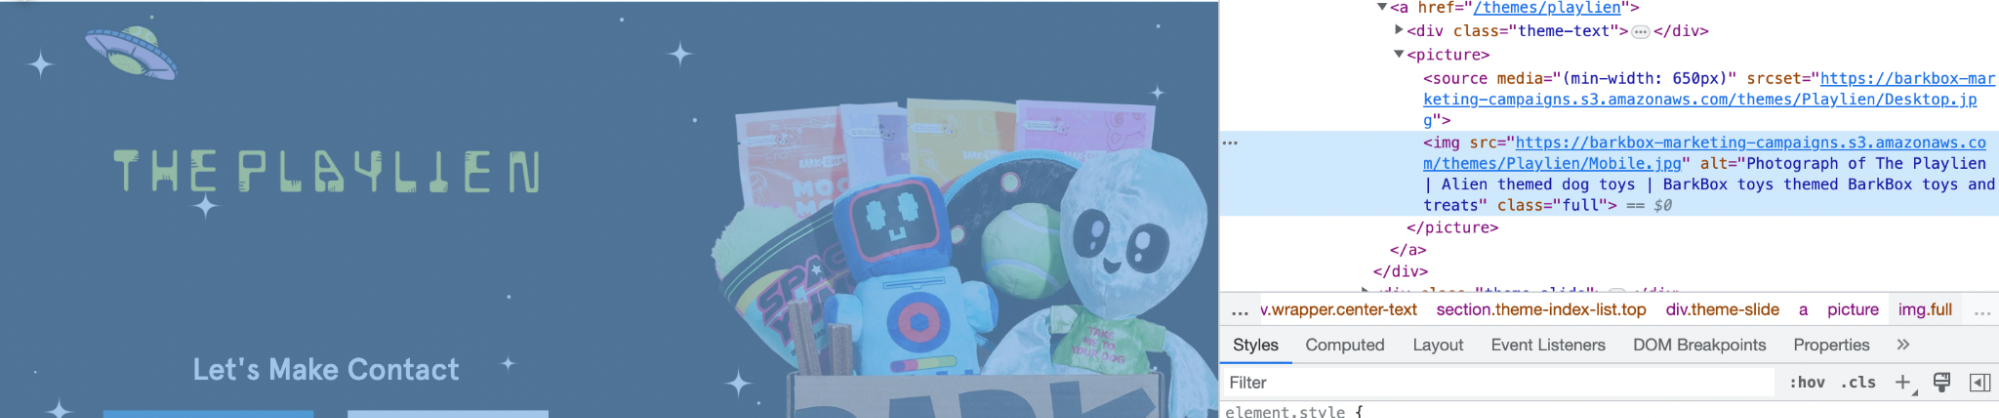
Images on your page should contain alt text that is logical, descriptive, and not stuffed full of keywords.
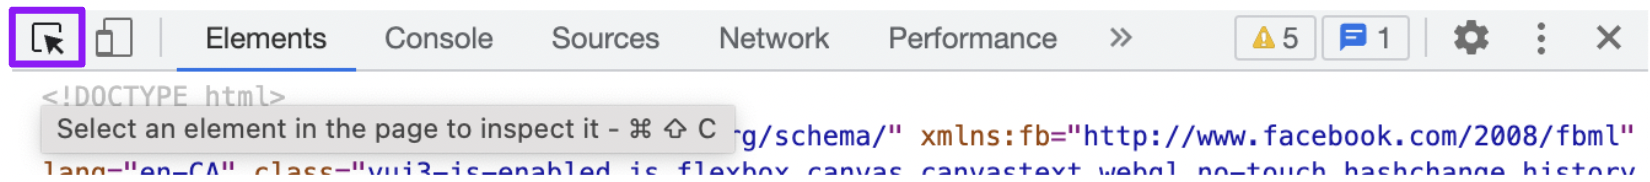
On the Elements tab, use the element selector, then click on the image to review its code and alt text.
Emulate Multi-Device Responsiveness
Ensuring your website is responsive, usable, and accessible across multiple devices is imperative for modern SEO.
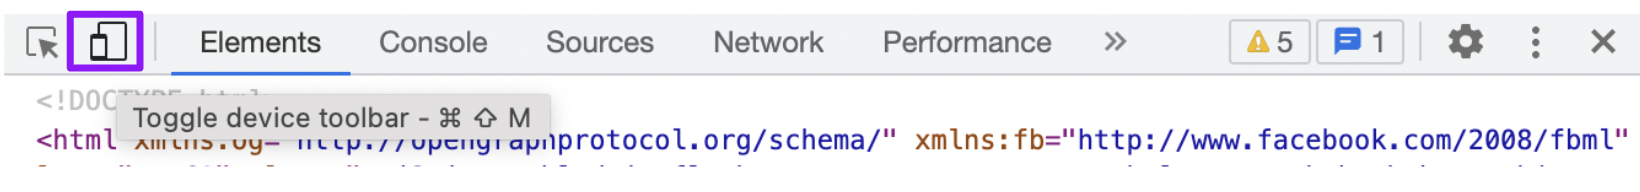
Chrome DevTools makes it easy to audit mobile-friendliness with the device toolbar.
Click the “toggle device toolbar” option in the top left of the panel, and you will see the page displayed in a responsive format, with options at the top.
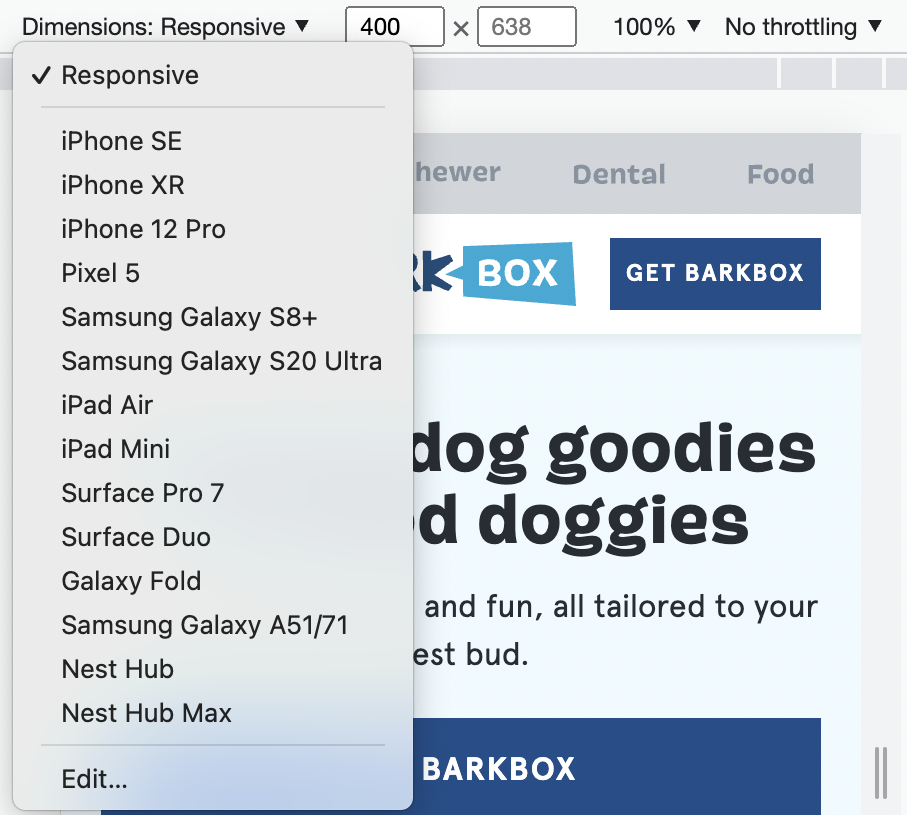
Select a device screen size to emulate or customize the exact screen size.
“Responsive” shows the responsiveness of the page, which is a much more effective method than resizing the browser window yourself.
Ensure that elements load and perform properly on mobile devices and that there are no major differences between the content and links compared with the desktop version.
Site Speed Audits
One of the most powerful features in Chrome DevTools is the ability to audit site speed and performance to identify any issues which may impact Core Web Vitals and the overall performance of the page.
Lighthouse Audits
Lighthouse is accessible in the top navigation bar of the DevTools window.
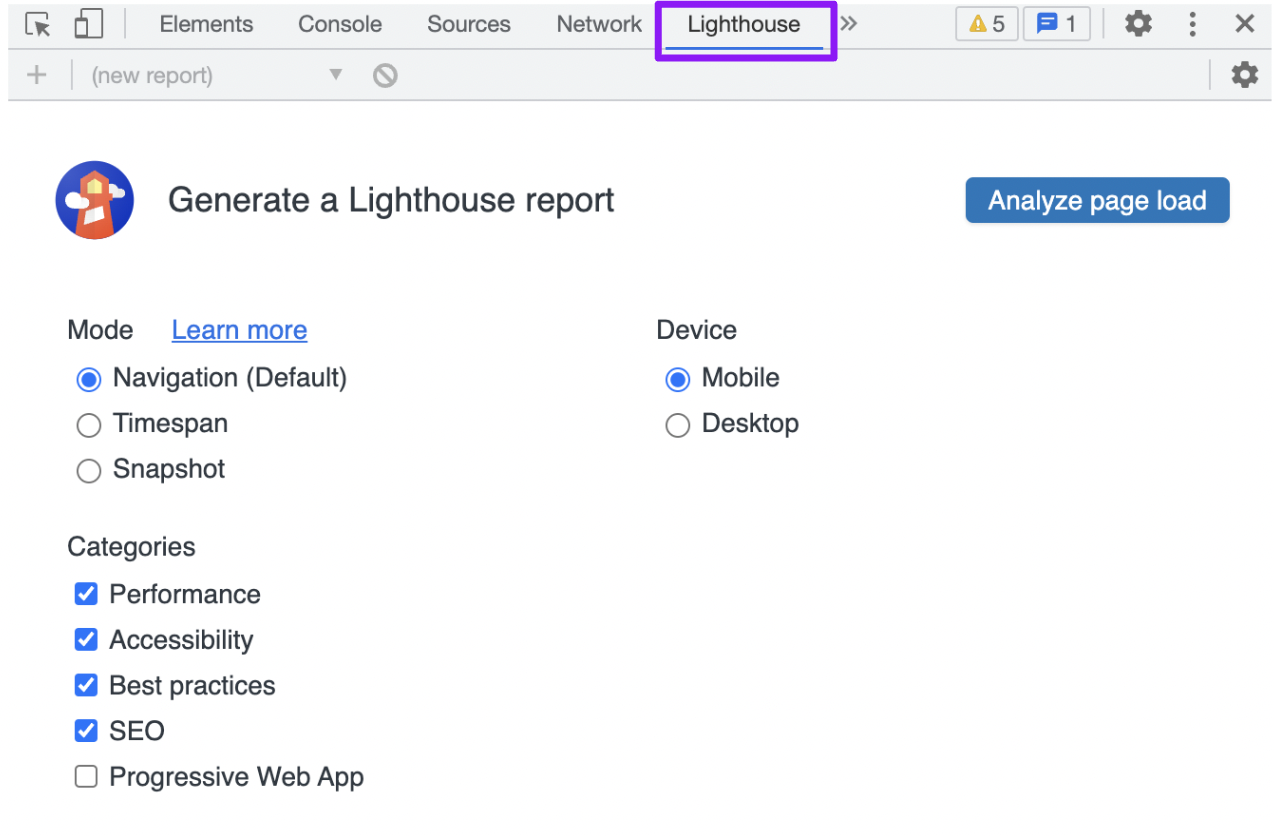
Once the page has been analyzed, Lighthouse will produce a performance score out of 100 based on several factors that Google updates over time.
Check Google’s official documentation for the most up-to-date weighting for Lighthouse audits.
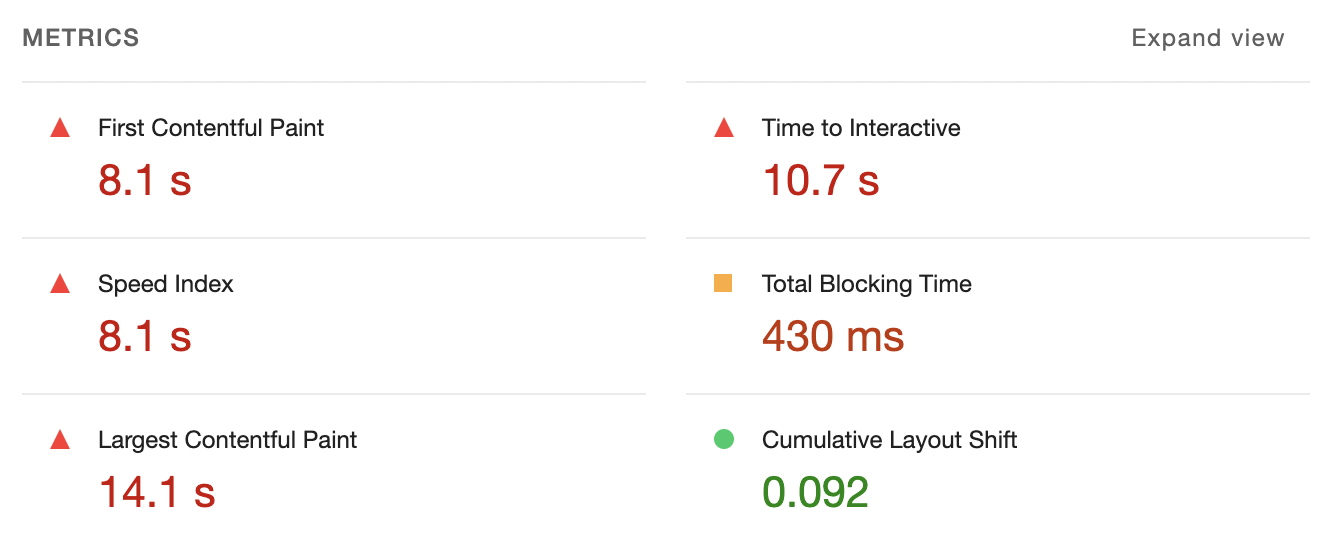
The audit will also display the timing data for the core metrics that make up the performance scoring.
Currently, these are First Contentful Paint, Time To Interactive, Speed Index, Total Blocking Time, Largest Contentful Paint, and Cumulative Layout Shift.
Each of these will be color-coded depending on their performance, with red signifying poor, orange meaning needs improvement, and green meaning good.
You will also see a visual of screenshots displaying the page load, with the elements loaded at each stage.
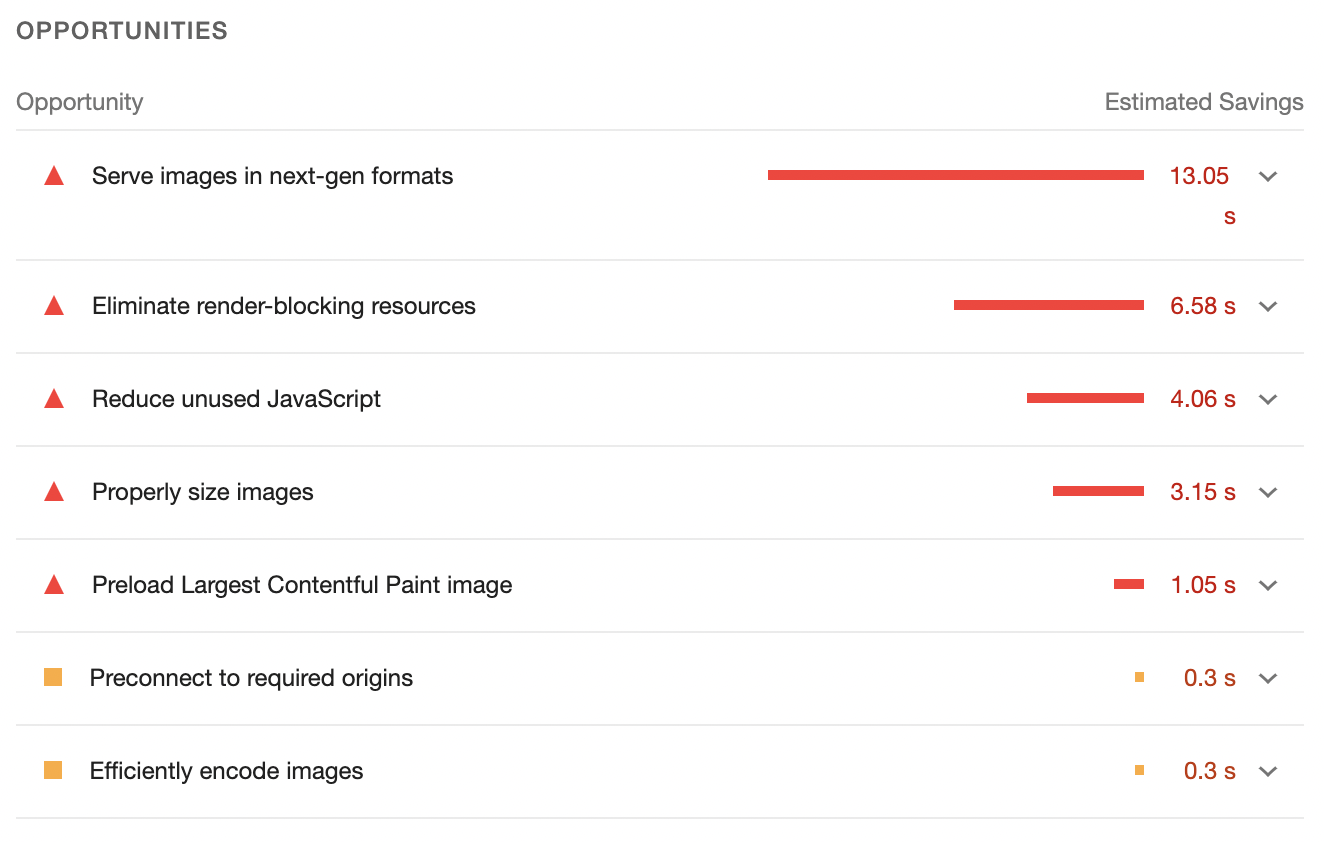
Below this is the opportunities list, which displays a list of improvements to increase the performance score.
The list displays the biggest saving opportunity first, and each point can be expanded, providing further details and displaying examples of elements contributing to the score.
Within the Lighthouse audit, you will also find an accessibility score.
This is auditing elements, including colors and contrast, ARIA elements, alt tags, names and labels for buttons, forms, and links, as well as navigation and heading structure.
It’s worth keeping in mind that this only displays a subset of issues, so further testing is necessary for accessibility purposes.
There is also an SEO section, which is based on SEO practices and includes top-level insights around elements such as titles and descriptions, indexability, crawlable links, HTTP status, and canonical tags.
Identify Performance Issues
The performance tab is a useful tool for assessing the load time of each element on the page. It can help you identify performance issues impacting speed and user experience.
Click “Start profiling and reload page” to record a reload of the page to check the load performance. The page will automatically reload and stop profiling once CPU and network activity on the page stops.
You can also test “runtime performance.” This records the page while it’s running and you’re interacting with it.
Click the record button, and then navigate the page as you would expect a user to. Once you have finished, press the stop button to view the performance profile.
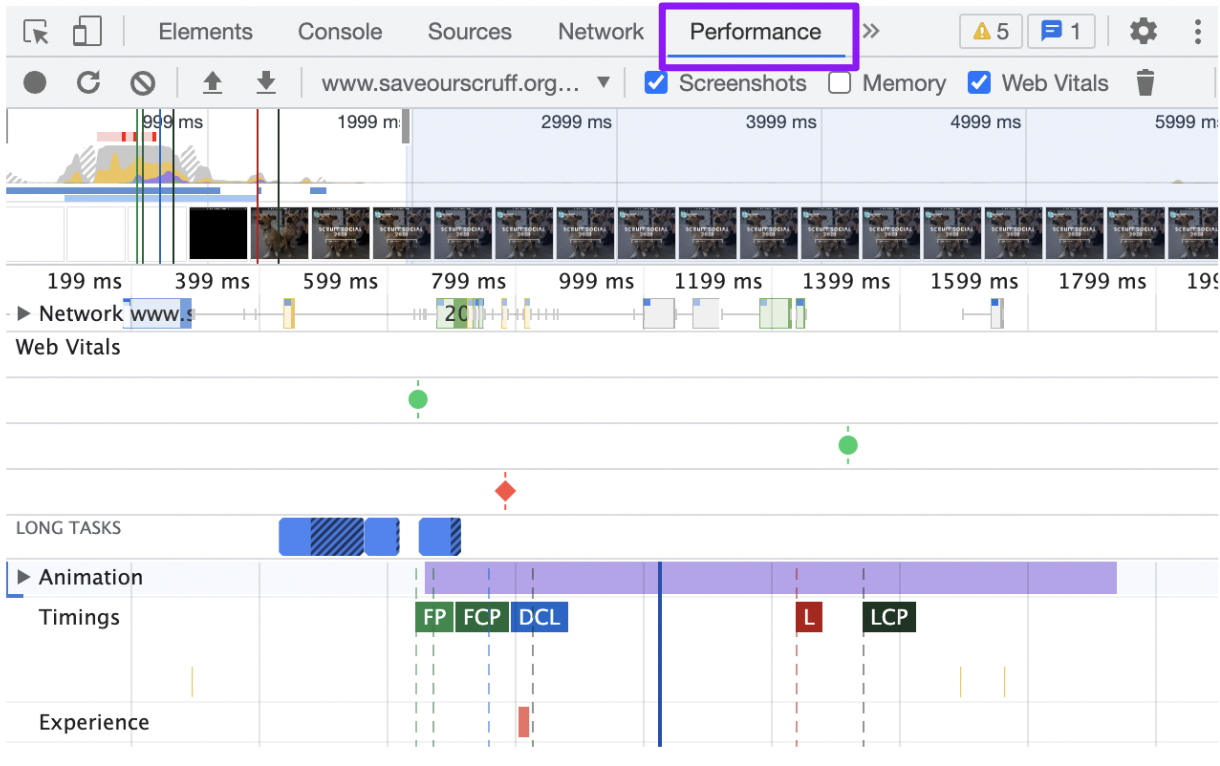
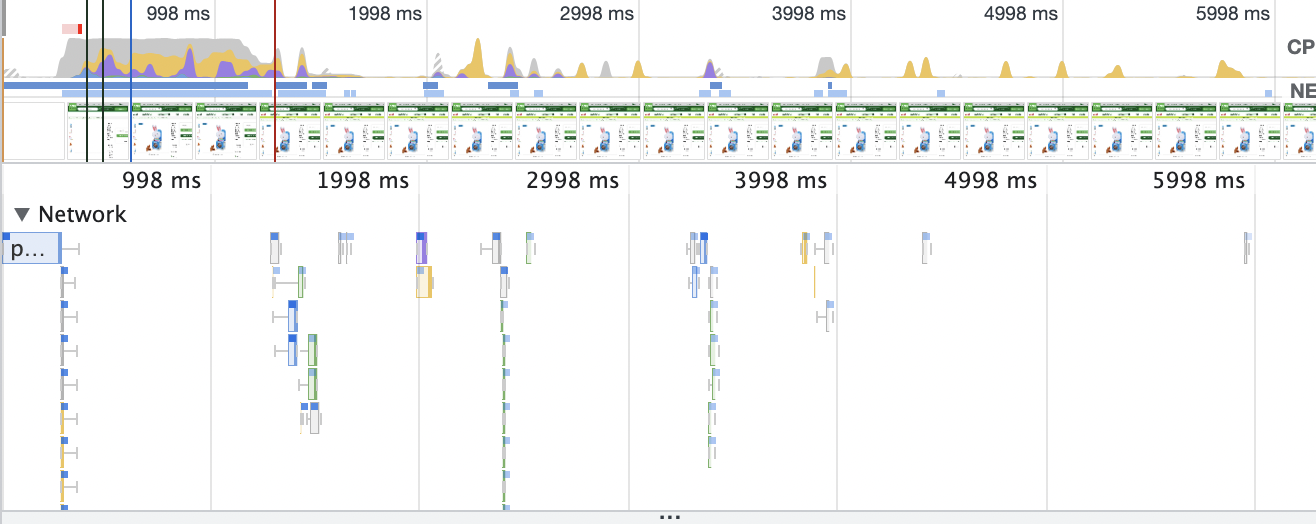
The performance tab contains many metrics, but for SEO, we will focus on Filmstrip, Web Vitals, Timings, Experience, and Summary.
The filmstrip displays a recording of the rendering progress of the page. However, you can hover over each step to see a screenshot from that point of the load. It will display when certain elements load and the order in which they are added to the page.
Tick the Web Vitals option at the top of the panel to display the moments during the load that each Core Web Vital occurs and the timing for each.
Occurrences of layout shifts are also highlighted here. The Experience bar displays the elements that cause those shifts. Clicking on the occurrence within the Experience bar provides further details about the score, movement, and affected node.
The Timings section displays the load time of each element that is representative of the key user-centric performance metrics:
- First Paint (FP) – the time taken by the first pixel when loaded.
- First Contentful Paint (FCP) – when the first piece of content renders.
- First Meaningful Paint (FMP) – the time taken to provide the first piece of meaningful information to users.
- DOMContentLoaded (DCL) – when the HTML document has finished loading.
- Largest Contentful Paint (LCP) – the time taken for the largest element on the page to load.
The Network Waterfall is another useful element to review. It displays useful insights on each resource, along with how much time it takes to load.
This enables you to identify any resources that slow the page down, such as plugins or scripts.
Layout Shifting Areas
As images and ads load on the page, other content elements may jump around on the page. This is common during page loading, but it can be valuable to identify the exact elements that are causing these layout shifts.
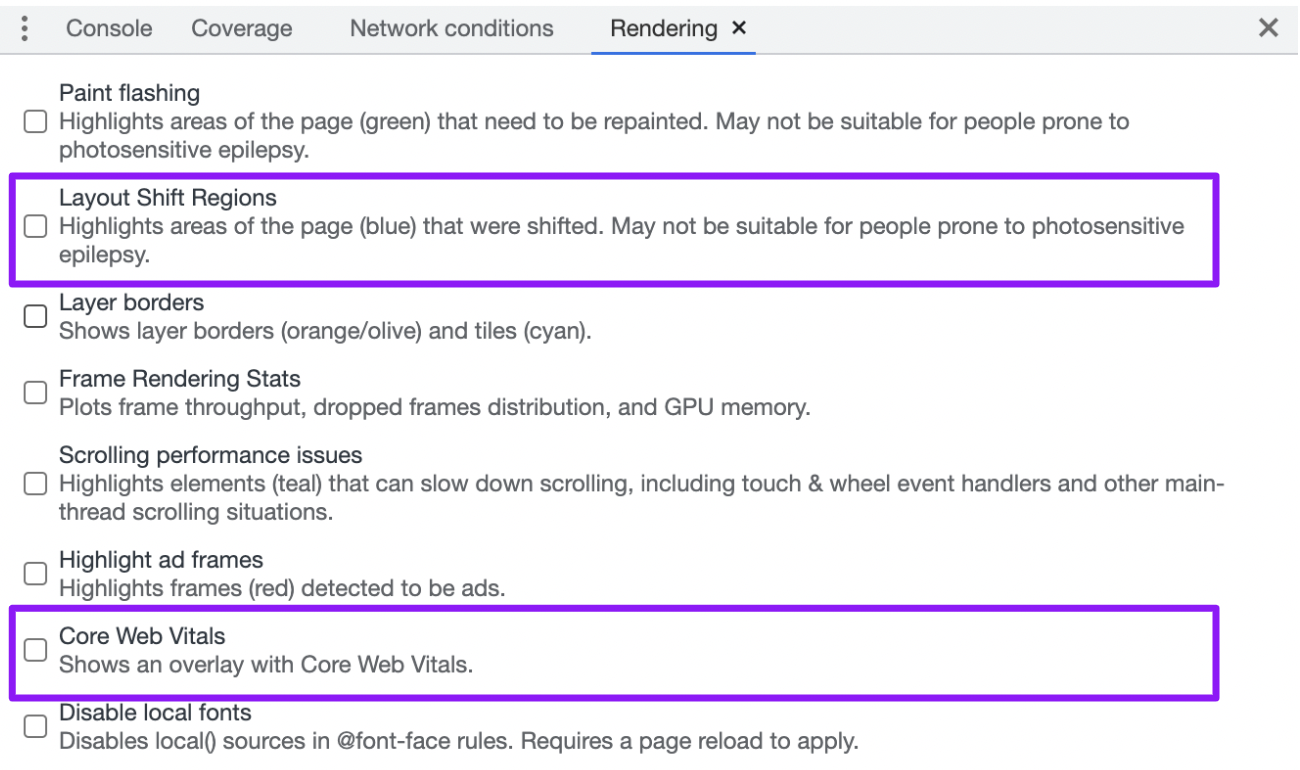
Within the Rendering panel in our console drawer, there is an option called Layout Shift Regions. This will highlight areas of the page that undergo a layout shift as content is loaded.
Core Web Vitals
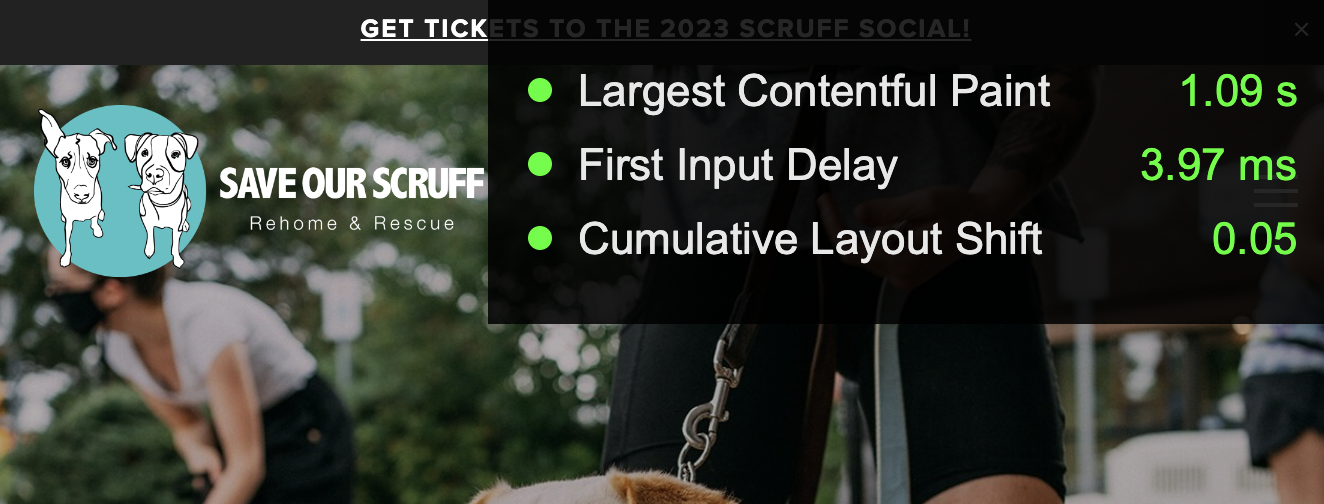
Another option in the Rendering panel is Core Web Vitals. It will produce an overlay on the screen displaying the key Core Web Vitals metrics and timings for each element as you interact with the page.
Performance Insights
The new Performance Insights panel has some similar features to the original Performance panel but contains additional useful insights.
Click the two arrows along the top and select Performance Insights from the dropdown.
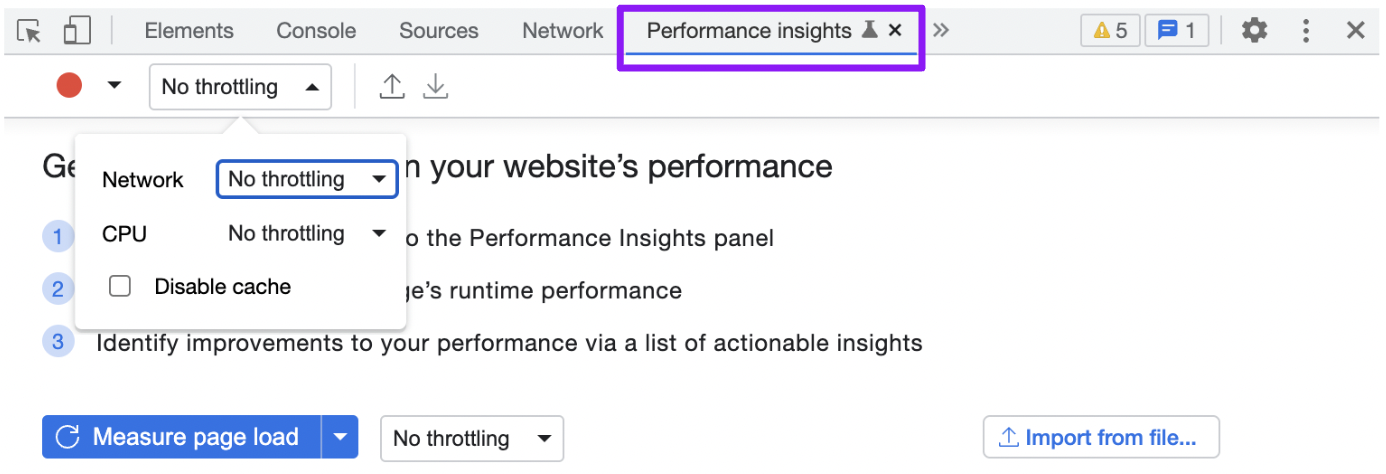
Clicking the measure page load button will reload the page and start recording performance.
To get a better idea of how real-world users may experience the site, you can also enable network and CPU throttling and disable the cache, which will provide a realistic insight into the performance for first-time visitors.
Once the page load has been completed, you will see a playback recording of the entire load, displaying a visual of the page loading.
You can scroll to different moments and identify the different resources and functionality loading at each point.
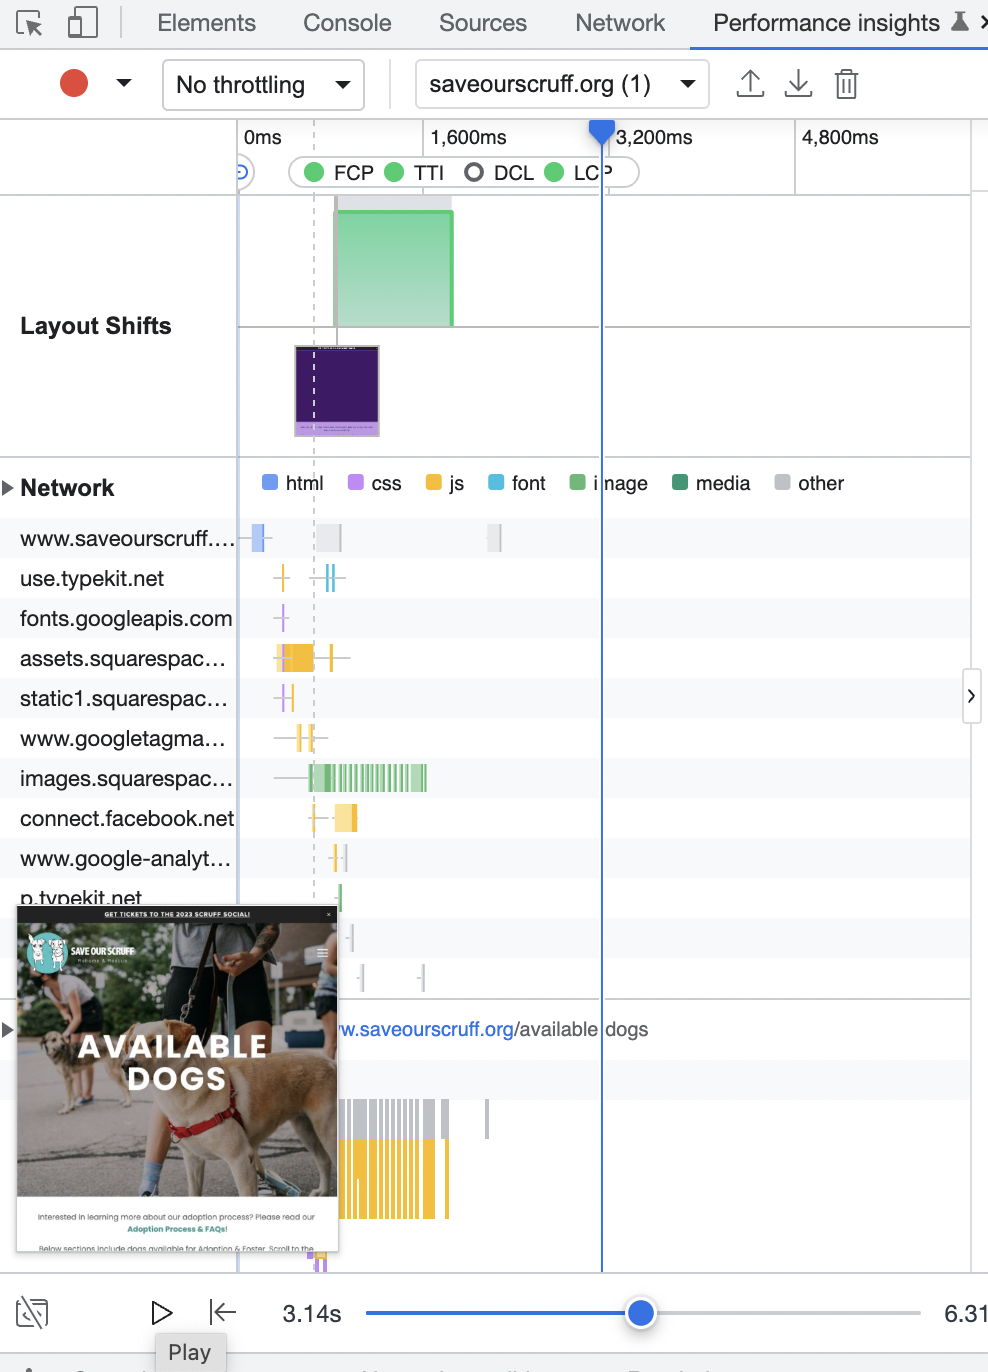
The Performance Insights panel also displays a timeline of each step, with additional insights and details for each stage.
For example, you can see any render-blocking resources, when they occur, and what’s causing them.
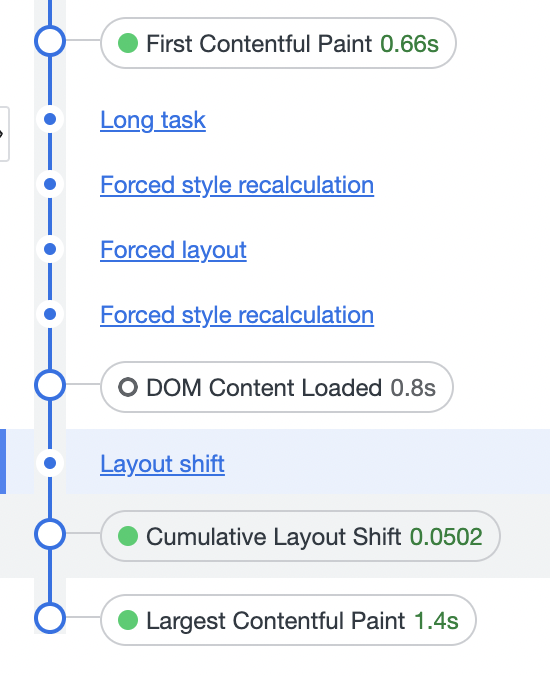
The Largest Contentful Paint load and layout shifting elements are also highlighted here, together with timings for other useful tasks.
Local Overrides
You can use Local Overrides in Chrome DevTools to make changes to a page and then keep those changes when reloading the page.
Some example use cases include changing CSS styling, testing to see how the page performs with render-blocking files removed, or checking whether your changes have improved layout shifts.
You can view a performance profile of the changes and compare it to the current performance of the page.
This works for Lighthouse audits, too, providing you with real-time feedback on your changes.
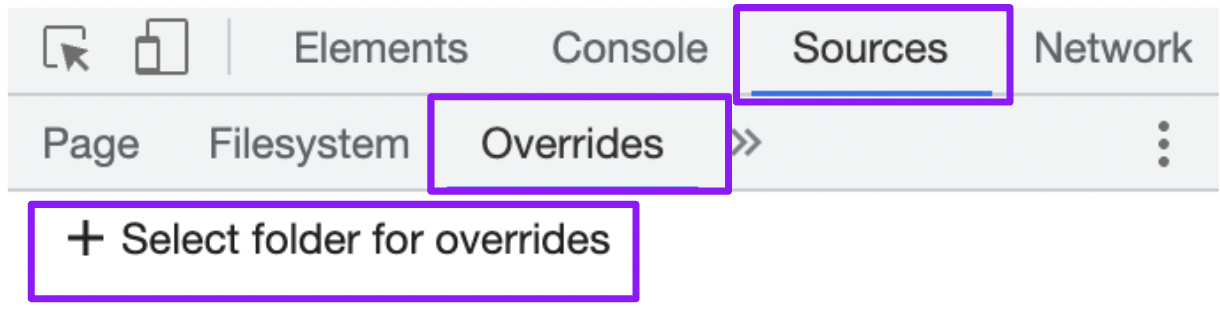
Set up and perform overrides in the Sources panel. Navigate to the overrides tab. Click “Select folder for overrides” to select a folder in your local environment to store the changes you make.
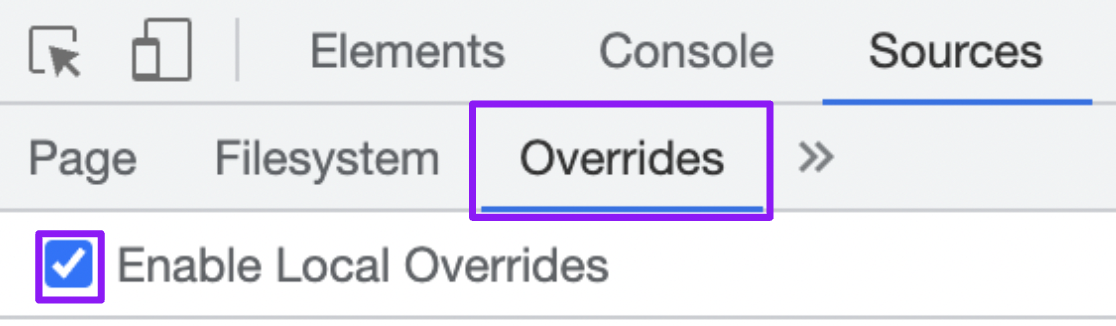
Once permission has been granted from Chrome to access this folder, you can tick the option to Enable Local Overrides.
Now, navigate back to the Pages tab. Right-click on a file you want to override, and click Save for Overrides.
You will see a purple circle next to the file, which indicates it is being served locally, and changes can be made. Click on it to make changes.
More details on how Overrides work can be found within this Google documentation.
Review Resource Coverage And Identify Unused Code
Websites commonly ship a large number of unused codes, which can impact performance. Large CSS files can drastically slow down site speed.
You can use the Coverage panel within the console drawer to review and troubleshoot resources.
Within this panel, you can record code coverage and either reload the page to see the code needed during the load, or interact with the page to see which code is used throughout.
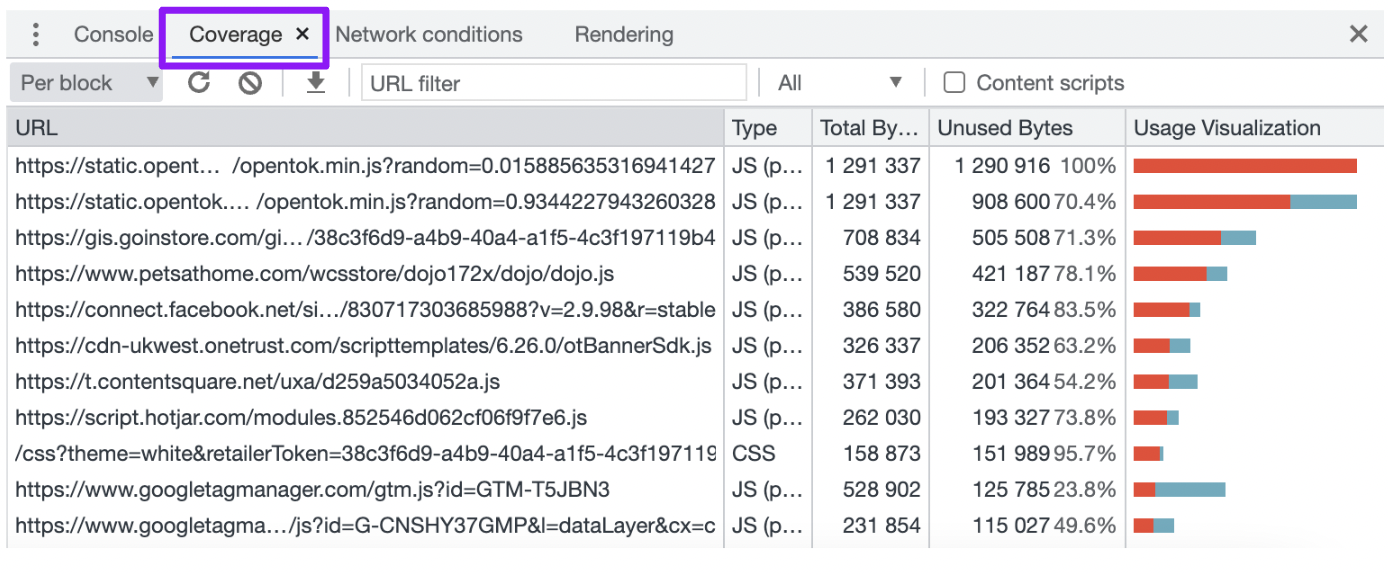
The code coverage table displays the analyzed resources and how much code is used within each. The columns are:
- URL – displaying the URL of the resource.
- Type – detailing whether the resource contains CSS, JavaScript, or both.
- Total bytes – the total size of the resource in bytes.
- Unused bytes – the number of bytes that weren’t used.
- A visualization of total bytes and unused bytes – the red bar is displayed unused bytes, with the blue displaying the used bytes.
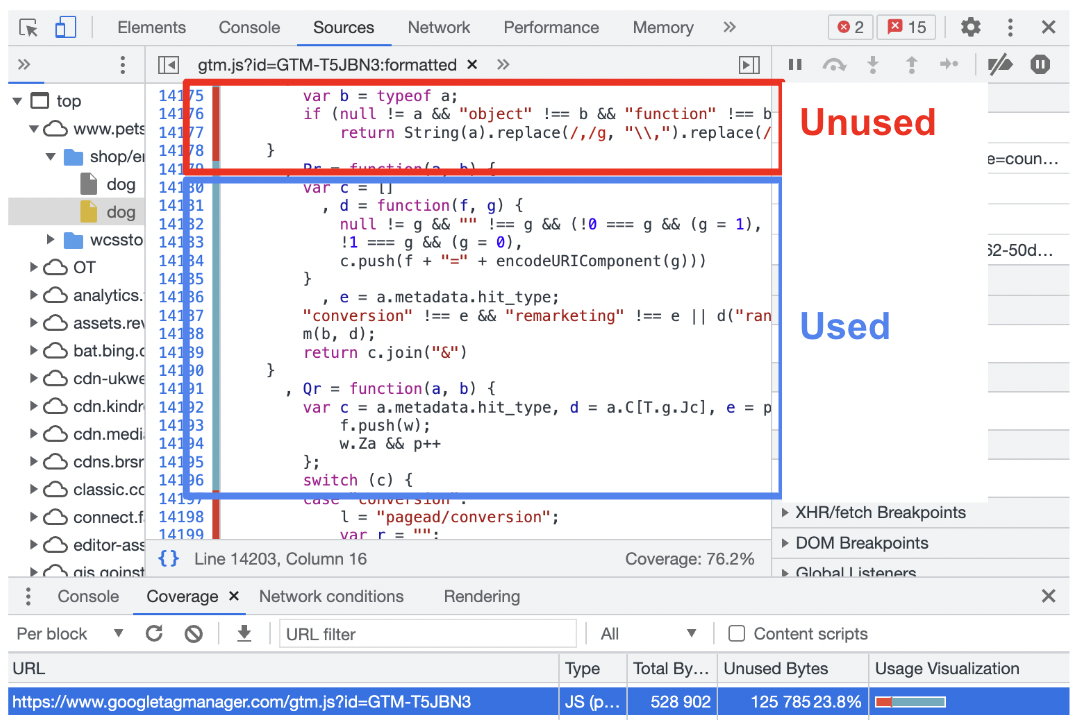
You can click on a row to open the resource in the Sources panel, which displays a line-by-line breakdown of the code.
Anything in the red block is the unused code, with the code used for the loading or functionality within the blue block.
It’s worth keeping in mind that refactoring a codebase to avoid unused code will depend highly on the technology stack used.
While acting on this information may fall outside our scope as an SEO professional, you will be armed with the information you need to share with developers.
Switch User Agent
Chrome DevTools also provides the ability to change the user agent and view how a page loads for different user agents, which may crawl the page.
This will enable you to review how Googlebot views the page and the tags, headers, and content it sees. You will also be able to identify if there is any cloaking on the site, where different content is shown to Googlebot versus users.
As the user agent changes within the browser, you can spot issues in real-time on the page. Crawlers may view things differently, so this is a helpful live test.
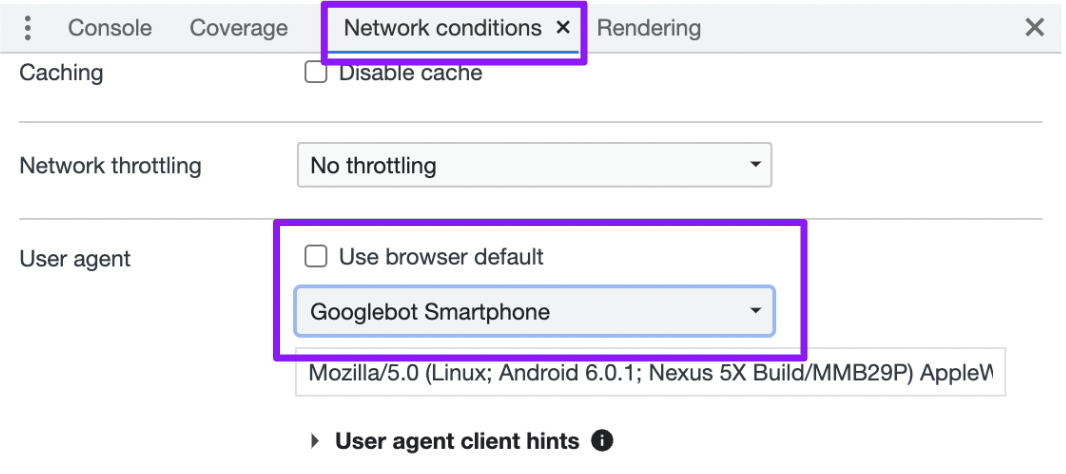
To switch the user agent, go to Network Conditions in the Console Drawer, then uncheck the “Use browser default” checkbox within the user agent section and select the user agent from the dropdown list of predetermined options.
Disable JavaScript
While Google has said it can index and rank Javascript content much easier than in the past, you should still ensure that important elements can load without JavaScript.
By disabling JavaScript within the browser, you can see how a page loads and how its interactive elements function without it.
Check that everything displays as it should and that content like carousels run without JavaScript.
Consider recommending that any elements that don’t display as they should be added to the HTML source code.
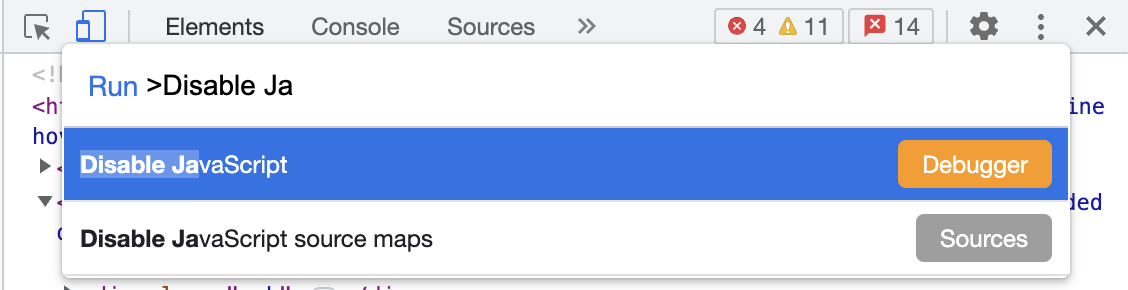
Click the three dots and select the Run command. This will pop up a command panel where you can type JavaScript and select Disable JavaScript.
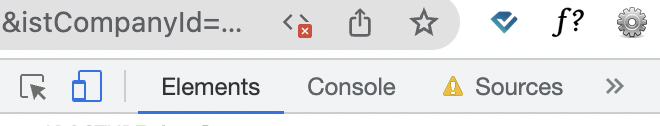
When JavaScript is disabled, you will see a yellow warning icon next to the Sources tab, as well as an icon within the URL bar.
It will remain disabled in the tab while DevTools is open, which means you can reload the page to see how it loads without JavaScript.
View Header Response
HTTP headers display information exchanged between the server and the browser, including the status code, robots rules, canonicals, content type, and cache headers for the page.
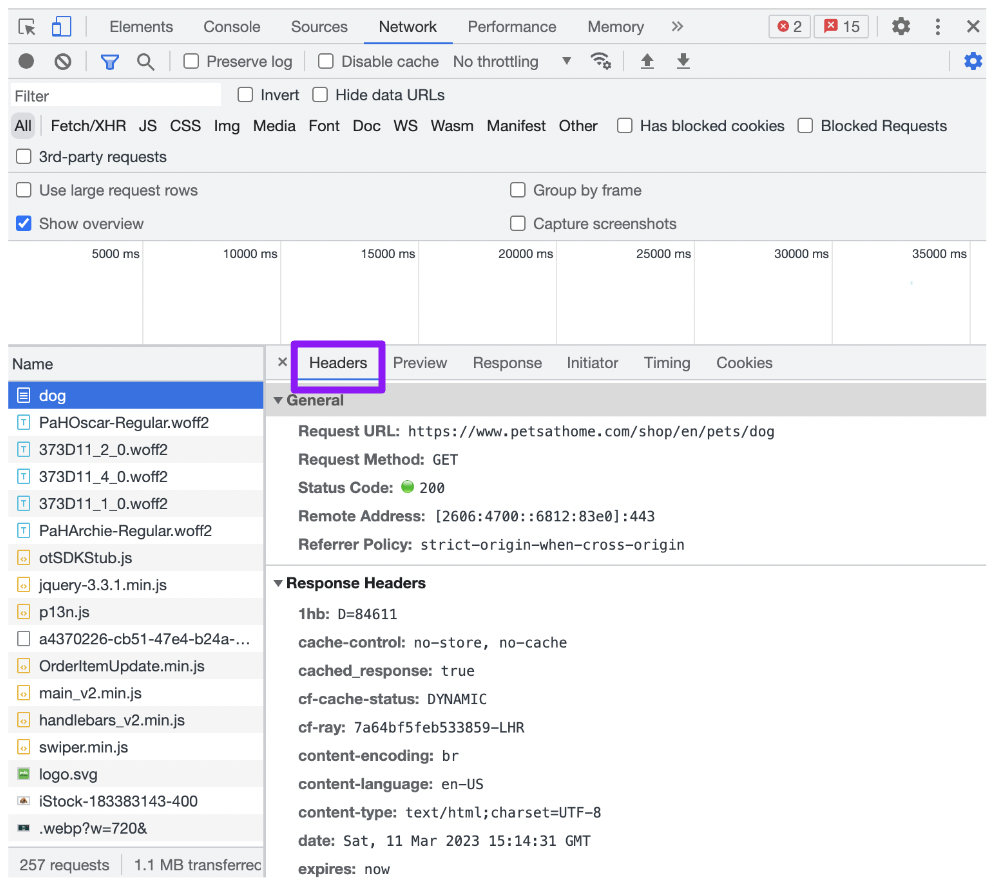
You can view the HTTP response of a page in the Network tab.
Click on the desired resource, navigate to the headers tab, and review the details. This can also be filtered by different content types, which means you can also check the header response of CSS and JavaScript resources.
The details to focus on within this tab are the request URL, request method, status code, content encoding, and last modified date.
Reviewing the server header response is an important way of ensuring you display the correct information to browsers.
You can also ensure that cache control works as expected and verify that you’re sending user agents the correct status code.
A common error you can audit here is for soft 404s, where the page loads as expected but serves a 404 code in the HTTP response.
Working With JavaScript
The console panel provides the ability to enter custom JavaScript code which can be used to extract a number of useful things on the page.
Find All Links On A Page
Chris Johnson did a great talk at BrightonSEO, where he shared useful JavaScript commands which can be run on the console to query and return certain elements.
Several different queries can be used here, and they can be combined to extract useful information.
One such function is to audit all outlinks on a certain page. This can help you identify where you are currently linking to from the page and find additional linking opportunities.
To start, querySelectorAll(selector) will return all matching elements.
In this example, we will type querySelectorAll(‘a’) to find all anchor links. Using $$ before the selector will display an array of elements.
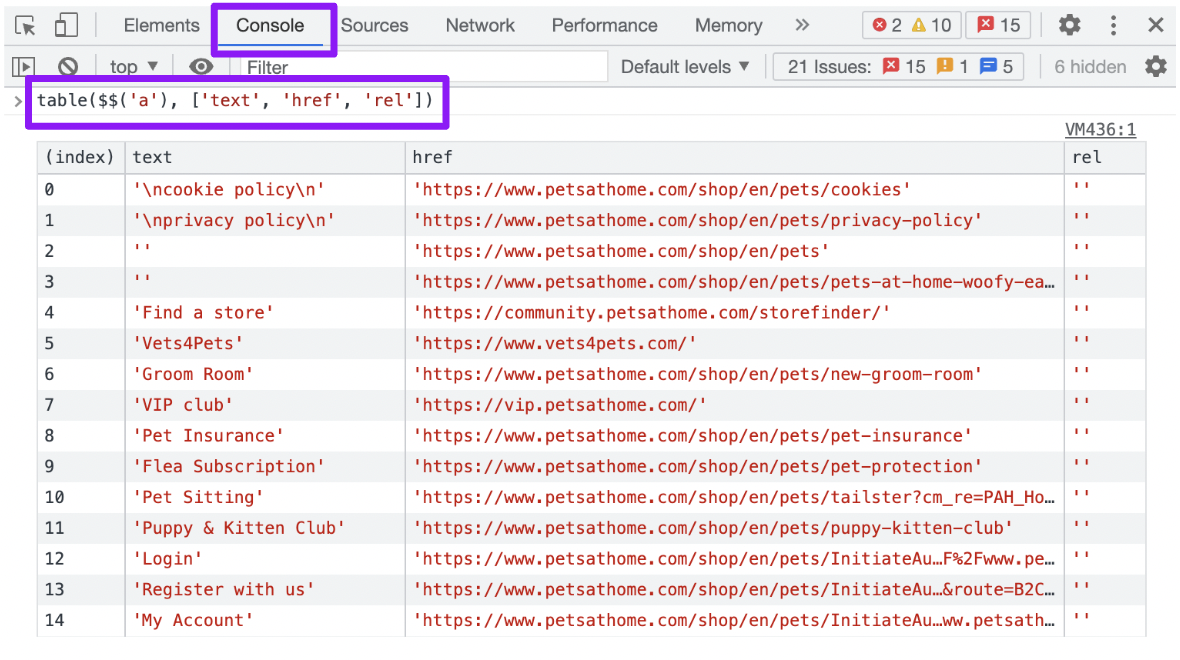
You can then also use the table(data) command to display the array in a table – for example, table($$(‘a’). This displays a lot of information, so to extract useful columns only, we can add them as arguments within square brackets after the command.
Therefore, table($$(‘a’), [‘text’, ‘href’, ‘rel’]) will display the anchor text, the page being linked to, and if nofollow or sponsored tags are added within the console itself.
Find Images – Their Height And Width
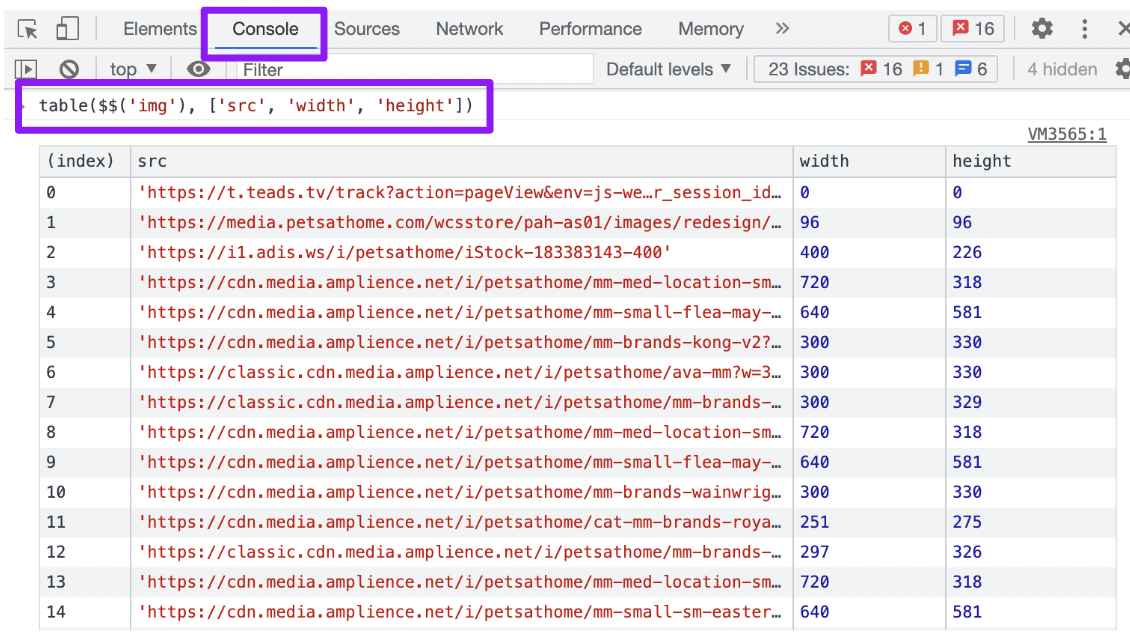
Another use of the console tab is to find images and their width and height dimensions.
Defining height and width for images ensures that sufficient space is allocated on the page before the browser starts fetching images.
If an image doesn’t have width and height dimensions, it can cause layout shifts. The page reformats as images are downloaded – if there’s no space allocated for them.
You can use the console to view a table with images and their height and width by writing: table($$(‘img’), [‘src’, ‘width’, ‘height’]).
Find JavaScript Errors
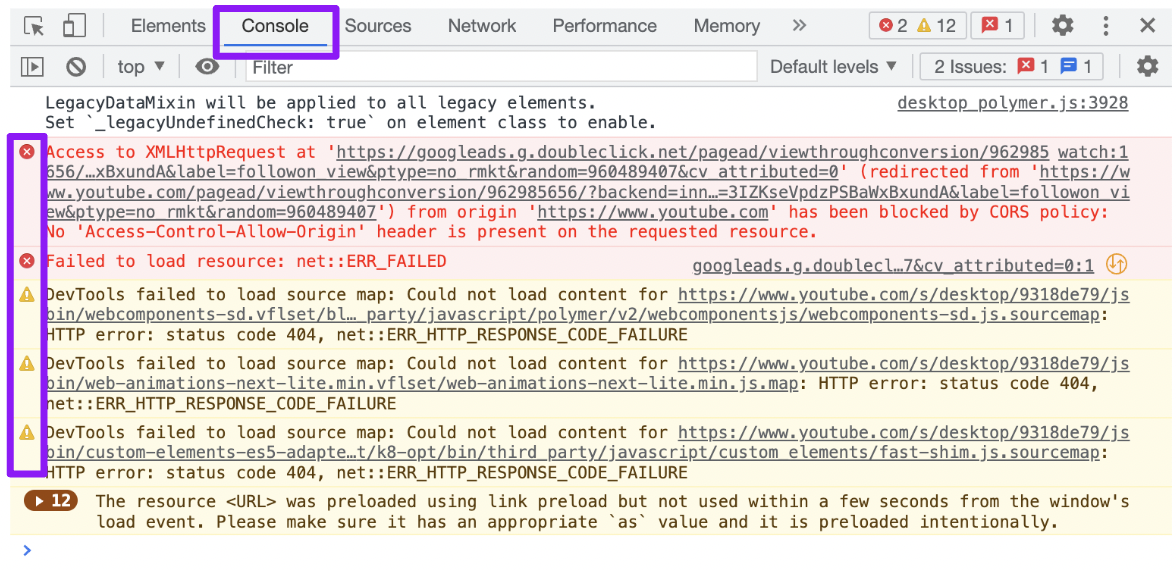
JavaScript errors can block content from loading and obstruct Googlebot’s ability to crawl the site.
Errors will be shown in the console, where you can add a filter to display only errors.
Clicking the error itself will take you to the sources tab, where you can display where in the script the error is occurring.
Sometimes, warnings shown here are not something we need to worry about as SEO pros, but when you find an error, the first thing to do is see whether it affects how the page renders and is indexed by Google.
Code errors mean that the code itself is broken, which can impact usability, which will, in turn, impact user experience and SEO.
SEO errors won’t affect users but can impact how search engines crawl the site. Since they aren’t visible to users, they’re more difficult to identify. This is where the console helps.
We can share these insights with developers with all of the information needed.
Helpful & Fun Extras
Copy XPath Or CSS Selectors For Scraping/Crawling
Working with multiple CSS selectors and XPaths when crawling or scraping a website can be challenging.
However, with the Elements panel in Chrome DevTools, both can be easily copied to the clipboard and then pasted into your crawling tool of choice.
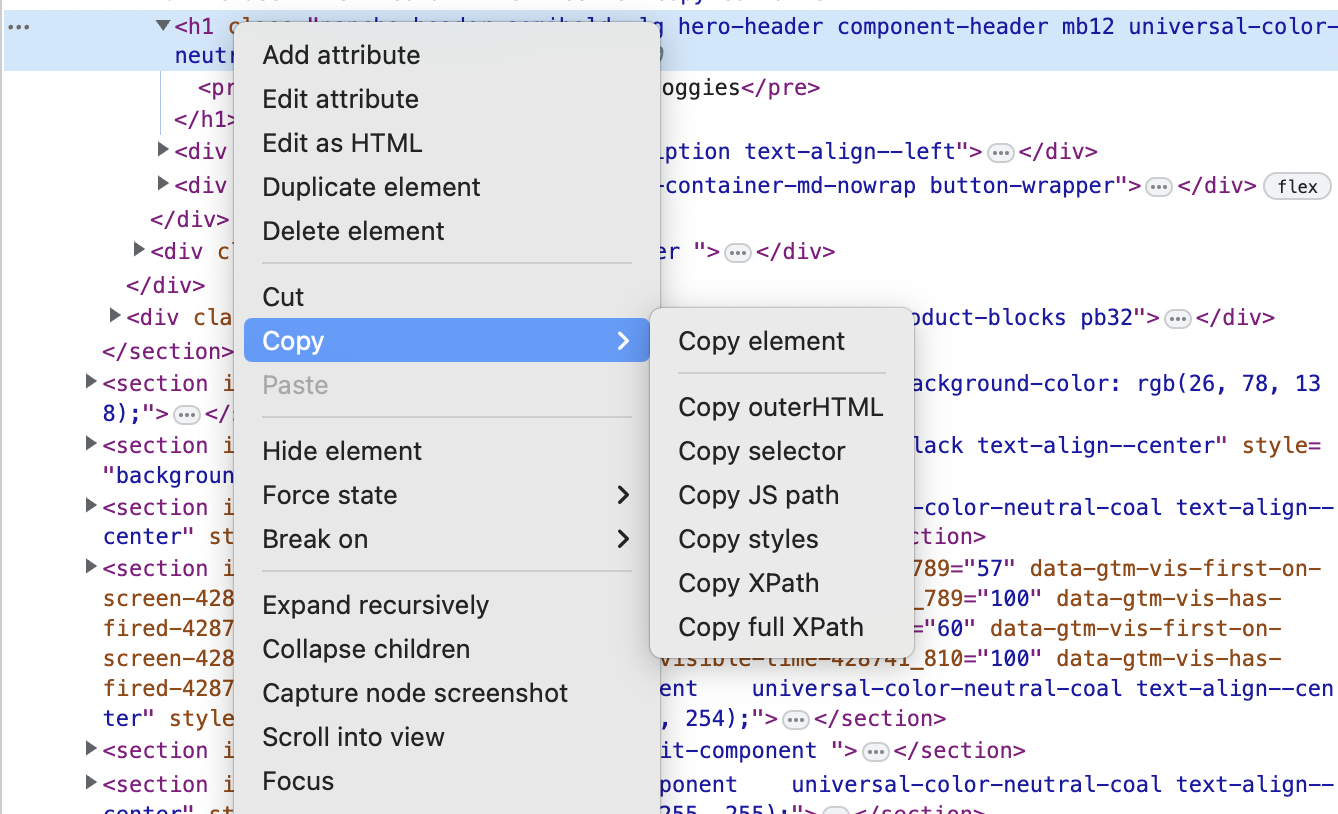
Make Edits To Elements
Using the Elements tab, you can edit the code and visually see how this will look on the page.
For example, if you’re thinking of editing the text in the H1 tag, you can easily do this and see in real-time how it will look.

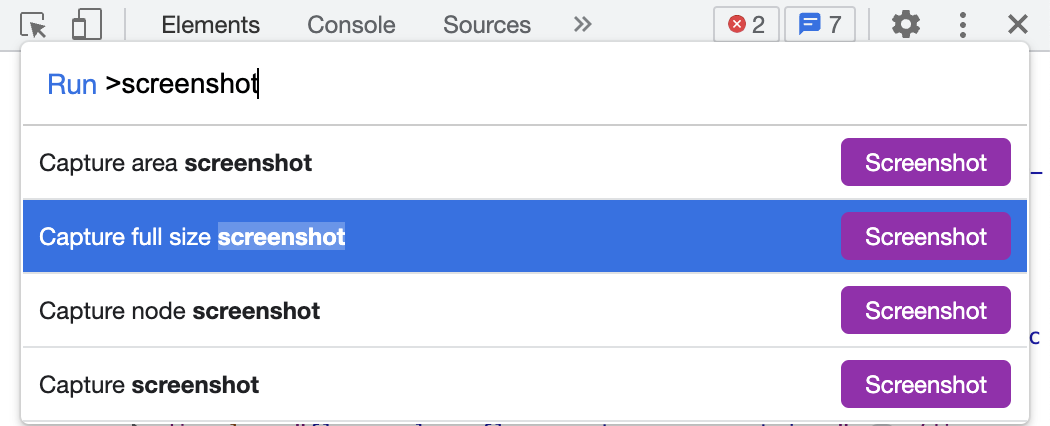
Take Full-Page Screenshots
Once you’ve made edits and if you want to share them with your developers, you can take a full-page screenshot using Chrome DevTools.
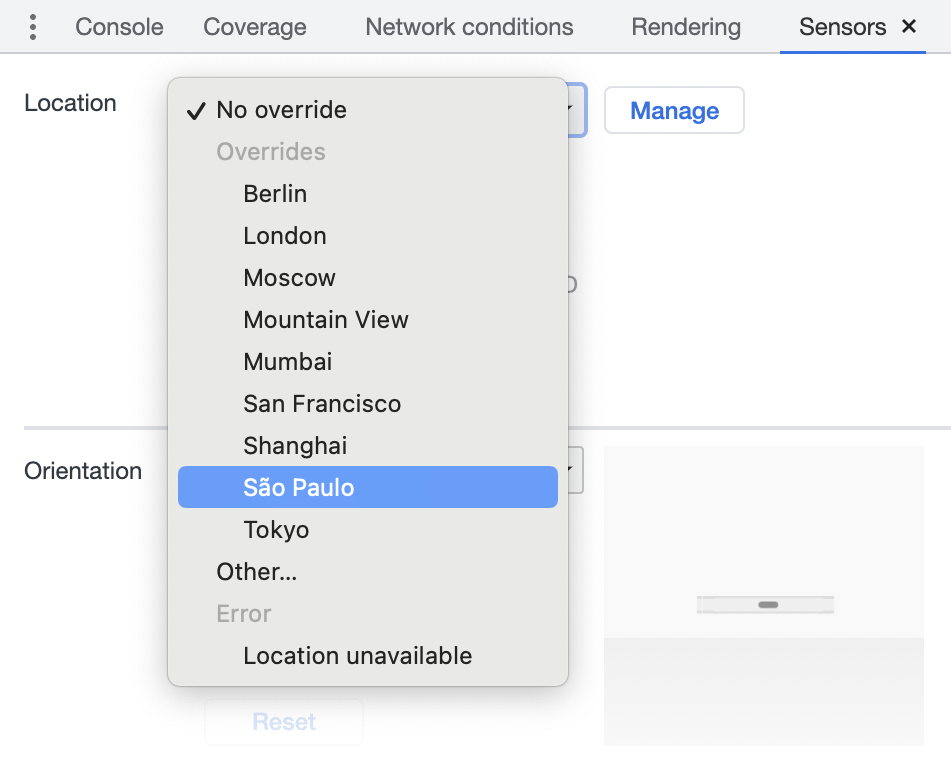
Switch Location
We often have to review how things look on websites for users in different locales.
While many VPN tools are available, you can simply modify the browsing location within Chrome DevTools.
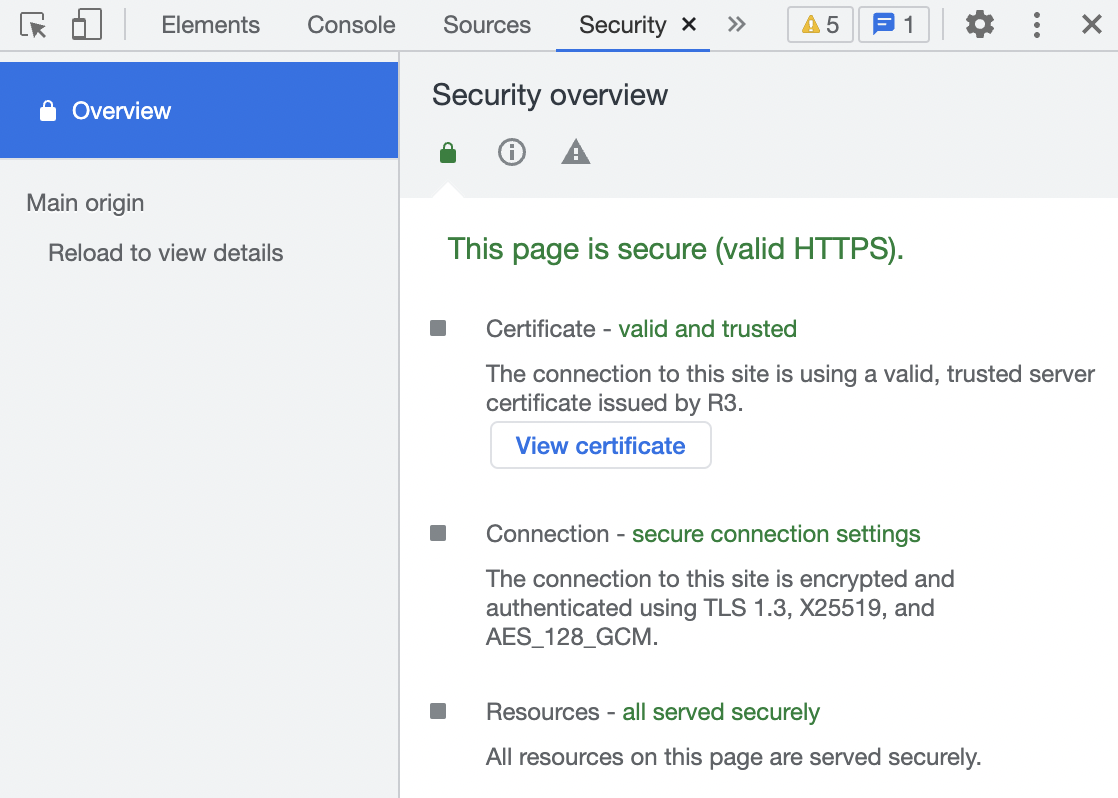
 Find Non-Secure Resources
Using the Security panel, you can verify whether the page is secure with a valid HTTPS certificate.
In addition, if there are any mixed content issues due to unsecure resources, you’ll see them here.
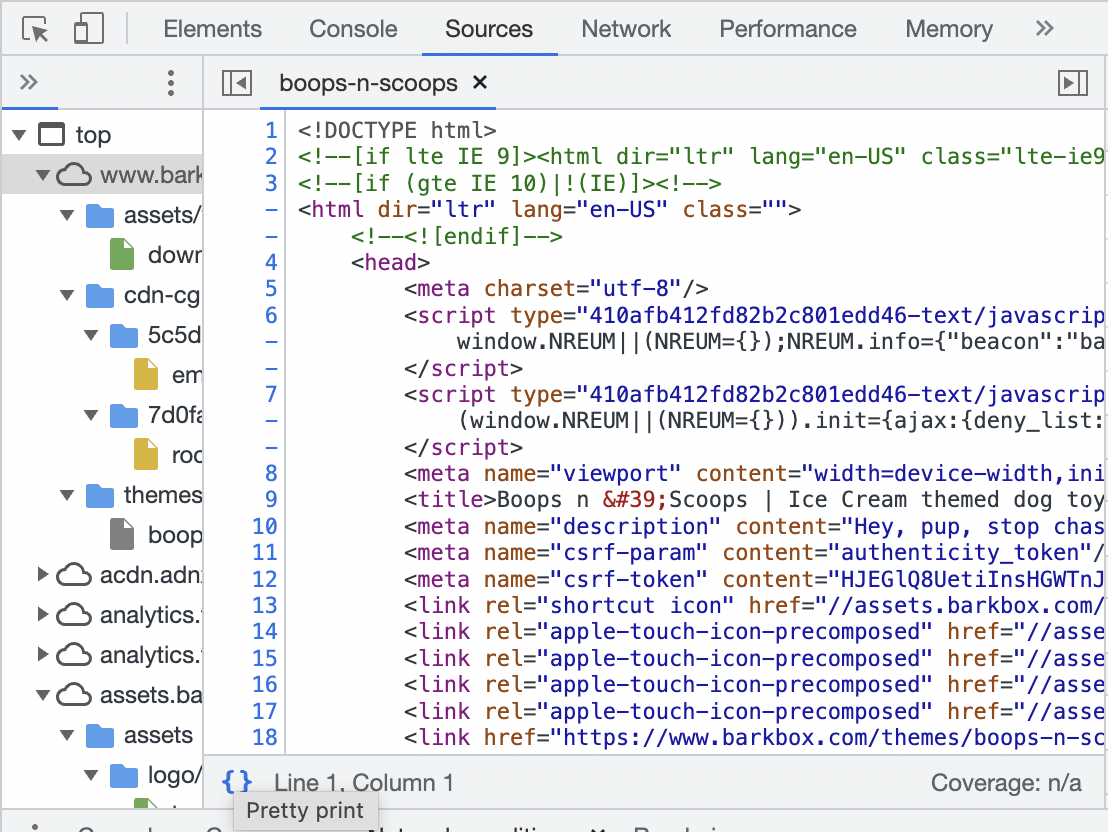
Beautify Code For Easy Review
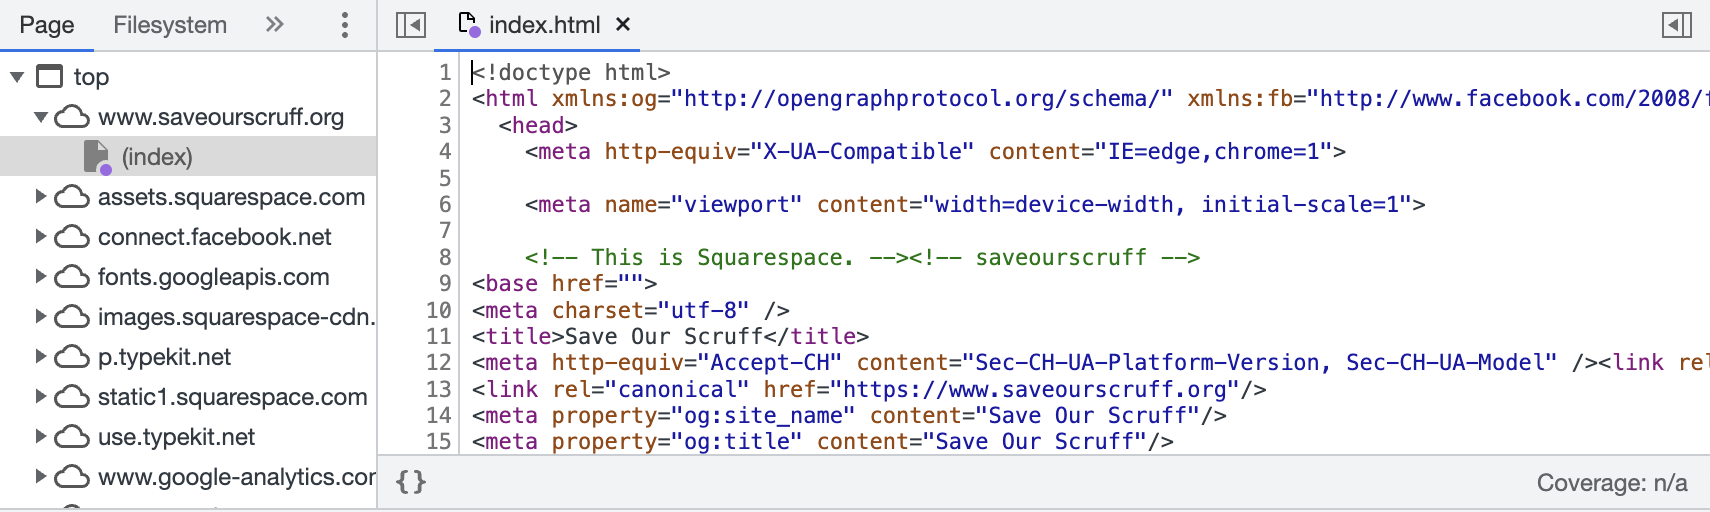
The Sources panel allows you to review code snippets of different elements of the page.
However, it is often minified; and therefore, it can be hard to read and understand.
When viewing an asset, you will see two curly brackets at the bottom left of the panel.
Clicking on { } will beautify the minified code to make it easier to parse.
In Conclusion
Are you ready to enhance your website analysis? Take the first step by downloading our SEO Audit Workbook and accessing the essential tools to streamline your technical SEO auditing process effectively.
Featured Image: Paulo Bobita/Search Engine Journal
In-post Images: Screenshot by author, May 2023
