Keeping an eye on the latest internet advertising revenue statistics gives you an edge over your competitors.
Online marketers need to stay updated about the latest marketing and internet advertising trends to minimize ad spend and maximize economic growth. This knowledge also helps you better understand the success of a digital promotion campaign.
Here are the 100 most important ad revenue stats for this year and ahead to help your business growth.
Let’s begin!
Single Grain enables us to increase our impact without increasing our headcount
Global Advertising Revenue: PPC and Social Media Ad Stats
Keep an eye out for: Common Types of Misleading Statistics in Advertising – And How to Spot Them
Here are the internet ad revenue statistics to help you plan your digital marketing strategy:
PPC Advertising Revenue Statistics
- In 2023, ad spending in the digital advertising market is expected to reach $118.20 billion USD. (Statista)
- Conversion rates can be boosted beyond 40% by combining similar audiences with display remarketing campaigns. (Techjury)
- U.S. digital ad spending is expected to reach over $390 billion by 2027. (Insider Intelligence)
- Brands earn an average revenue of $2 for every $1 spent on a PPC ad. (WebFX)
- PPC campaigns are reported to be a substantial driver for 79% of brands, contributing to their business and sales growth. (Startupbonsai)
- The average money spent on running a PPC campaign for small to mid-sized businesses is $9000 to $10000. (WebFX)
- For Search Ads, the average cost per acquisition across all industries and target markets is $41.40. (WordStream)
- B2B PPC campaigns cost between $115,000 and $122,000 on average. (Techjury)
- In the market for search advertising, the average ad expenditure per average user of the internet is expected to reach $378.60 in 2023. (Statista)
- About 63% of people are more likely to click on paid search ads on Google (63%), which is higher than any other search engine – Amazon (15%), YouTube (9%), and Bing (6%) (Digital Third Coast)
- The average cost per click for the Google Search Network ranges from $1 to $2. (SEOsandwitch)
- Bing Ads demonstrate an average click-through rate (CTR) of 2.83% across all industries. (Startupbonsai)
- As much as 80.5% of Google’s revenue comes from pay-per-click ads. (Websitebuilder)
- Compared to people who click on organic search results, visitors who click on a PPC ad are 50% more likely to make a purchase. (Valve+Meter)
- Digital advertising can raise brand recognition by 80%. (Techjury)
- Bing’s CPCs cost 20% lower than Google’s, on average. (Embryo)
- For PPC, 80% of firms utilize Google Ads, which is a large portion of the advertising industry. (Demand Sage)
- In Google Ads, 77% of advertisers intend to raise their ad spend in 2023. (Demand Sage)
- In 2023, Meta and Google are projected to represent 50.5% of total digital ad expenditure. (Websiterating)
- In fiscal year 2022, Microsoft earned around 11.59 billion dollars from search advertising. (Statista)
- In 2023, Google’s ad revenue is expected to rise by 9.5%. (Demand Sage)
- By 2023, Amazon is anticipated to experience a rise in its digital ad revenue share, reaching 7.1%, whereas Google’s share is projected to reach 28.6%. (Websiterating)
- The top three PPC ad positions account for over 50% of mobile conversions. (KlientBoost)
- Compared to SEO, PPC generates twice as many visitors. (Techjury)
- Publishers earn 68% of the revenue when using AdSense for content. (Websiterating)
- PPC advertising generates 50% higher conversion rates than organic advertising, resulting in increased traffic. (Small Biz Genius)
Dive Deeper:
* PPC for Ecommerce: 8 Effective Best Practices
* Demystifying PPC Pricing Packages: Optimizing Ad Campaigns
* Enterprise Paid Ads: A Guide to Landing High-Value Clients with PPC
Mobile Advertising Revenue Statistics
- In 2021, the Global Mobile Advertising Market was valued at USD 116.4 Billion, and it is projected to reach USD 397.2 Billion by 2028. The market is anticipated to experience a Compound Annual Growth Rate (CAGR) of 22.7% throughout the forecast period, indicating substantial growth. (LinkedIn)
- For non-gaming apps, in-app ad revenue is anticipated to increase by 6.2%, while for gaming apps, by 19.1%. (WebFX)
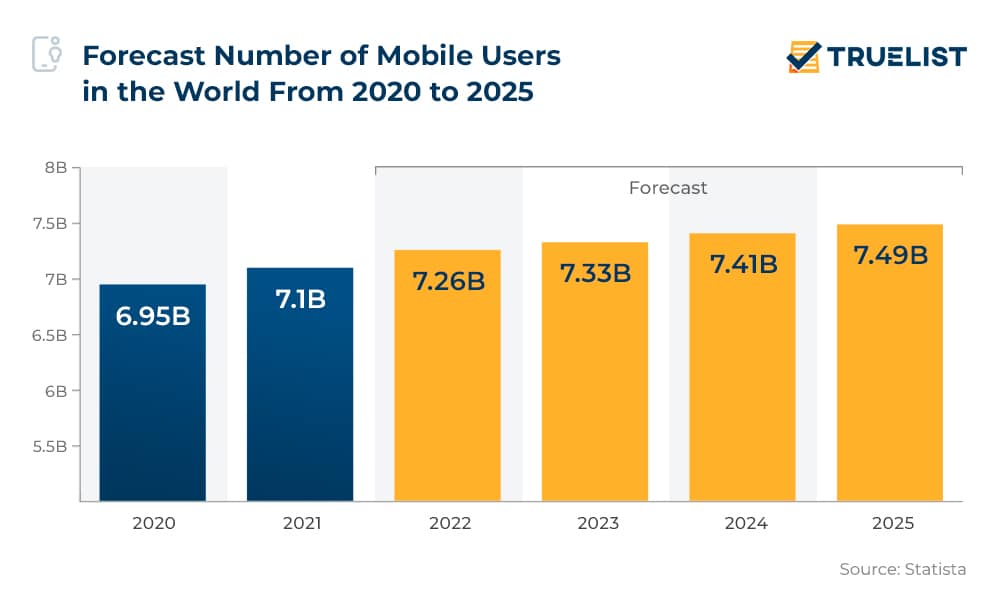
- The number of mobile users will reach 7.49 billion by 2025. (Truelist)
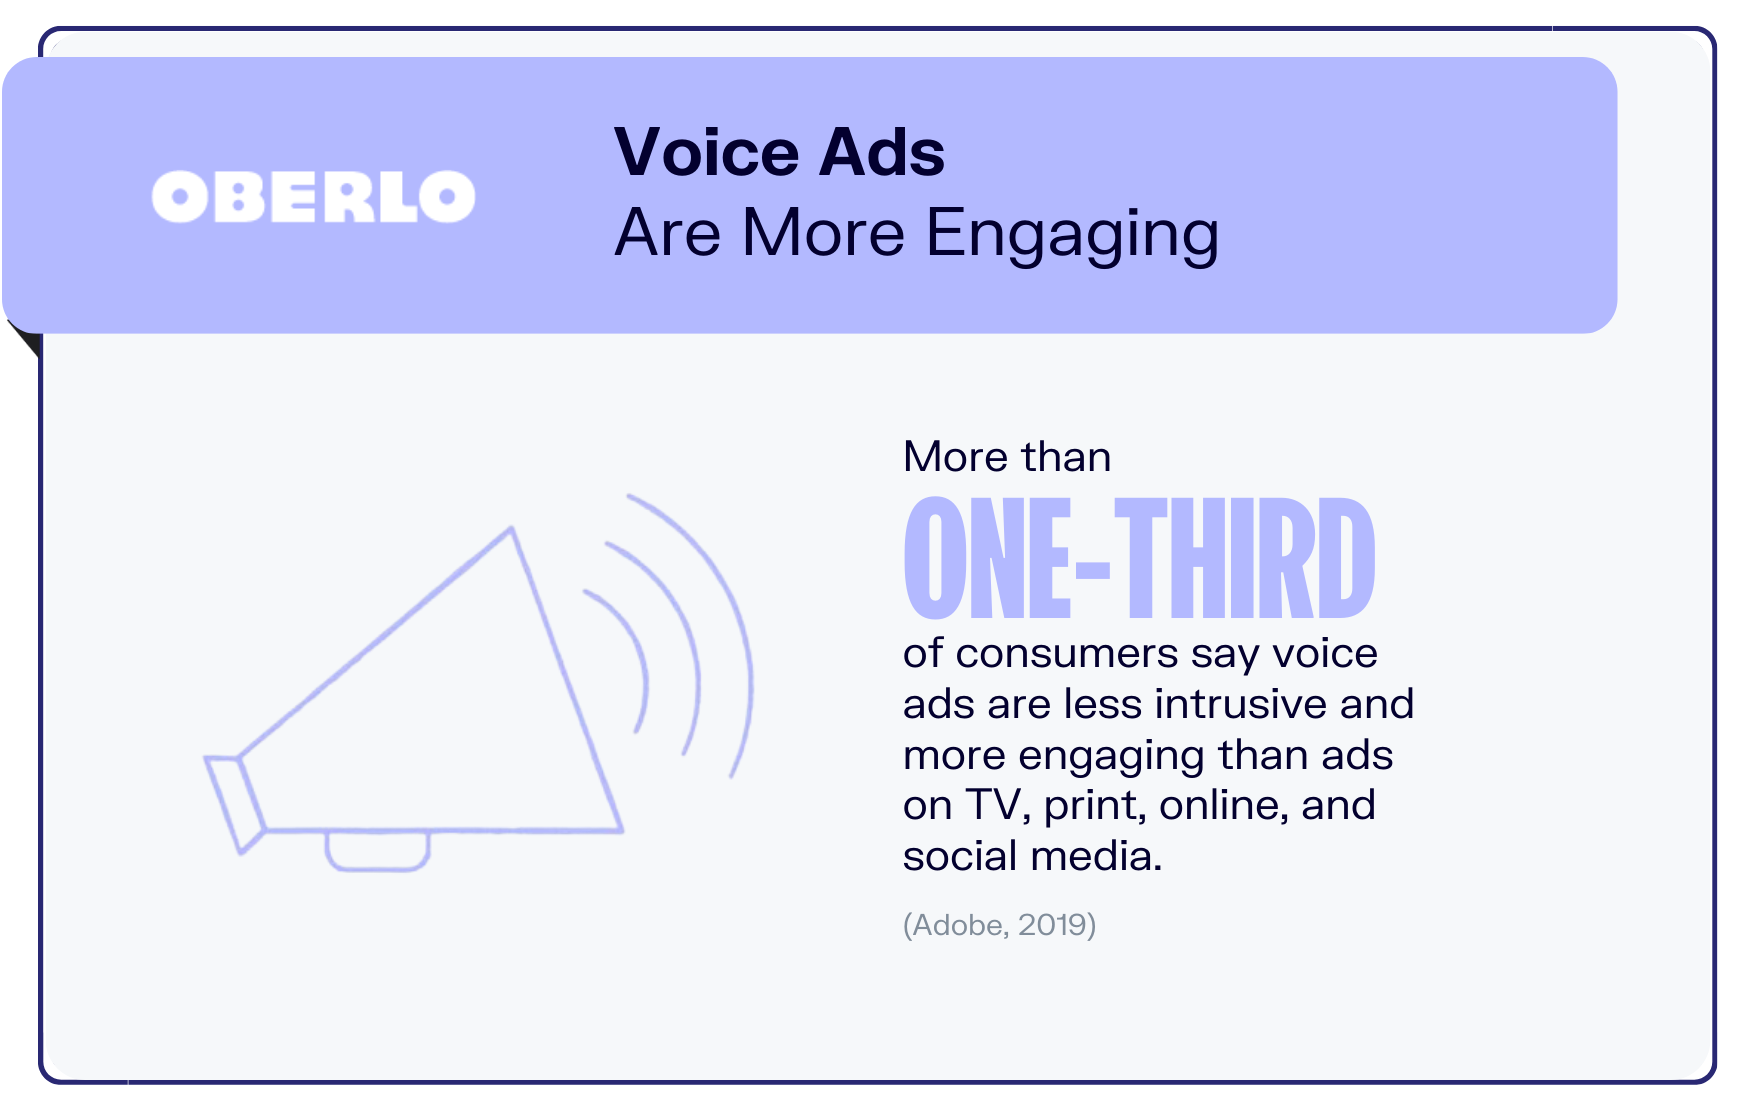
- 38% of consumers who have encountered voice ads on smart speakers perceive them as less intrusive. Additionally, 39% of consumers find voice ads to be more engaging. (Oberlo)
- Mobile advertisements account for nearly three-quarters (73%) of Facebook’s total ad revenue. (Business Insider)
- Google ads on the search network achieve an average click-through rate (CTR) of 4.10%, while the display network achieves a CTR of 0.60%. (Colorlib)
- 60% of all digital advertising expenditures worldwide are made on mobile devices. (Luisa Zhou)
- During the first half of 2022, the global viewability rate for mobile web display ads reached 66.9%, indicating that nearly 67% of display ads on the mobile web were visible during that period. This represents a growth of 3.6 percentage points compared to the second half of 2020. (Statista)
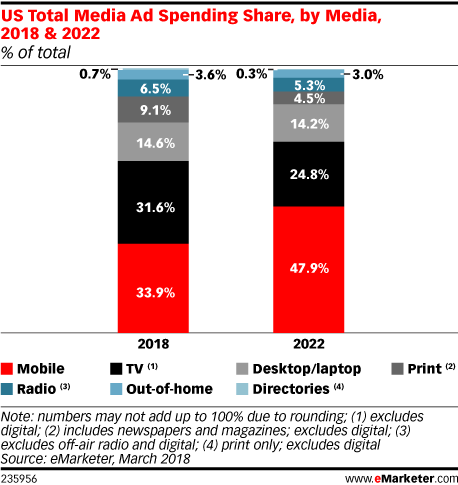
- Mobile ads are eating up TV advertisement share. The percentage of mobile ads was 47% in 2022, up from 33% in 2018. (Acquisio)
- Facebook mobile ads that incorporate images tend to be significantly more effective, with a likelihood of being at least 75% more impactful compared to simple text ads. (Appmysite)
- During the initial quarter of 2022, the global gross app revenue in the Google Play store reached approximately $11 billion USD, securing the top position in terms of revenue generation. (Enterprise Apps Today)
- The mobile advertising industry encompasses key regions such as North America, Latin America, the Middle East and Africa, Europe, and the Asia Pacific. North America holds the largest market share among these regions, signifying its prominence in the industry. (Expert Market Research)
- 7.33 billion people will use mobile globally by 2023, increasing the potential of generating revenues through mobile advertising. (TrueList)
- 72% of U.S. consumers engage with voice search using digital assistants like Alexa and Google Assistant. (Oberlo)
- If your website is not optimized for mobile, you lose 61% of users. (TrueList)
- Among mobile users, 14% of horizontal video ads capture the attention of 30% of viewers, whereas the majority of users engage with up to 90% of vertical video ads. (Publift)
Influencer Advertising Revenue Statistics
- 9 out of 10 marketers agree that influencer promotion is effective. (Oberlo)
- According to a research by Tomoson, businesses are generating a return of $6.50 for every $1 invested in influencer marketing. The survey further revealed that marketers consider influencer marketing their fastest-growing online customer-acquisition channel, surpassing the growth of organic search and email marketing. (Tomoson)
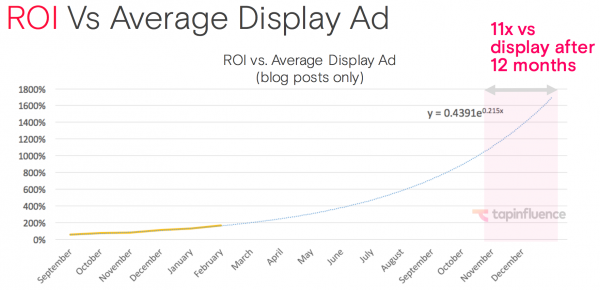
- Influencer advertising generates up to 11 times more ROI than any other type of digital marketing strategy. (Grin)
- Micro-influencers account for half of all influencers. (Shopify)
- Micro-influencers earn commissions ranging from 5% to 30%. Larger influencers typically fall within the 8% to 12% commission range. (Hootsuite)
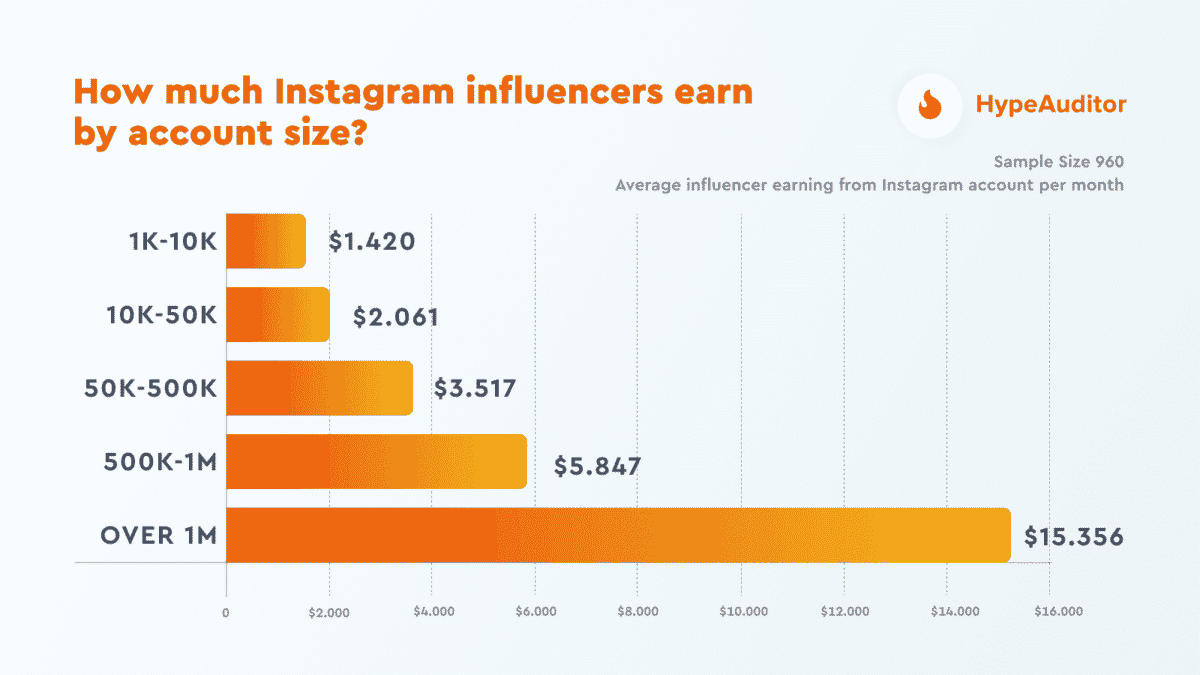
- Influencers with millions of followers earn an average income of more than $15,000. (Neal Schaffer)
- Since 2019, the global influencer market has more than doubled. The market is valued at a record $21.1 billion dollars in 2023. (Statista)
- Approximately 40% of Twitter users have reported making a purchase directly influenced by a tweet from an influencer. (Influencer Marketing Hub)
- In a global study of PR agencies conducted in 2023, 39% of participants indicated they work with up to 10 influencers, while 14% said they worked with more than a thousand. (Statista)
- Compared to other forms of promotion, word-of-mouth marketing increases client retention by 37%. (WebFX)
- Another social media stat worth noting is that almost 40% of B2B marketers intend to increase their use of influencer marketing in the future. (Grin)
- Cristiano Ronaldo, with an Instagram following of 423 million, commands a price range of $620k to $1M for a single post. Similarly, Dwayne Johnson, the Hollywood action movie star with 154 million Instagram followers, charges between $504k and $840k for an Instagram post. (Influencer Marketing Hub)
- Influencer Marketing delivers an impressive 11 times the return on investment (ROI) compared to banner ads. Households showed a 10% increase in purchasing Silk products compared to the control group. For every 1,000 individuals who viewed influencer marketing, their collective purchases of Silk products amounted to $285 more than the control group. (Convince and Convert)
- Consumers trust the advice of influencers 61% of the time. (Social Shepherd)
- 50.7% of businesses working with influencers are online store owners. (Shopify)
- As high as 93% of Millennials trust online reviews and rely on them to make well-informed decisions. These reviews are considered as trustworthy and credible as recommendations from friends or family members. (Influencer Marketing Hub)
- India tops the list of countries with the maximum number of Instagram users having 229.55 million users in January 2023. (Statista)
Dive Deeper: Influencer Marketing Strategy: The Ultimate Guide to Growing Your Business with Brand Partnerships
Display Advertising Revenue Statistics
- The global programmatic display ad spend is projected to reach $558 million in 2023. This represents a significant 13.1% growth compared to the previous year and nearly double the amount recorded in 2019. (ROI Revolution)
- Further, global digital advertising spending is estimated to rise from $521.02 billion USD in 2021 to a substantial $876 billion USD by the year 2026. This signifies a significant growth trajectory in the digital advertising industry. (Gitnux)
- The market for display ads is expanding at a 12% rate yearly. (Meetanshi)
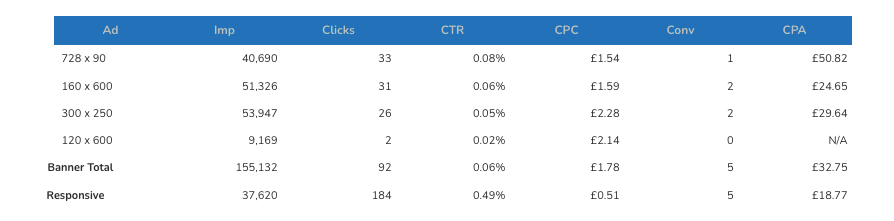
- Responsive display ads offer notably high click-through rates (CTRs). Here is an example of a Google Ads campaign tested by David Miles, an expert commentator from Smart Insights. The responsive ads achieved a CTR of 0.49% compared to banner ads, which was way behind at 0.06%. (Smart Insights)

- Programmatic ads are helpful in reaching the target audience faster. Over 90% of display advertising spending worldwide is expected to go toward programmatic ads in 2023. (Meetanshi)
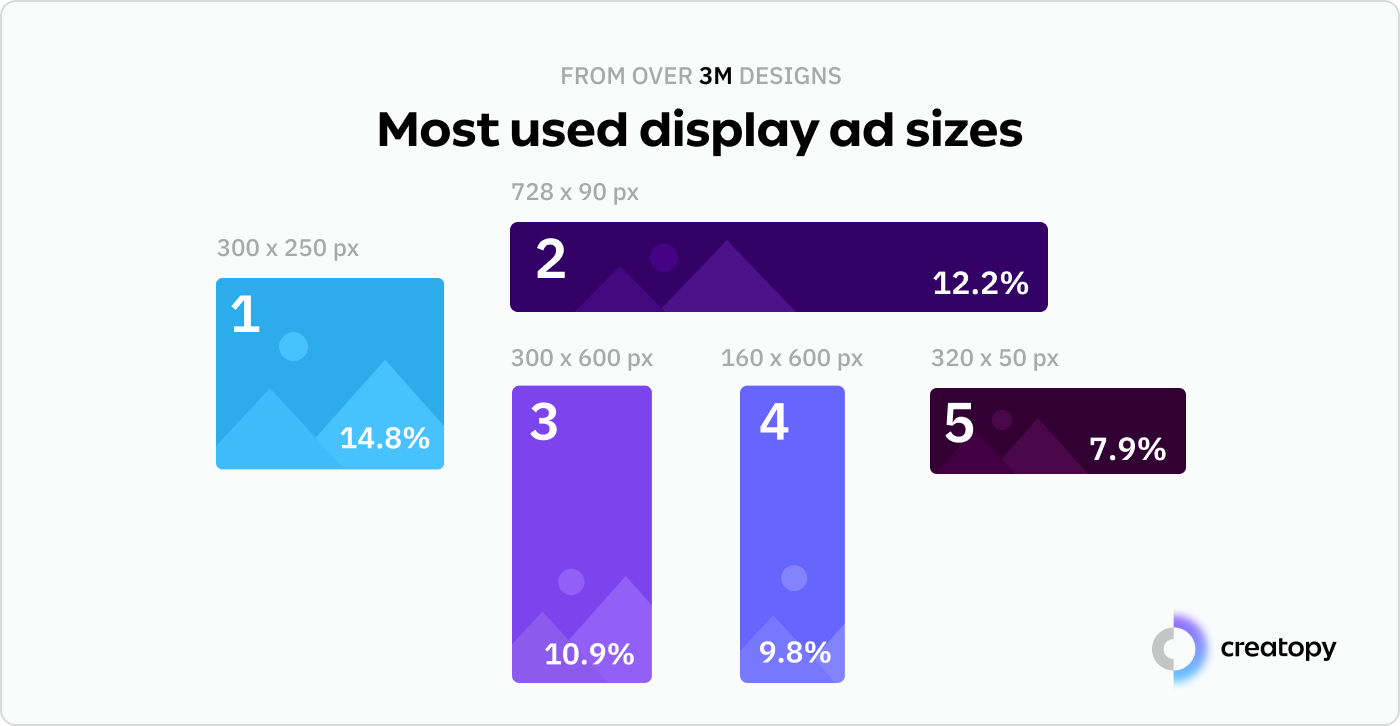
- While the Large Rectangle (336×280) size usage dominated the ad landscape last year, it was replaced by the 300×250 size in 2022. Interestingly, the Large Rectangle ad size was absent from the top five ad sizes used in 2022. (Creatopy)
- Across all industries and demographics, the Google Ads network has an average click-through rate of 0.46%. (Meetanshi)
- The leaderboard banner size, commonly known as 728 x 90, is the most frequently used for display ads, used by 57% of advertising. (Meetanshi)
- In 2023, U.S. native advertising will make up 59.7% of all display advertising. (Insider Intelligence)
- Display advertising in the United States will make up 43.8% of media spending in 2023. (emarketer)
- In 2023, U.S. display advertising is anticipated to rise 15.5% to reach $165.84 billion. Compared to 2022, its growth rate is 5.4% lower. (eMarketer)
- 90% of all internet users are reached through the Google Display Network. (Google)
- When compared to standard display advertising, marketers who use smart display campaigns see a 20% increase in conversions at the same CPA. (Google)
- For display adverts, the standard CPA is $76. (WordStream)
- Native ads generate 53% more views than traditional display ads. (99 Firms)
Video Ad Revenue Statistics
- In 2022, more people spent on video advertising, which reached nearly $75 billion U.S. dollars, representing approximately 30% of the total worldwide expenditure on display ads. The United States was the top country in terms of video ads spending, with China and the United Kingdom following closely behind. (Statista)
- 50% of Instagram users (both Gen Z and Millennials) have visited a website to make a purchase after viewing an advertisement on Instagram Stories. (Dash)
%20(1).png?width=777&height=583&name=Influencer%20stats%20(8)%20(1).png)
- 96% of advertisers acknowledge the importance of using video as a key component of their marketing plan. (Popupsmart)
- Compared to other material types, 51% of individuals are more likely to share videos with their friends and family. (Sprout Social)
- During the first fiscal quarter of 2023, YouTube surpassed analysts’ expectations by generating $6.69 billion in advertising revenue, outperforming the projected figure of $6.6 billion. (Techcrunch)
- Video is already being used as an advertising tool by 87% of companies. (Neal Schaffer)
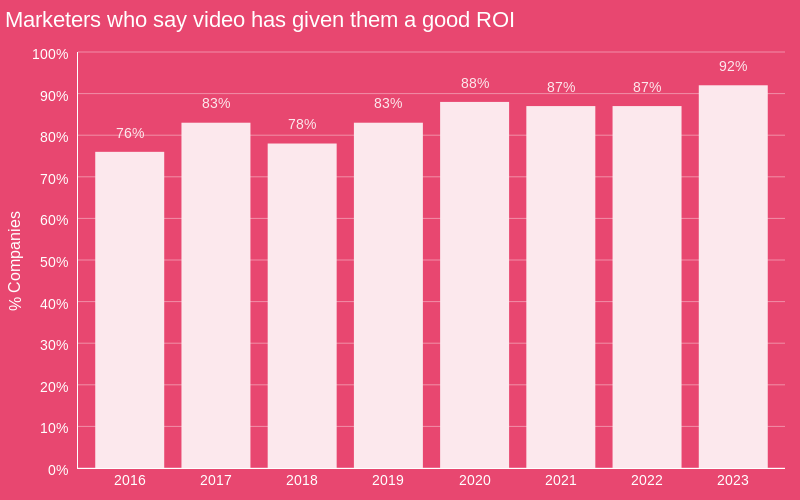
- In 2023, 92% of marketers have agreed that video gives them an excellent return on investment. This percentage is up from 76% in 2016. (Wyzowl)
- A video on your landing page at least doubles conversion rates by 80%. (Neal Schaffer)
- 73% of B2B companies reported that video content positively influenced their ROI figures. (Explain Ninja)
- At least 88% of marketers are happy with their figures and return on their video investment. (Neal Schaffer)
- 39% of video advertisers believe it is getting more expensive. (Wyzowl)
- According to 63% of video advertisers, one factor they use to gauge the ROI for their video content is the number of views. (Wyzowl)
- Customer engagement and retention are key measures that 42% of video advertisers use to calculate the effectiveness of their video content. (Wyzowl)
Dive Deeper:
* Spotify Ads 101: How to Run Successful Audio and Video Ads
* 9 Tips for Creating Instagram Video Ads that Actually Generate Sales
* 8 Benefits of Video Ads: Why You Need Them in Your Advertising Strategy
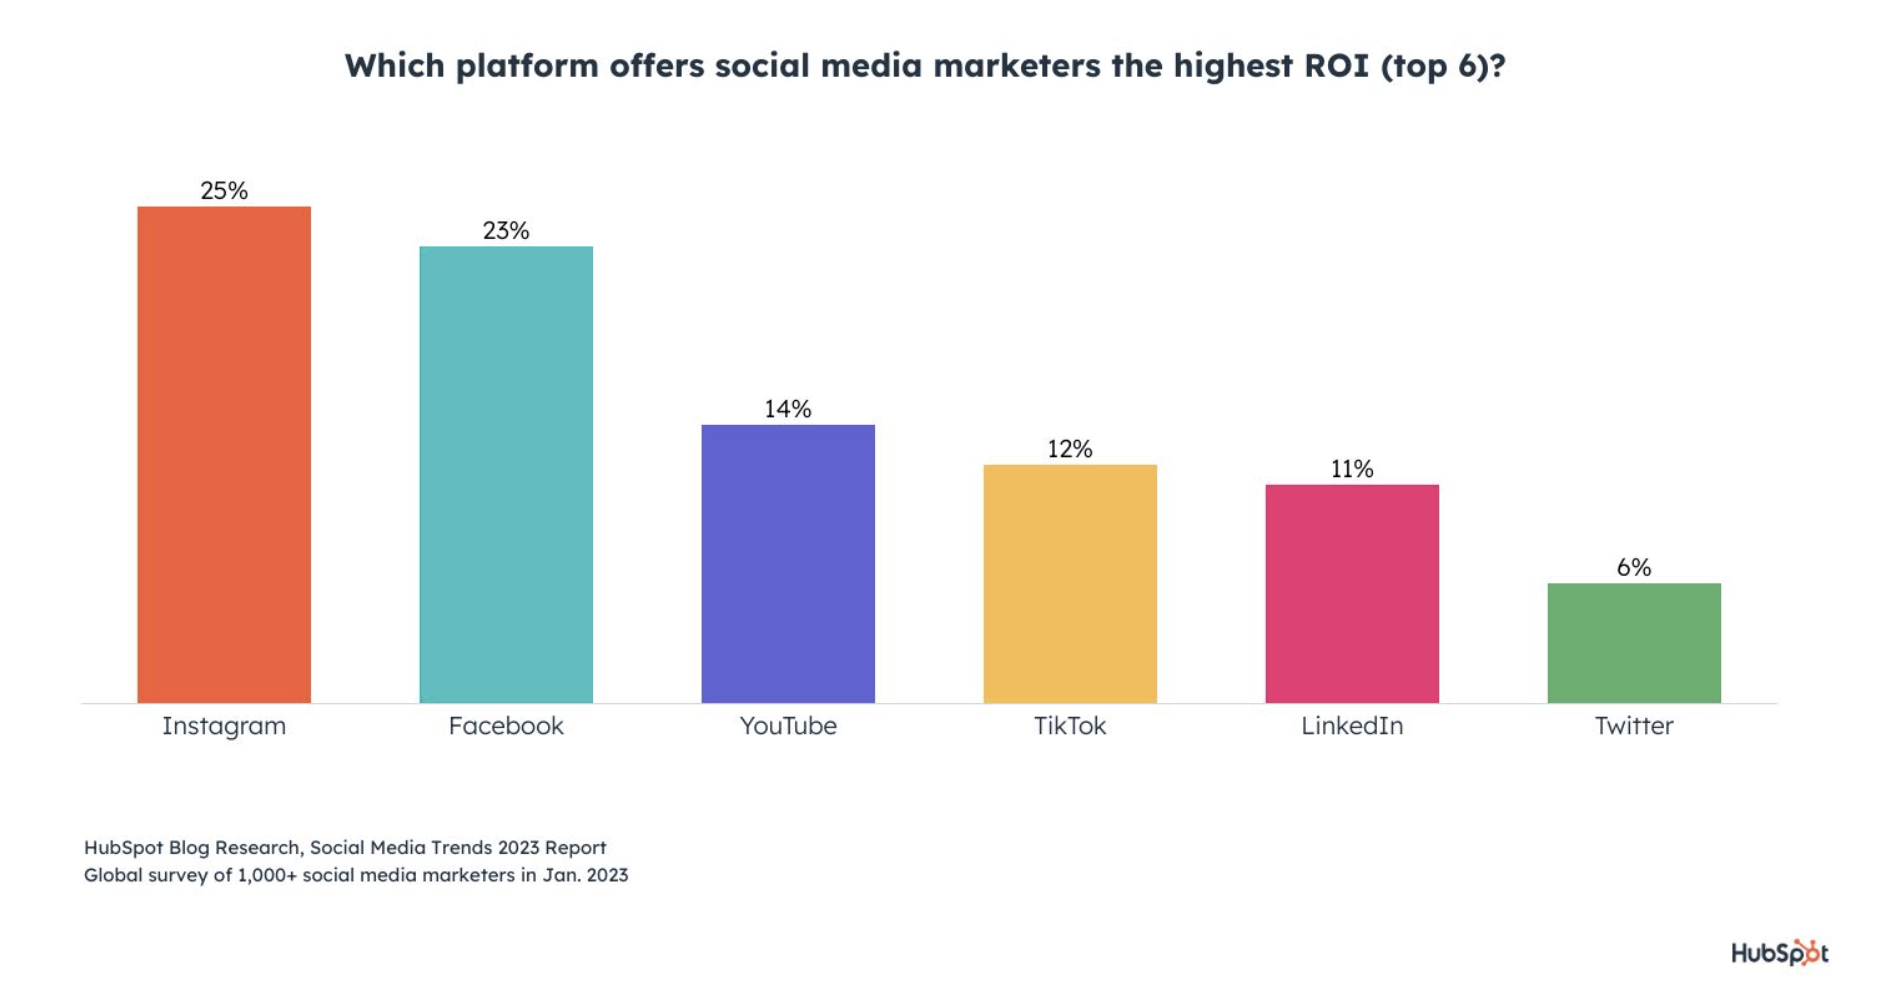
Social Media Ad Revenue Statistics
- Instagram offers the highest ROI at 25% on social media advertising spending, while Twitter ads offer the lowest at 6%. (HubSpot)
- Social media platforms like Facebook and Instagram are used by 54% of internet users to research products and services. (GlobalWebIndex)
- Another leading social media statistics is that 87% of advertisers use social media ads, making it one of the most popular marketing promotion methods. (WebFX)
- 64% of consumers make a purchase after watching a video on social media. (Biteable)
- Social listening is an effective social media marketing strategy, say 62% of advertisers. (HubSpot)
- By 2027, it is currently anticipated that mobile will account for 130.5 billion of all social media ad spending globally. (Sprout Social)
- An average Facebook user clicks on 12 ads per month. (Websitebuilder)
- In 2024, Facebook ad revenue is projected to rise to $75.11 billion. (Hootsuite)
- Facebook ad revenue in the United States amounted to $50.57 billion in 2021 and is projected to reach $56 billion by 2024. (Statista)
- In 2023, it is expected that social media advertising will cost $268 billion overall. (Sprout Social)
- Among advertisers, retargeting advertisements are best for reaching your potential audience, as indicated by 77% of B2B and B2C marketers who incorporate them into their Facebook and Instagram ad campaigns. (Sprout Social)
- TikTok offers the highest engagement rates at 4.25%, which is way higher than Instagram, Facebook, and Twitter. (Sprout Social)

- 29% of marketers anticipate spending more on Instagram than any other medium in 2023. (Sprout Social)
- Around 26% of the clicks on Facebook ads result in a purchase. (99 Firms)
- American adults use Twitter every day for an average of 34.8 minutes. (Sprout Social)
- Approximately 33% of individuals choose to click on a paid search advertisement as it directly addresses their specific search inquiry. (Embryo)
- Facebook ads that leverage advanced targeting to beat ever-growing competition are used by more than 90% of marketers worldwide. (Wazile)
- Of all social media marketing services, short-form video delivers businesses the highest return on investment. (Sprout Social)
Dive Deeper: Top 8 Benefits of Social Media Advertising
Last Word on Advertising Revenue Statistics
An effective online advertising strategy enables you to enhance your business revenue. Keeping an eye on the current advertising data helps you evaluate the growth of your advertising campaigns against your digital ad spend.
Use the above latest global ad spend stats to outsmart your competitors and generate a higher return on advertising spend (ROAS).
If you’re ready to level up your business with strategic advertising, Single Grain’s paid ads experts can help!👇