5 KPIs to Track and Measure Blog Success

It’s impossible to overstate the importance and value of blogging for your firm. Writing and publishing valuable articles is a cornerstone of content marketing and can establish your firm as a subject-matter expert while driving traffic to your site and generating leads.
In this article, we’ll outline five fundamental key performance indicators (KPIs) for measuring your blog’s success. Note, however, that your marketing team’s individual KPIs should largely focus on specific marketing measurables that define success for your campaigns (leads generated, purchases made, etc.).
Further, this article will only discuss KPIs that are measurable in Google Analytics 4. Make sure to also discuss additional KPIs — such as social shares or email engagement — internally to see if these metrics fit your campaigns better.
First, understand dimensions
As noted by Google, every report in Google Analytics is made up of dimensions and metrics. Dimensions are the attributes of your data, while metrics are quantitative measurements of particular aspects of your website.
Taken together, dimensions and metrics can help you build tables for data visualization. For example, you could look at the “Sessions” metric and compare it against the “City” dimension to see how many sessions you received from different cities in a pre-defined time frame.
In the contexts of this article, the KPIs you’ll want to focus on to measure your blog’s success will count as metrics when viewed in Google Analytics 4 and any related properties.Common KPI examples include “Active Users,” “Avg. Engagement Time,” “Engaged Sessions,” “Engagement Rate,” or any number of other measurable present in the metrics section of Google Analytics.
Without context, however, these metrics are just data. They only gain meaning when understood from the perspective of the dimensions they relate to. For example, if you want to understand whether a change to your website resulted in a higher or lower engagement rate among your users, you would look at the “Engagement Rate” metric from the perspective of dimensions such as “Page path + query string” (to look at performance across pages), “Default channel grouping” or “Source / medium” (to look at performance across acquisition sources), or “First user campaign” (to look at performance based on ad campaigns).
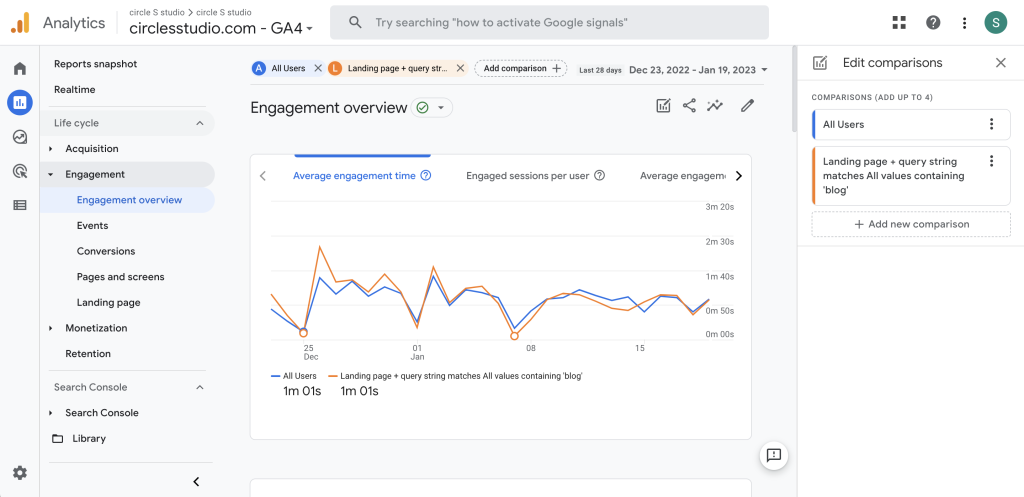
Importantly, you can use these dimensions to filter your Google Analytics 4 reports and gain a better understanding of your website data by creating Comparisons in the GA4 dashboard.
1
Engaged sessions
One of the main metrics to track for your blog is sessions, which measure overall traffic to your blog. A session is a period of time a user is engaged with your website – so, a visit. Over the course of a week, one recorded user could have multiple sessions to your blog.
It’s important to not just look at the number of sessions, but to track your traffic over time and in context. Compare your traffic month to month to look for growth and for trends. Look at the topics and formats of blog posts from those months that have higher performance and those that have poorer performance, and identify trends. By comparing performance to the type of content, post frequency and distribution strategy, you can better refine your strategy moving forward.
Further, take particular care to look at the number of engaged sessions in comparison to the number of sessions, as this ratio determines each page’s “engagement rate.” In GA4, engagement rate acts as the inverse of bounce rate, and largely shows how engaging and effective a particular piece of content is to a user (i.e. at what rate does a new session become engaged by a piece of content).
2
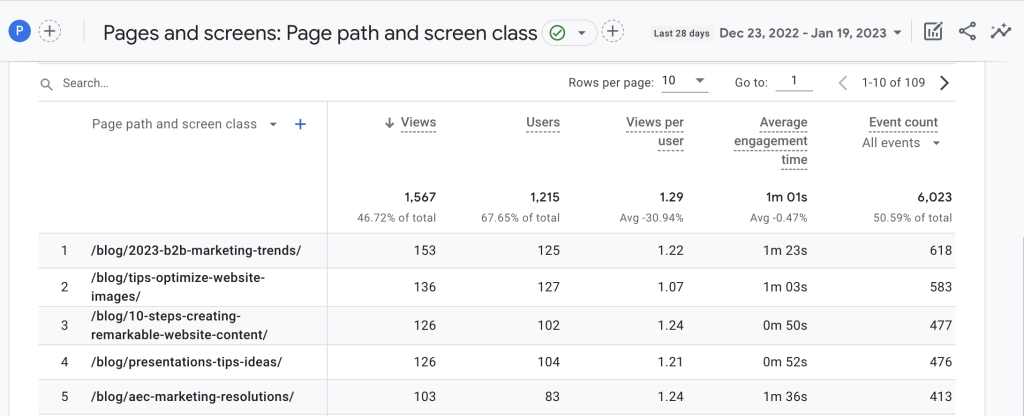
Top posts by views
This one is pretty straightforward. Keep track of which blog posts garner the most attention by looking at the pageviews for each article. Then, use other metrics to help you determine why those posts were the most popular. Did your top post also have a high percentage of Organic Search traffic? Maybe this article was especially well-optimized for search engines. Did the post include video? You may want to consider incorporating more video into your posts. Continuously look at these different metrics together and watch for trends to inform your content strategy moving forward.
3
Average engagement time
Average engagement time is defined by Google as “The average length of time that the app was in the foreground, or the web site had focus in the browser.” This metric is calculated as “Average engagement time = Total user engagement durations / Number of active users.”
In practice, average engagement time shows trends in how long users are spending on a particular page (i.e. how long the page was in focus in the browser). This is a great measure of engagement and the relevancy of your content to your audience. If one post has low average engagement time, it could be that the article isn’t what users were expecting from the preview, or the introduction or copy in general may not be very engaging. Compare your articles with the lowest average time to those with the highest, and look for themes in content type, length, formatting, headlines, etc.
4
Acquisition numbers by traffic channels
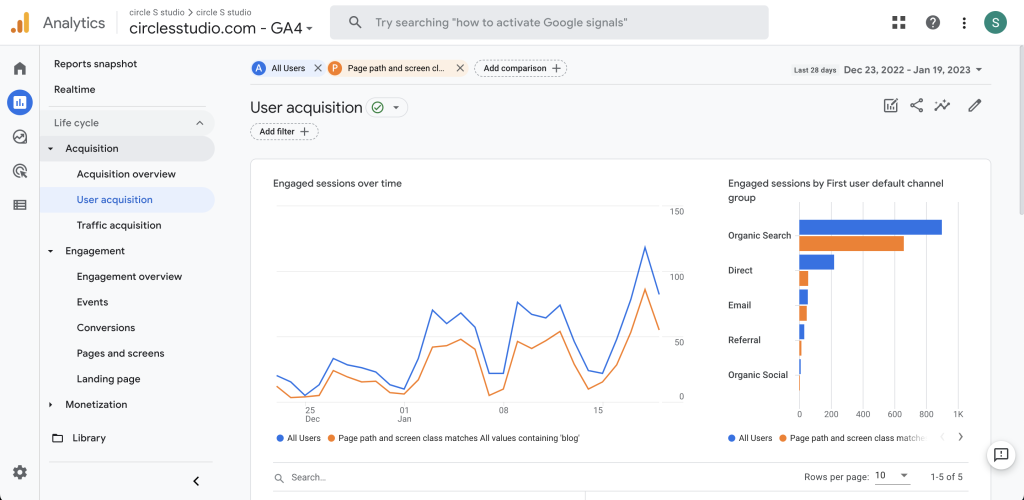
It’s important to know how your visitors are reaching your blog. In Google Analytics 4, the default acquisition channels are divided into several groupings including Google Ads traffic, Display Ads traffic, and Manual traffic.
Manual traffic is by far the most common — and the one most likely to show up on your reports, and is divided into subcategories including, but not limited to, Organic Search, Direct, Referral, Email and Social.
- Traffic from Organic Search measures users who come to your blog through a search engine, so oftentimes, organic traffic indicates SEO effectiveness. Break it down by individual pages, and those that have a high percentage of traffic from organic search are probably optimized well, while those that have a low percentage may need to be optimized for search.
- Direct traffic represents users that paste a link into their browser, click a bookmark, or otherwise visit your site through a link that Google Analytics can’t track. High direct traffic is hard to diagnose, as it could mean either lots of manual or unidentified traffic (due to browsers or devices blocking tracking, excessive bot activity, or any number of other miscellaneous sessions.
- Email traffic often consists of your blog subscribers, so it can help provide insight into popular blog posts among your subscriber base.
- Referral traffic is traffic which comes from any other site, such as if you’re cited with a link on another blog or forum. You can add a secondary dimension to see the individual blog pages to which the sources are directing, or view this by adding “Source” as a secondary dimension or viewing the Source / channel report dimension.
- Social traffic, of course, records users who visit your blog through a link on social media. This is likely a mix of returning and new visitors, as they could be accessing your blog because they follow you or because a friend shared your post. You can see which platforms are driving the most traffic, and to which blog posts. You can also glean some insights by logging into the social platforms directly and viewing their internal analytics. For example, open up your Facebook page Insights to see the reach and engagement of your posts. If you shared a link to one of your blog articles in the post, it shows the amount of link clicks (not post clicks!) from the post.
5
New vs. returning visitors
The hope is that your content delivers enough value that users want to come back to your blog to view other articles. In GA4, you can browse your new and returning user metrics under the acquisition tab by looking for the “Users” and “New users” dimensions. For your blog to grow, you need an increasing number of people returning and subscribing to your blog, as well as new people finding your blog. Reviewing your user metrics against dimensions such as the default channel group could help you understand the source of your new traffic and your effectiveness of attracting audience members across various platforms.
Demonstrate the value of your efforts
As you start to gather data, compare it from month to month, and identify trends, you’ll be able to draw conclusions on what performs best and better inform your strategy. And, as you chart the KPIs and see areas of growth or success over time, it’s helpful information you can present to your executives to demonstrate the importance of and ROI that comes from your thought leadership efforts.
By signing up you are agreeing to our Privacy Policy.