Facebook Ads statistics play a key role in optimizing your ad campaigns and staying ahead of the competition in the advertising landscape.
So it’s no wonder Facebook has remained relevant, globally dominating the online advertising space. It has the most advanced and customizable filtering options available.
To help you make the most of this advertising potential, this article features 50 impactful Facebook ads statistics that’ll help you optimize your campaigns and achieve impressive engagement results.
Single Grain enables us to increase our impact without increasing our headcount
General Facebook Statistics You Should Know
Nearly three billion (2.98M) monthly active users worldwide would agree — Facebook marketing is a goldmine of opportunities to reach customers and achieve advertising success.
Effective Facebook advertising can be a game-changer for businesses, but understanding the success rate is essential for optimizing campaigns. Here are some key statistics about the success of Facebook ads:
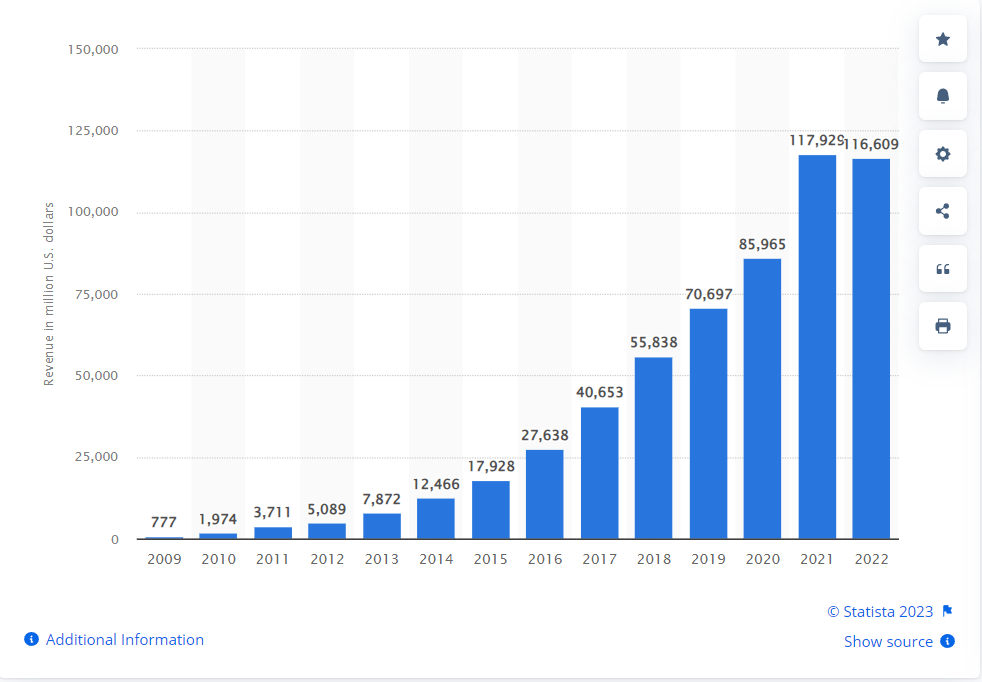
- Facebook’s primary source of income is digital advertising: With its massive global user base, Facebook remains the most popular social media advertising platform. In 2022, advertising revenue for Meta amounted to about $113 billion USD, while other revenue sources, such as payments and fees accounted for only around $2 billion USD. (Source)
- Advertising trends: Facebook is the most commonly used social media platform among marketers worldwide, with 89% using it to promote their business in January 2022. Instagram, also owned by Meta, was used by 80% of marketers. This highlights the continued significance of Facebook as a key advertising platform. (Source)
- Click-to-Messaging format usage: An impressive 40% of Facebook advertisers use the Click-to-Messaging format. This format has gained significant attention as Facebook focuses on its growth, especially in response to iOS changes that have made retargeting users who click through to a brand’s website more challenging. (Source)
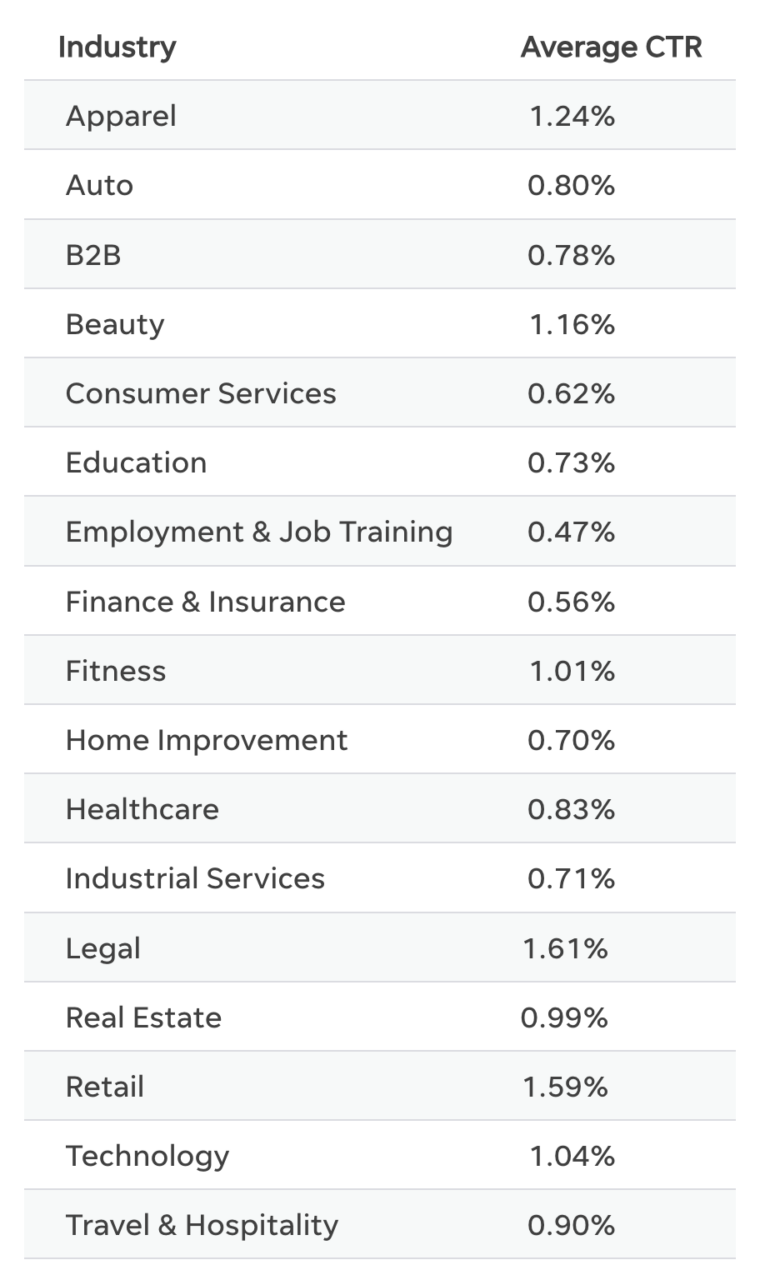
- Facebook ads performance: Facebook ads get an average CTR of 0.90% across all industries. That said, click-throughs vary for industries, with retail, legal, apparel, beauty, and fitness sectors seeing a CTR of at least 1%. (Source)
- Decrease in average Facebook ad prices: The average price per ad on Facebook experienced an 18% decrease in Q3 2022. This decline can be attributed to data challenges related to iOS updates and third-party cookies. While precise targeting may be impacted, advertisers can still reach specific audiences interested in their brand at lower rates, presenting ample opportunities for effective advertising. (Source)
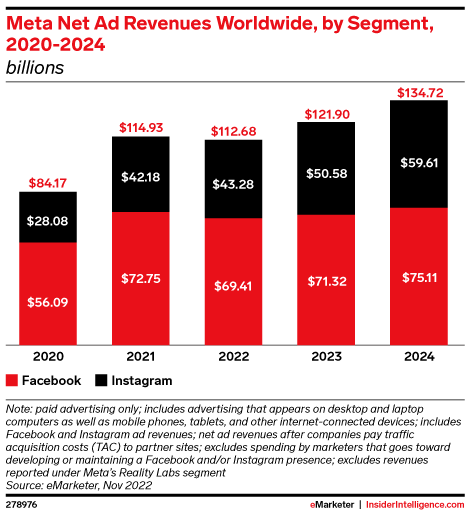
- Meta’s ad revenue distribution between Facebook and Instagram: In 2023, it is forecasted that 58.5% of Meta’s $121.90 billion of ad revenues worldwide will come from Facebook, while the remaining 41.5% will come from Instagram. Instagram’s ad revenues are growing faster than Facebook’s, leading to a decline in Facebook’s ad revenues in 2022. Instagram is expected to continue outpacing Facebook in terms of revenue growth. (Source)
- Age distribution of Facebook’s ad audience: While the general consensus is that Facebook has been taken over by Baby Boomers, in reality, only 12.5% of the platform’s ad audience is over the age of 55. This means the user base is pretty diverse, and encompasses a wide range of age groups, presenting advertisers with many options. We’re talking about various demographics and the ability to reach audiences beyond older generations. (Source)

- Facebook’s ad revenue growth by region: Facebook’s ad revenue in the Asia-Pacific region experienced a notable 6% growth from Q3 2021 to Q3 2022. This growth is particularly significant considering the overall decline in ad revenue during 2022. Meanwhile, Facebook’s ad revenue decreased by 4% in North America and a shocking 12% in Europe during the same period. These regional variations highlight the dynamic nature of Facebook’s advertising landscape. (Source)
- Facebook’s potential advertising reach: With a massive user base, Facebook has a staggering potential advertising reach of 2.08 billion people. As the most populous social platform, it offers the highest potential reach for marketers. This emphasizes its importance as a key advertising platform for businesses aiming for significant growth. (Source)
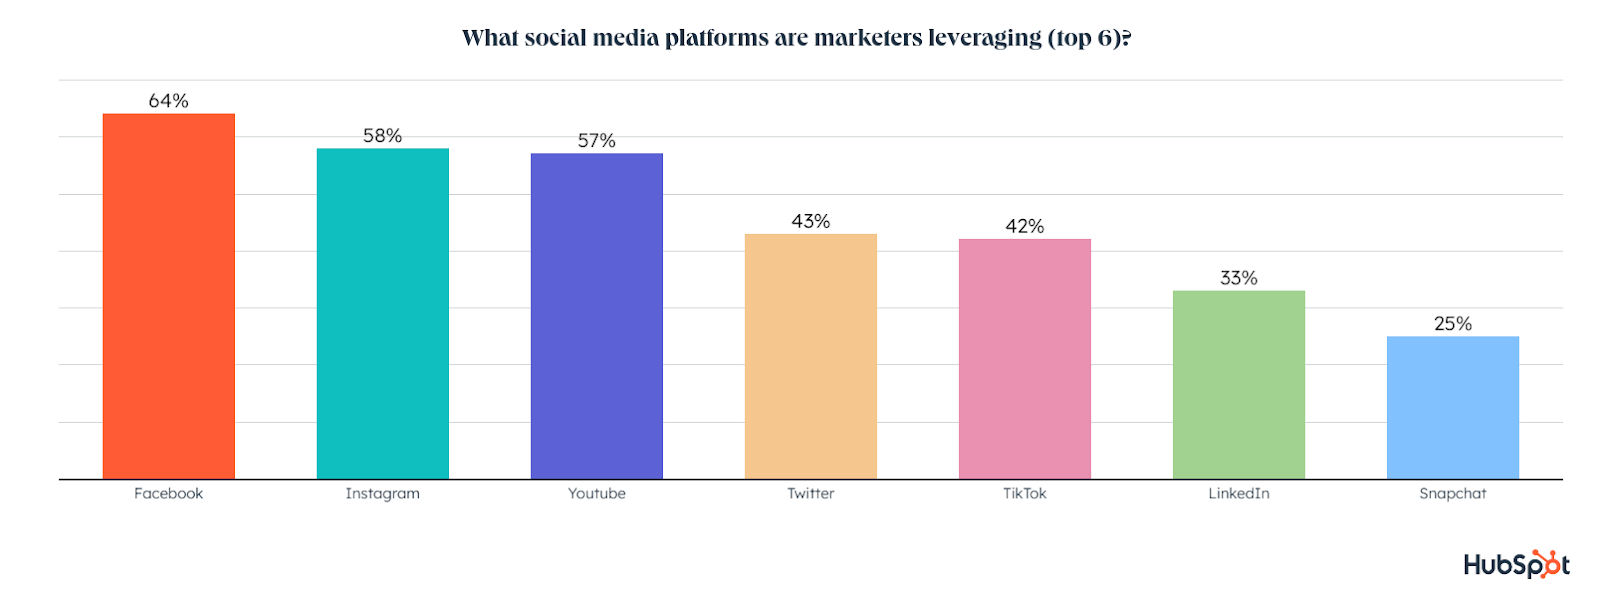
- Facebook is the most used social media platform among marketers: Marketers leverage an average of four social media platforms in their roles. Facebook stands out as the most used platform, with 64% of marketers using it. It is followed by Instagram (58%), YouTube (57%), Twitter (43%), TikTok (42%), and LinkedIn (33%). This showcases the prominence of the platform in the marketing landscape and its widespread adoption by professionals. (Source)
- Facebook’s leading ROI and investment: Facebook not only dominates as the most used social media platform among marketers but also offers the highest return on investment (ROI). It is the channel where marketers plan to invest the most in 2023. Although nearly 25% of marketers are planning to invest in Facebook for the first time in 2023, the growth rate on other platforms like YouTube, Instagram, TikTok, and Twitter is projected to be higher next year. (Source)
- Gender distribution of Facebook’s ad audience: Facebook’s ad audience consists of approximately 56.6% male users, with the remaining 43.4% female users. This gender distribution highlights a significant difference of nearly 13 percentage points, emphasizing the importance of considering gender demographics when targeting ads on the platform. (Source)
- Facebook Reels ad impressions: In 2022, the platform saw 3.3% of ad impressions from Facebook Reels. While this percentage may seem relatively small, it’s important to note that Reels ads have half the potential audience compared to Stories ads. Advertisers who develop a strong Reels advertising strategy can gain an advantage by leveraging this ad placement, which is still a relatively new and novel opportunity. (Source)
- Facebook as a starting point for online shopping: A significant 19% of U.S. consumers begin their online shopping search on Facebook, making it the top social network used for this purpose. However, it’s important to note that the overall top sources for online shopping searches are led by Amazon, followed by search engines, Walmart.com and YouTube. (Source)
- Facebook’s potential advertising reach by country: Facebook’s advertising reach extends to a significant portion of the population in various countries. It reaches 62.6% of all Americans aged 13 and above. Furthermore, Facebook reports the potential local advertising audiences as a percentage of the total population over the age of 13 in several countries: (Source)
-
- Mexico: 87.0%
- United Kingdom: 60.7%
- France: 56.1%
- Italy: 53.2%
- India: 29.5%
These statistics highlight the broad reach of Facebook’s advertising platform in different markets, allowing businesses to target specific geographic audiences effectively.
Facebook User Statistics You Should Know
Understanding Facebook’s user base is crucial for advertisers looking to maximize their advertising success on the platform. With its massive global reach and diverse user demographics, it offers a wealth of opportunities to connect with potential customers.
In this section, we will delve into user statistics that shed light on the size, demographics, and engagement levels of this user base. The statistics will provide valuable insights to help you make informed decisions and optimize your advertising strategies on Facebook.
General Facebook Statistics
- U.S. adult usage: In the United States, 69% of adults report using Facebook, indicating its widespread popularity and usage. YouTube is the only social media platform with a higher usage rate among U.S. adults, with 81%. Instagram follows closely in third place, with 40% of U.S. adults reporting its usage. (Source)
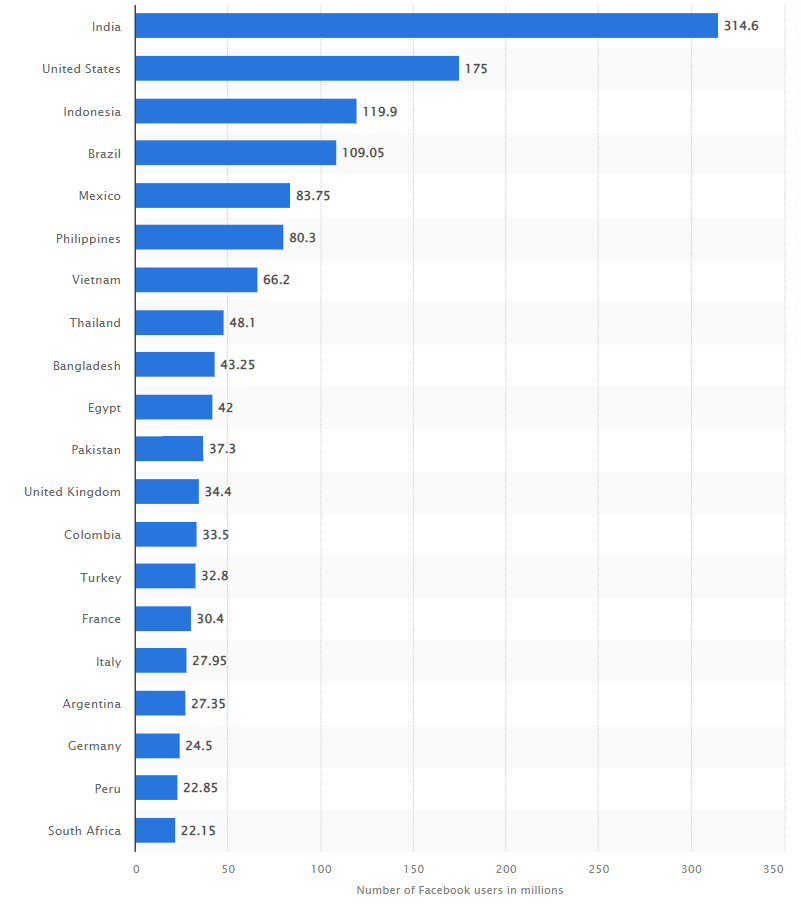
- Country with the most Facebook users: India has the largest Facebook audience size, with nearly 315 million users. In fact, India’s Facebook audience is so significant that if it were a country, it would be ranked third in terms of the largest population worldwide. Other countries with notable Facebook user bases include the United States, with 175 million users, Indonesia, with 119 million users, and Brazil, with 109 million users. (Source)
- Facebook app: The majority of Facebook users access the platform through mobile devices. As of July 2021, it was found that 98.5% of active users accessed their Facebook accounts from mobile devices, and approximately 81.8% of Facebook audiences worldwide accessed the platform exclusively via mobile phones. (Source)
- Meta platform users: At least 70% of Internet users use Meta platforms. Facebook, Instagram, Messenger, and WhatsApp are used by 3.71 billion of the 5.3 billion global Internet users every month. Many users engage with multiple platforms. (Source)
Facebook Usage Statistics
- Facebook usage in the UK: Approximately 66% of the entire UK population, which amounts to around 44.84 million people, are active Facebook users. This significant user base demonstrates the platform’s widespread adoption and popularity within the country. (Source)
- Facebook usage in AU: In 2022, Facebook is the most popular social media platform in Australia, with 27.2% of Australians aged 16-64 choosing it as their favorite. Australian Facebook users spend an average of 17.6 hours per month on the platform. (Source)
- Real-time activity: Facebook experiences incredible activity in real-time, with hundreds of users signing up every minute. It is estimated that approximately 400 users sign up for the platform every minute. In that same minute, more than 510,000 comments are made, 293,000 status updates shared, 136,000 photos uploaded, and a staggering 4 million posts liked. As the site grows and expands, these numbers are expected to increase even further. (Source)
- Average Facebook user: Over 72% of Facebook users also use YouTube, WhatsApp, and Instagram. Specifically, 72.6% frequent YouTube, 72.3% use WhatsApp, and 77.4% use Instagram. Also, there are overlaps with other popular social networks, including 50.2% on TikTok, 49.9% on Twitter, and 33.7% on Pinterest. (Source)
- Facebook demographics: Facebook is the favorite social platform among the 35-44 age demographic. It is also the top choice for male internet users aged 25-34, although women in that age group prefer Instagram. Facebook currently limits its gender reporting to male and female categories. If your target market includes these demographics, it becomes an even more important platform for connecting with your audience. (Source)
- Gen Z user trends: While Facebook remains a popular platform, there are indications of shifting user patterns among Gen Z users. According to surveys, 7% of Gen Z users aged 18 to 25 plan to quit Facebook in 2023, and 25% plan to spend less time on the platform. While this percentage may not signify a mass exodus, it does highlight the importance for marketers to stay informed about evolving user behaviors and preferences. (Source)
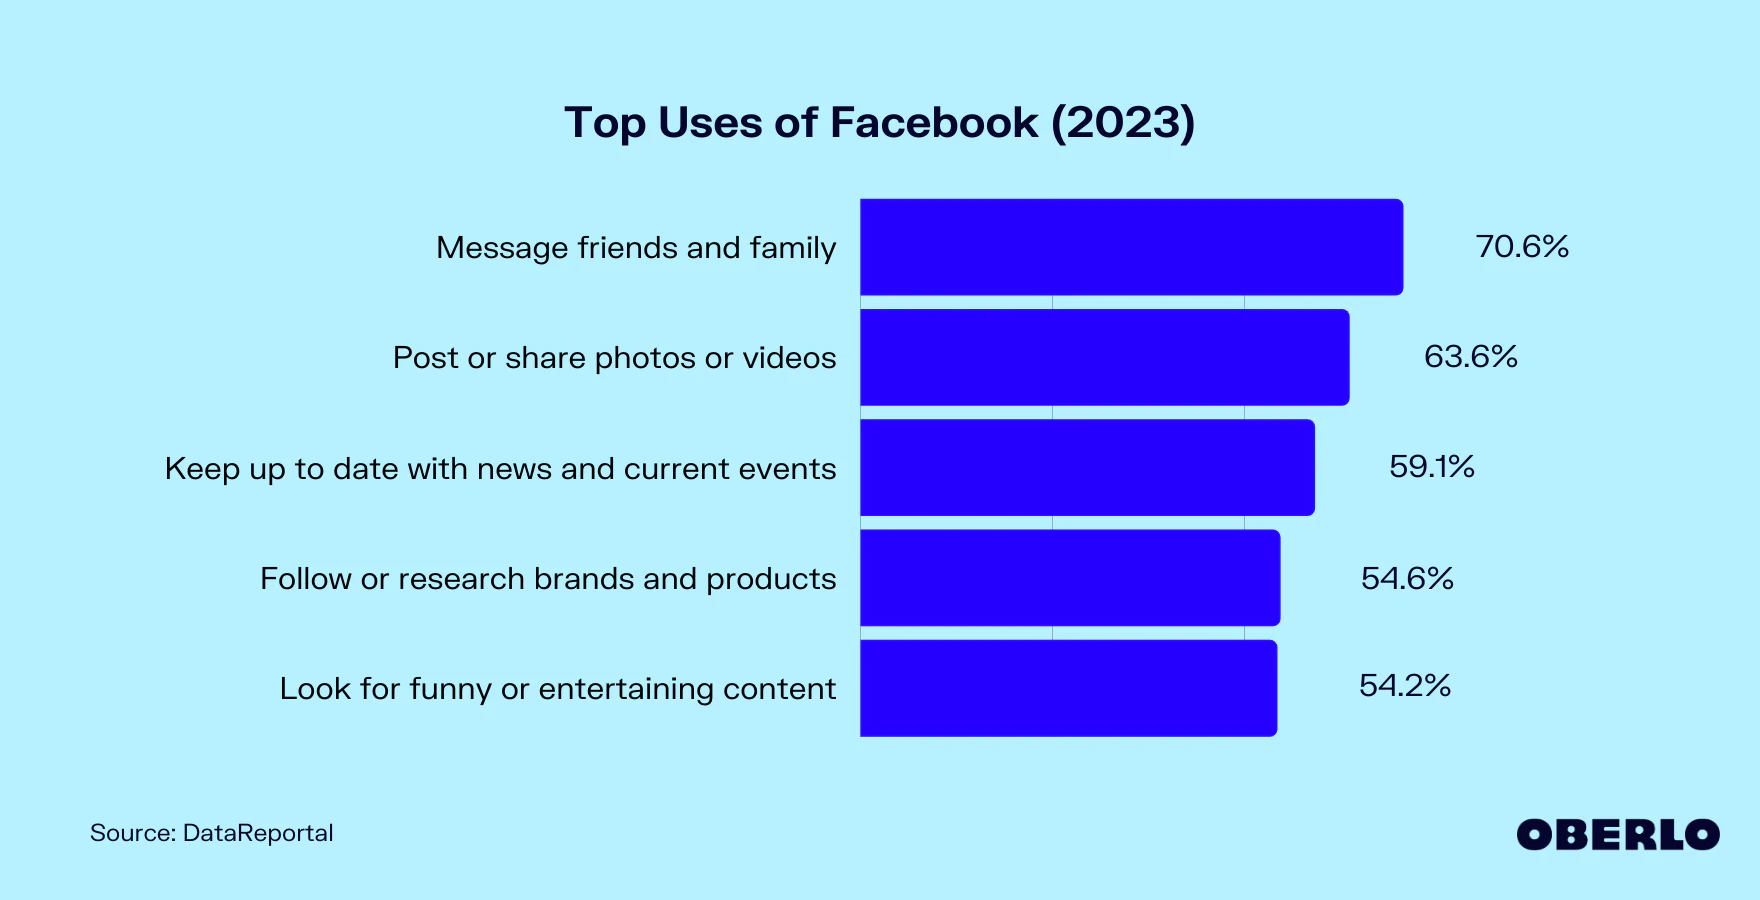
- User activities and engagement: Messaging friends and family remains the top activity on Facebook, with 70.6% of users using the platform for this purpose. This indicates that the social aspect of Facebook is still a significant draw for users. Other popular activities include posting and sharing photos and videos (63.6%) and staying updated with news and events (59.1%). (Source)
- Customer service usage: Facebook has emerged as the leading platform for customer service, as the use of social media for this purpose continues to rise. 60% of consumers use Facebook to seek customer service. Also, 69% of marketers provide customer service through the platform. (Source)

Facebook Engagement Statistics
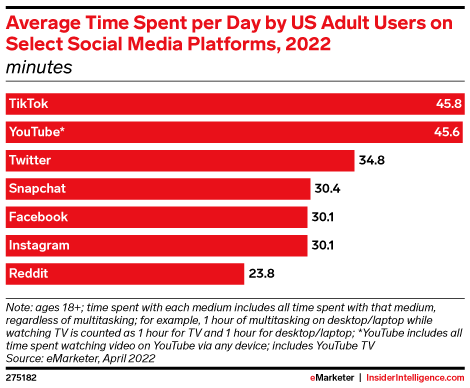
- Usage and daily engagement: Americans spend an average of 30.1 minutes per day on Facebook, indicating a significant level of daily engagement with the platform. However, regarding daily use time by American adults, Facebook ranks fifth. TikTok takes the lead in this category, with users spending nearly 46 minutes per day on the platform. (Source)
- Posting frequency and content: On average, a Facebook Page posts 1.68 times per day. The distribution of these posts is as follows: link posts (52.5%), photo posts (28.8%), video posts (17.1%), and status posts (1.8%). Link posts are the most common, indicating brands share external content, while photo and video posts are popular for visual engagement. Status posts make up a smaller portion and often convey short messages or announcements. (Source)
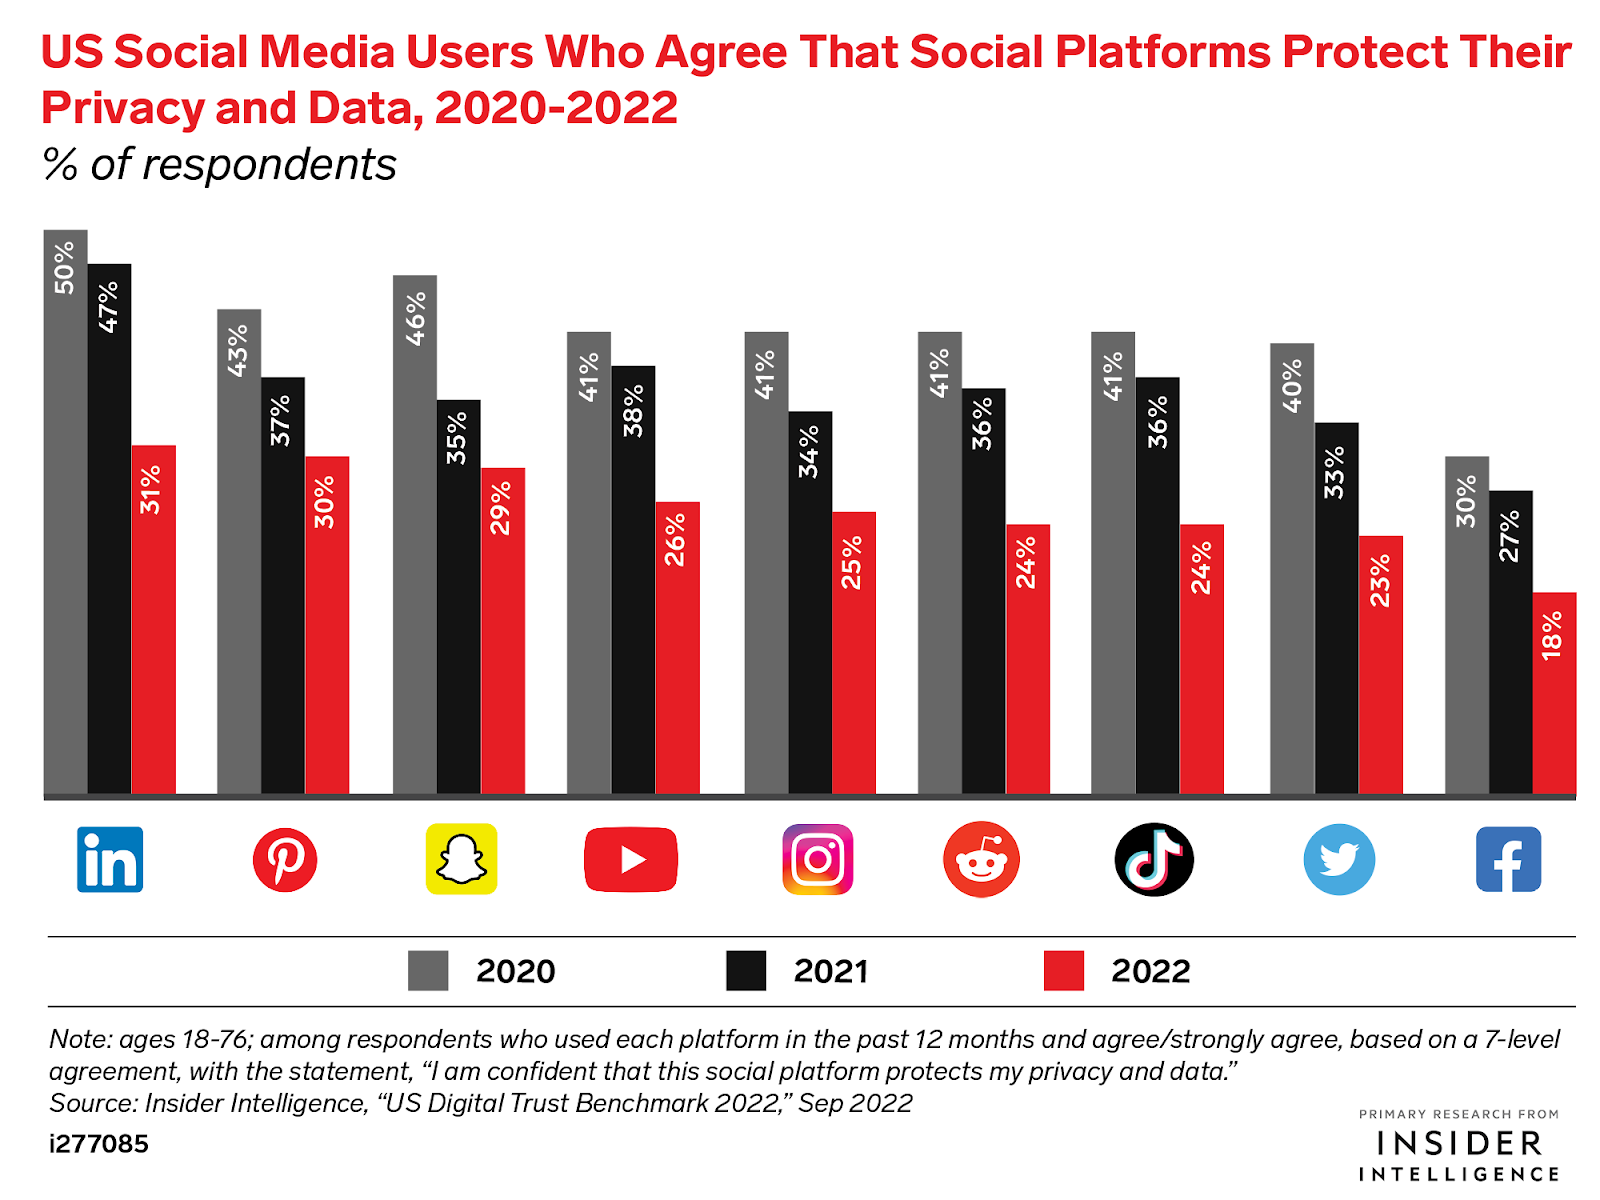
- Trust and privacy concerns: Despite its popularity, Facebook faces significant challenges regarding trust and privacy. Only 18% of American social media users feel that Facebook protects their data and privacy, indicating a decline in confidence over the past few years. This places Facebook at the bottom of the list, making it the least trusted social media platform when it comes to data protection and privacy. (Source)
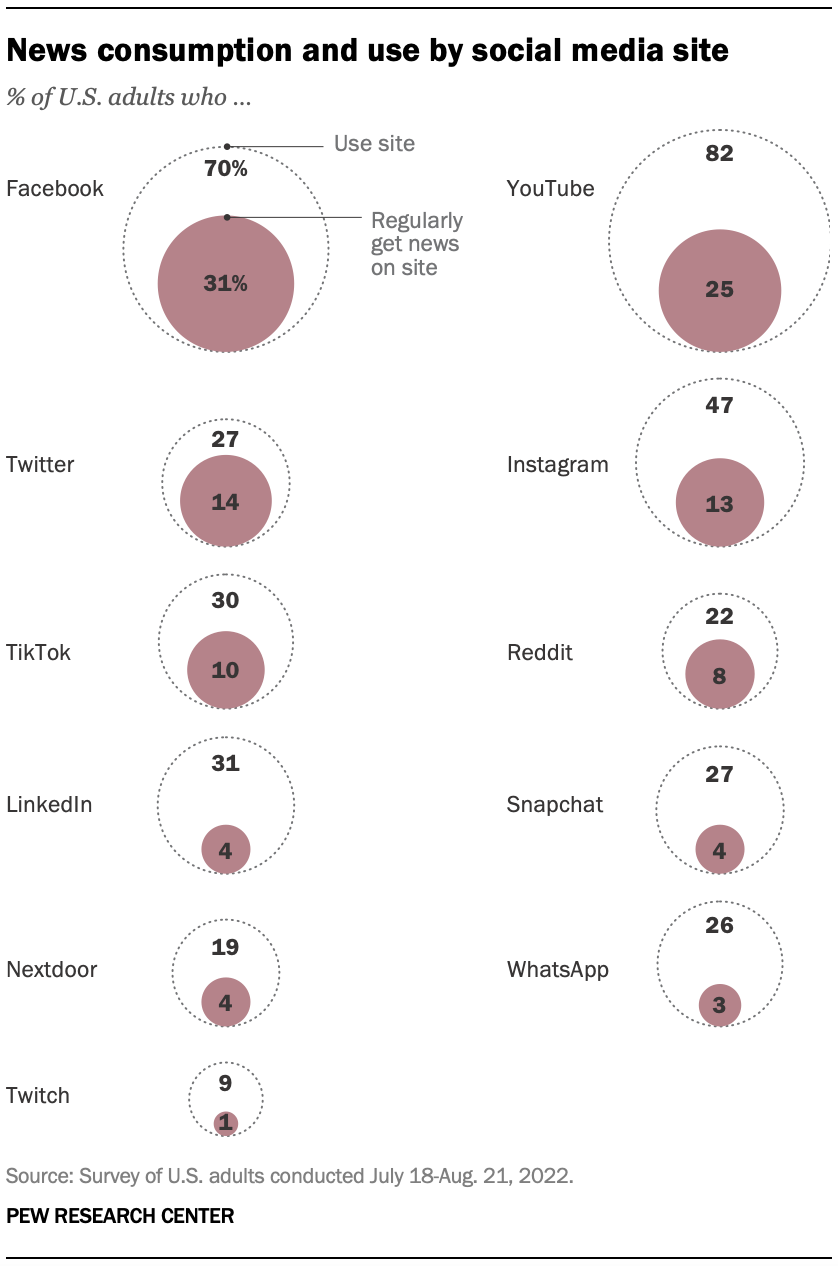
- News consumption: Facebook remains a significant platform for news consumption, with 31% of Americans regularly getting their news from the platform. Although this figure has declined from 36% in 2020, it still surpasses other social media platforms by a significant margin. YouTube comes in second, with 25% of Americans regularly seeking news on that platform. (Source)
- Brand research and engagement: A significant percentage of Facebook users, 54.6%, actively follow or research brands and products on the platform. Only Instagram surpasses Facebook in terms of brand research, with 62.3% of users engaging in this activity. (Source)
- Web traffic referral: Facebook accounts for 71.64% of all web traffic referral from social media. The vast majority of clicks through to websites are coming from Facebook, with Twitter coming in second place at only 9.02%. (Source)
How Do I See My Facebook Ad Statistics?
With Facebook Ads, you can target a specific demographic of Facebook users. It’s easy to run ads for a particular period with a specific budget. The Facebook Ad Manager lets you track your ad’s success and view statistics (such as impressions, clicks, and click-through rates).
Here’s how to find your Facebook Ads stats:
- Go to Facebook and log in.
- On your home page, click “Ads.”
- From your campaign list, click the Ad Campaign name.
- Go to the “Reports” tab on the left.
- Choose “Advertising Performance” under “Report Type.” Select “Ad” in both “Summarize By” and “Filter By” fields. Check the box next to the ad you want. Select the dates you want to see ad statistics related to in the “Date Range” field.
- Click “Generate Report.” Facebook will show you ad statistics, including impressions, clicks, click-through rate, and the amount you spent.
Related Content: 22 Strategic Benefits of Facebook Ads and Their Applications
Why Do 90% of Facebook Ads Fail?
Facebook advertising can be a powerful tool for businesses, but it’s essential to understand why some ads fail to achieve the desired results. Here are several common reasons why 90% of Facebook ads may not deliver the expected outcomes:
- Poor Targeting: One of the main reasons marketers fail with Facebook Ads is inadequate targeting. Many advertisers overlook the ability to create custom audiences, resulting in their ads being shown to an irrelevant or uninterested audience.
- Lack of Audience Data: Using only basic demographic data for custom audiences can limit the effectiveness of Facebook ads. Building comprehensive buyer personas or customer profiles can provide better insights into your target audience’s interests, behaviors, and preferences.
- Incorrect Bidding Strategy: Facebook Ads may not generate enough impressions or clicks if marketers don’t choose the right bidding option or bid an appropriate amount. Adjusting the bidding strategy can help optimize ad performance and reach.
- Ineffective Ad Creatives: If all the previous issues have been addressed, but ads still underperform, it’s essential to examine the ad creatives. Ads with low click-through rates (CTR) often indicate poor performance. Creating visually appealing and engaging ads that catch the attention of the custom audience is crucial for success on Facebook.
- Pitching Cold Audiences: While custom audiences are commonly used for remarketing campaigns, they may not be as effective due to the default 30-day cookie window. Exploring other targeting options, such as lookalike audiences or interest-based targeting, can help reach new audiences.
- Lack of Experimentation: Successful Facebook ad campaigns often require experimentation and testing. Even experienced advertisers may need to iterate and refine their ads to find the most effective combination of targeting, creatives, and messaging.
- Misalignment Between Landing Pages and Ads: If all previous issues have been addressed and ads still fail to convert, the landing page may be the culprit. The landing page should align with the ad’s intent and fulfill the user’s expectations. Inconsistent messaging or a poor user experience on the landing page can lead to high bounce rates and low conversions.
By addressing these common pitfalls, marketers can improve the effectiveness of their Facebook ad campaigns and increase the chances of achieving their desired outcomes. Monitoring performance, conducting regular testing, and optimizing campaigns based on data-driven insights is crucial.
Last Word on Facebook Ads Statistics
Facebook Ads statistics play an essential role in optimizing your ad campaigns and staying ahead of the competition in the ever-changing digital advertising landscape.
By tracking and analyzing key metrics, you can refine your Facebook Ads strategy to maximize conversions and drive revenue. Patience is essential in this process, as creating compelling ads, targeting the right audience, and continuously optimizing your campaigns will gradually lead to increased sales and business growth.
More statistics posts:
* 75+ CRO Statistics That’ll Help You Increase Sales in 2023
* 30 Social Media Advertising Statistics to Improve Your Strategy
* Top 100 Advertising Revenue Statistics to Inform Your Campaign
* 100 SEO Statistics That’ll Help You Dominate Search Rankings in 2023
* 187 Online Advertising Statistics: Privacy, In-App, PPC, Social and More
* 100+ LinkedIn Advertising Statistics to Improve Your B2B Marketing Campaign