SEO reporting mixes insights, actions, data, strategy, and communication all into one document. It sounds like a lot to take in—but once you know the basics, you’ll be able to report on SEO in your sleep.
In this beginner’s article, I’ll cover the basics of reporting for SEO and show you what to include in your SEO reports.
So what makes a good SEO report?
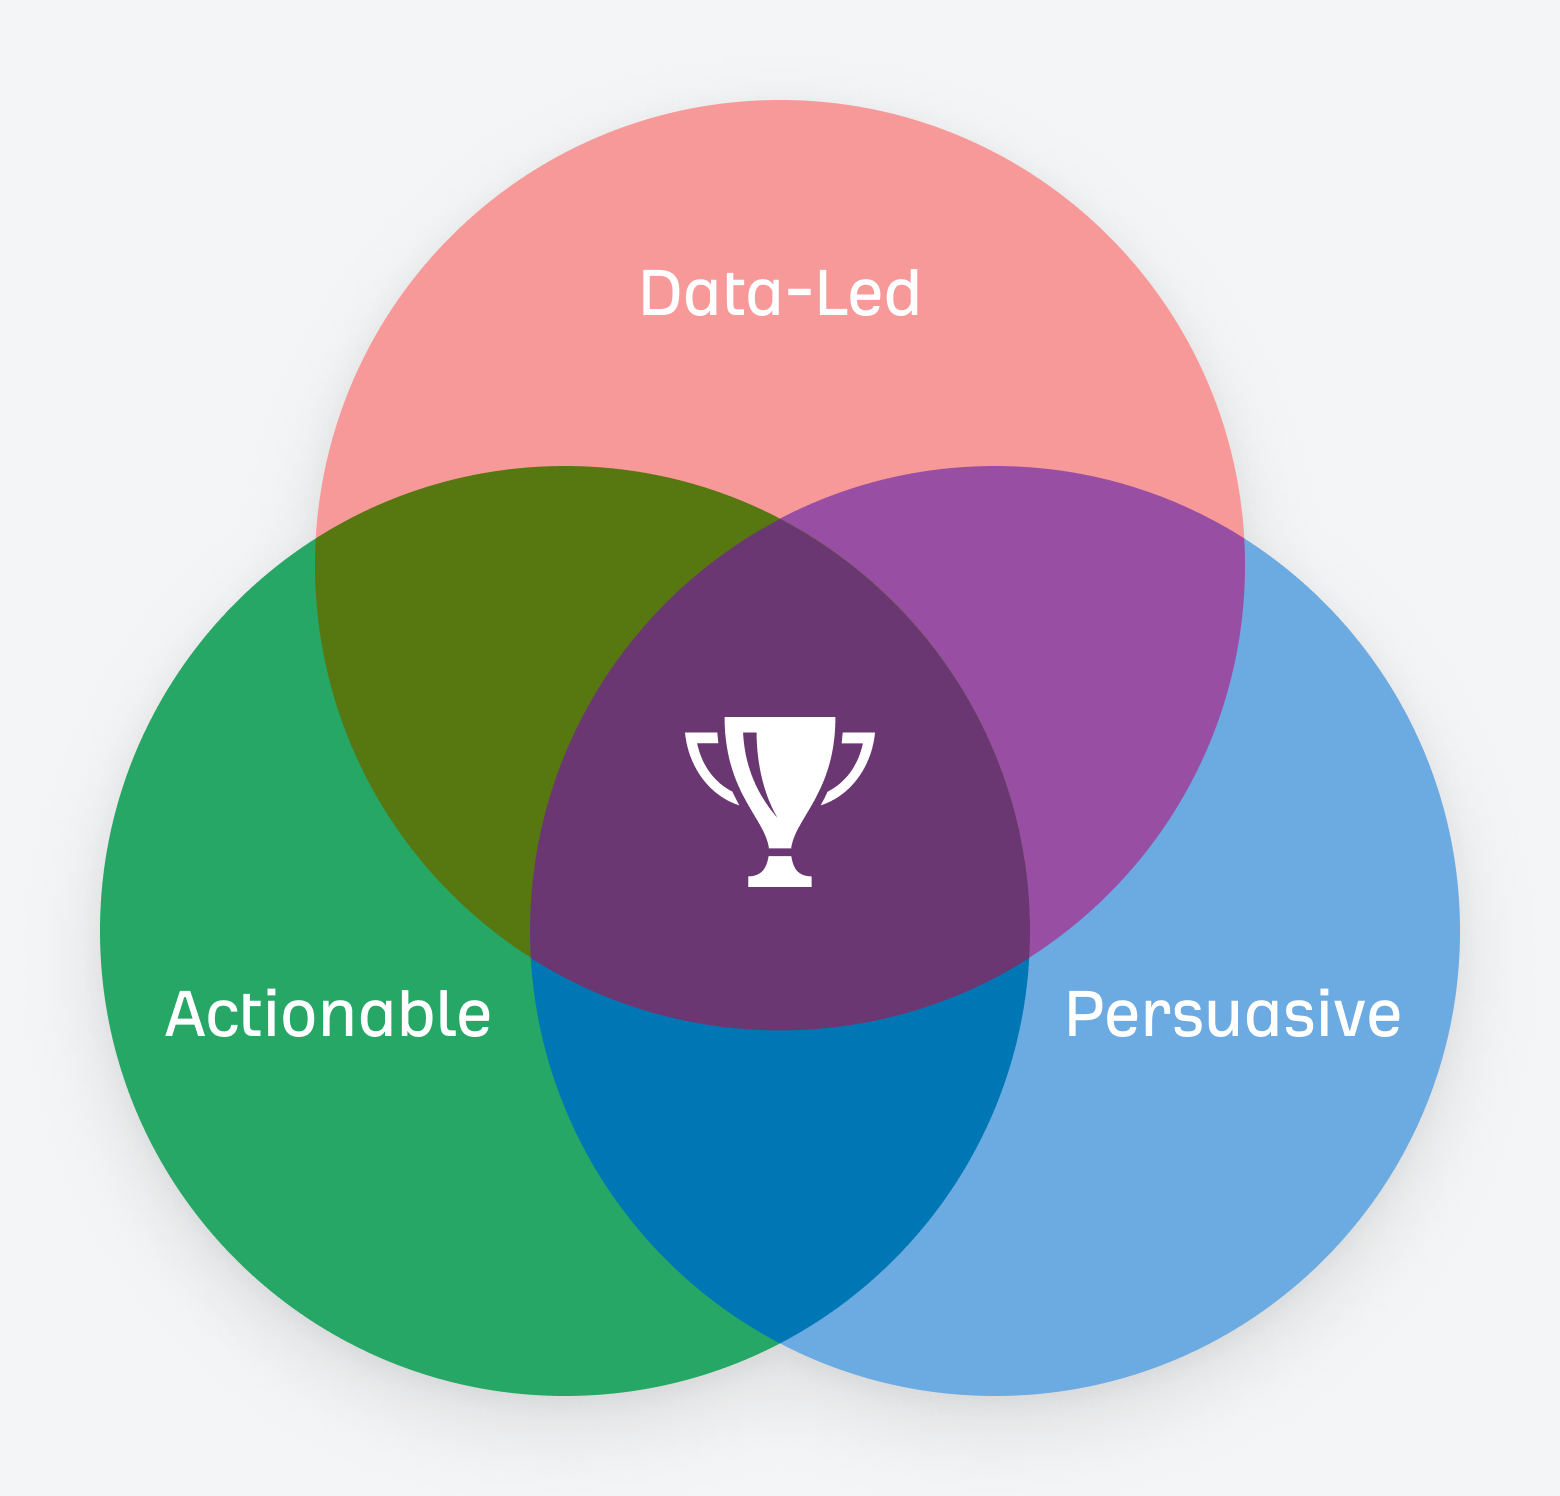
In the past ten years, I’ve created and read many reports, and I’ve noticed one thing: the best SEO reports are data-led, actionable, and persuasive.
1. Data-led
Good SEO reports are grounded in high-quality data. You need to get as close to the “truth” as possible. The good news is that you can get all the information you need from three free tools.
- Google Search Console (also referred to as GSC, GWT, or Webmaster Tools)
- Ahrefs’ Webmaster Tools (also referred to as AWT)
- Google Analytics (also referred to as GA)
2. Actionable
Reports need to lead to useful actions. Put yourself in the shoes of your stakeholders—they’ll expect you to provide an action for every insight you discover.
Here are a few common examples:
| Observation | The question you should ask |
|---|---|
| Organic traffic is down | How can we recover lost traffic? |
| Lost the number-one ranking for an important keyword | How can we get our number-one ranking back? |
| There’s a technical issue that’s impacted performance this month | What can we do to fix it? |
| Our content is not performing that well this month | Can it be improved? Does it need a rewrite? |
3. Persuasive
If you want to engage your boss or client in SEO, you must be persuasive in your SEO reporting.
Aristotle probably isn’t the first person you think can help you with SEO reporting, but an Aristotelian triangle is a good reminder of what to consider if you want to make your reports more persuasive.
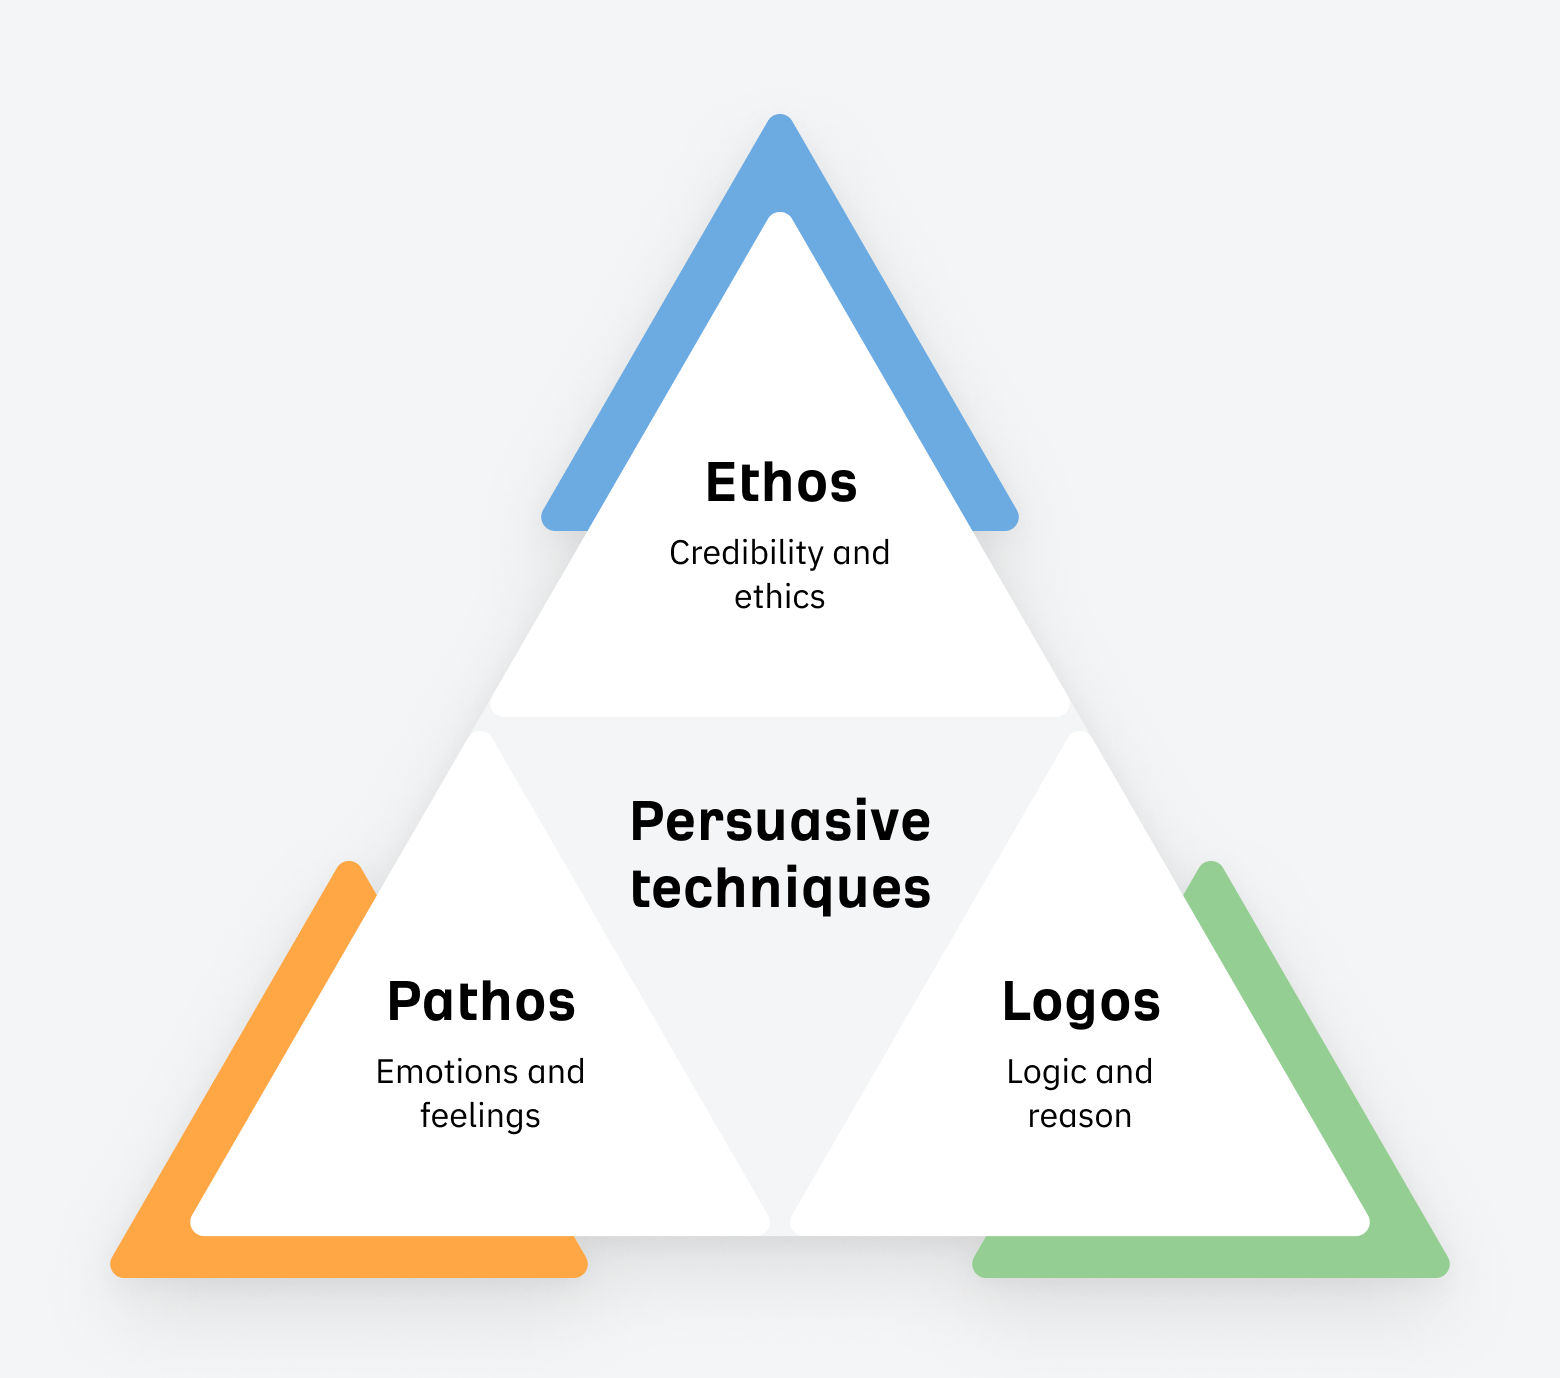
- Pathos: use logical reasoning, facts, and data to present water-tight arguments. Use SEO tools to back up your reasoning.
- Ethos: establish your credibility and ethics through results. If you work with other clients in a similar industry, you can use this to help establish your credibility. If you want to make changes on the website, share quotes from Google’s Search Essentials to show that what you are suggesting is part of SEO best practices
- Logos: make your reports tell a story. If competitors have strong performance, use it to trigger your client into action
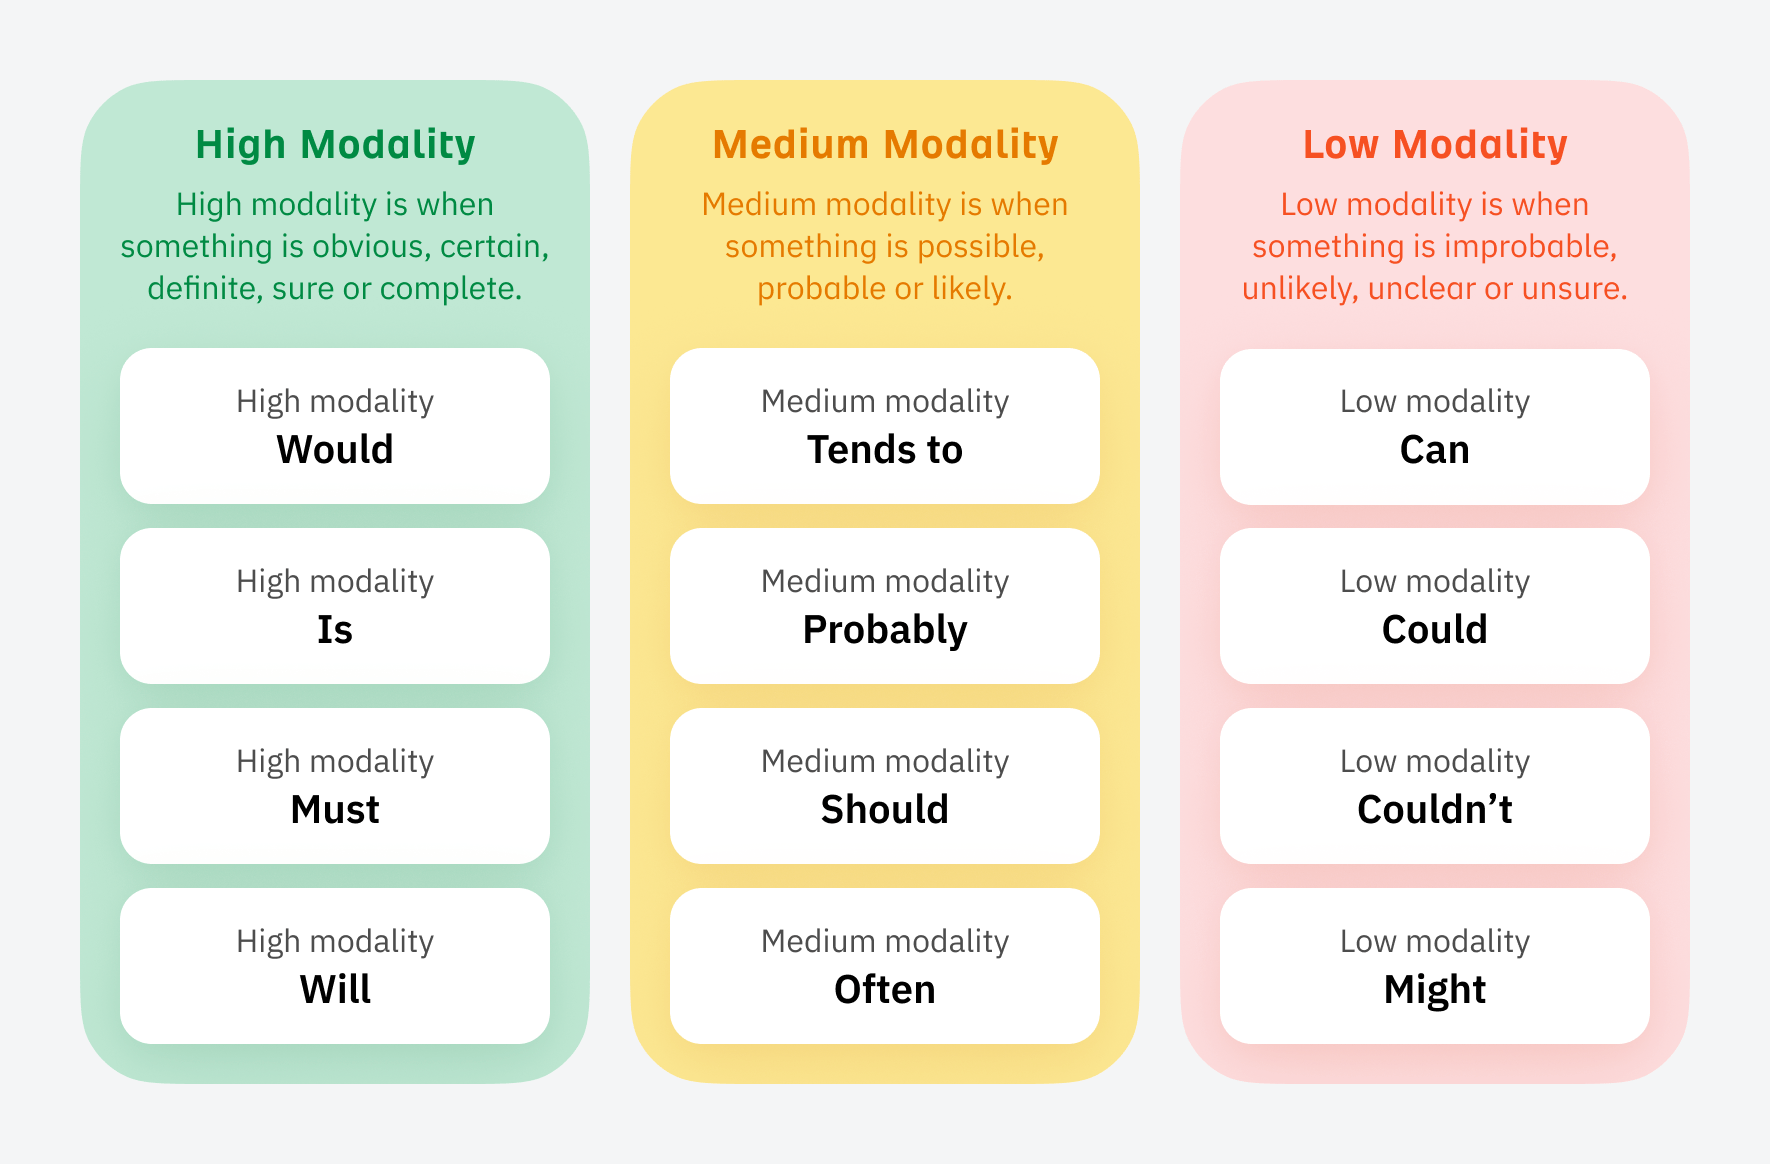
Lastly, use high modality language. It sounds complicated, but when you write your report, remember to use higher modality words like “would” and “will” instead of lower modality words like “could” and “might” when you think something is certain or likely.
For example:
If you’ve been asked to create a regular SEO report, it’s hard to know what to include if you haven’t made one before.
SEO reports can be presented in different formats: spreadsheets, dashboards, and Word documents, but usually, the most popular format is slides. Choose whatever format you think best suits your client or boss.
To start your report, break it down into sections and determine which parts are the most relevant to the website you’re reporting on.
Here are the most important things you should include in your report:
This is the first section I would have in my report, but it’s also the last one I write (it’s hard to summarize the key points of an entire report if you haven’t yet created it).
Executive summaries are designed for senior stakeholders who don’t have time to flick through a long report. They want to know the most important points. So you need to keep this section easy to understand.
In bullet points, an executive summary summarizes the key points from the entire report.
Organic traffic and analytics data give a bird’s eye view of a website’s performance over time. This data is often visualized in a graph near the start of many SEO reports.
Most SEO reports visualize performance using GSC, GA, or Ahrefs’ Overview data. This data can be displayed as a screenshot or exported and turned into a chart.
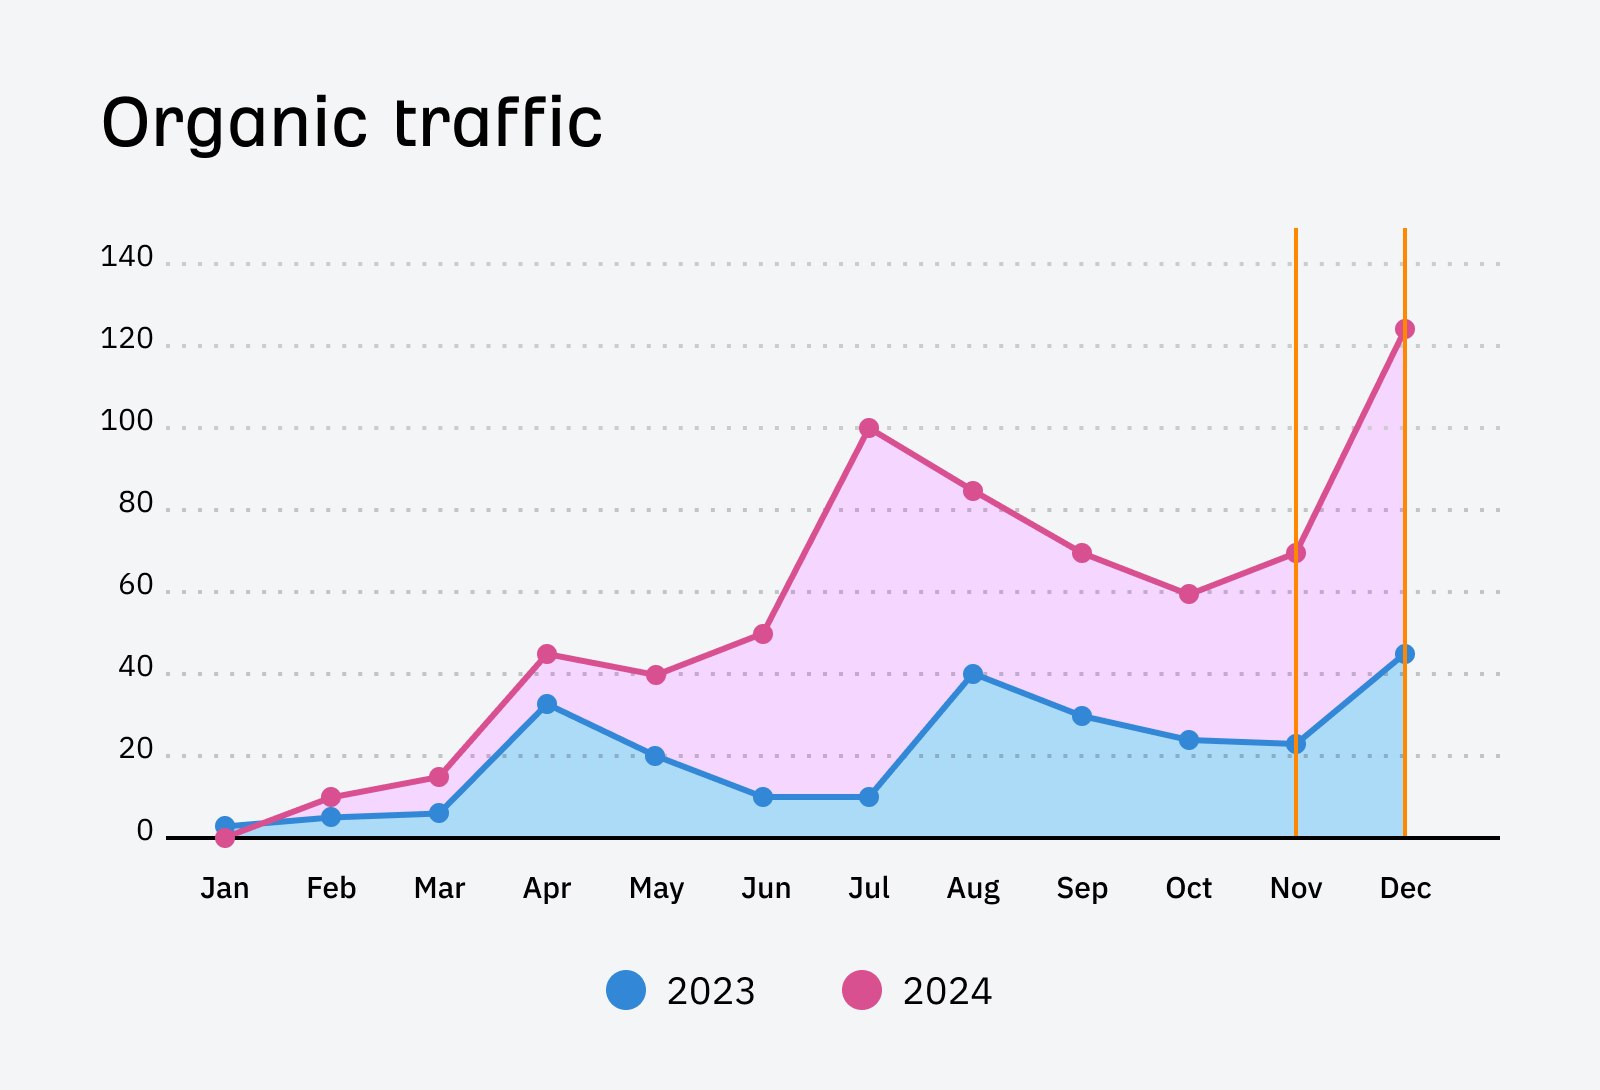
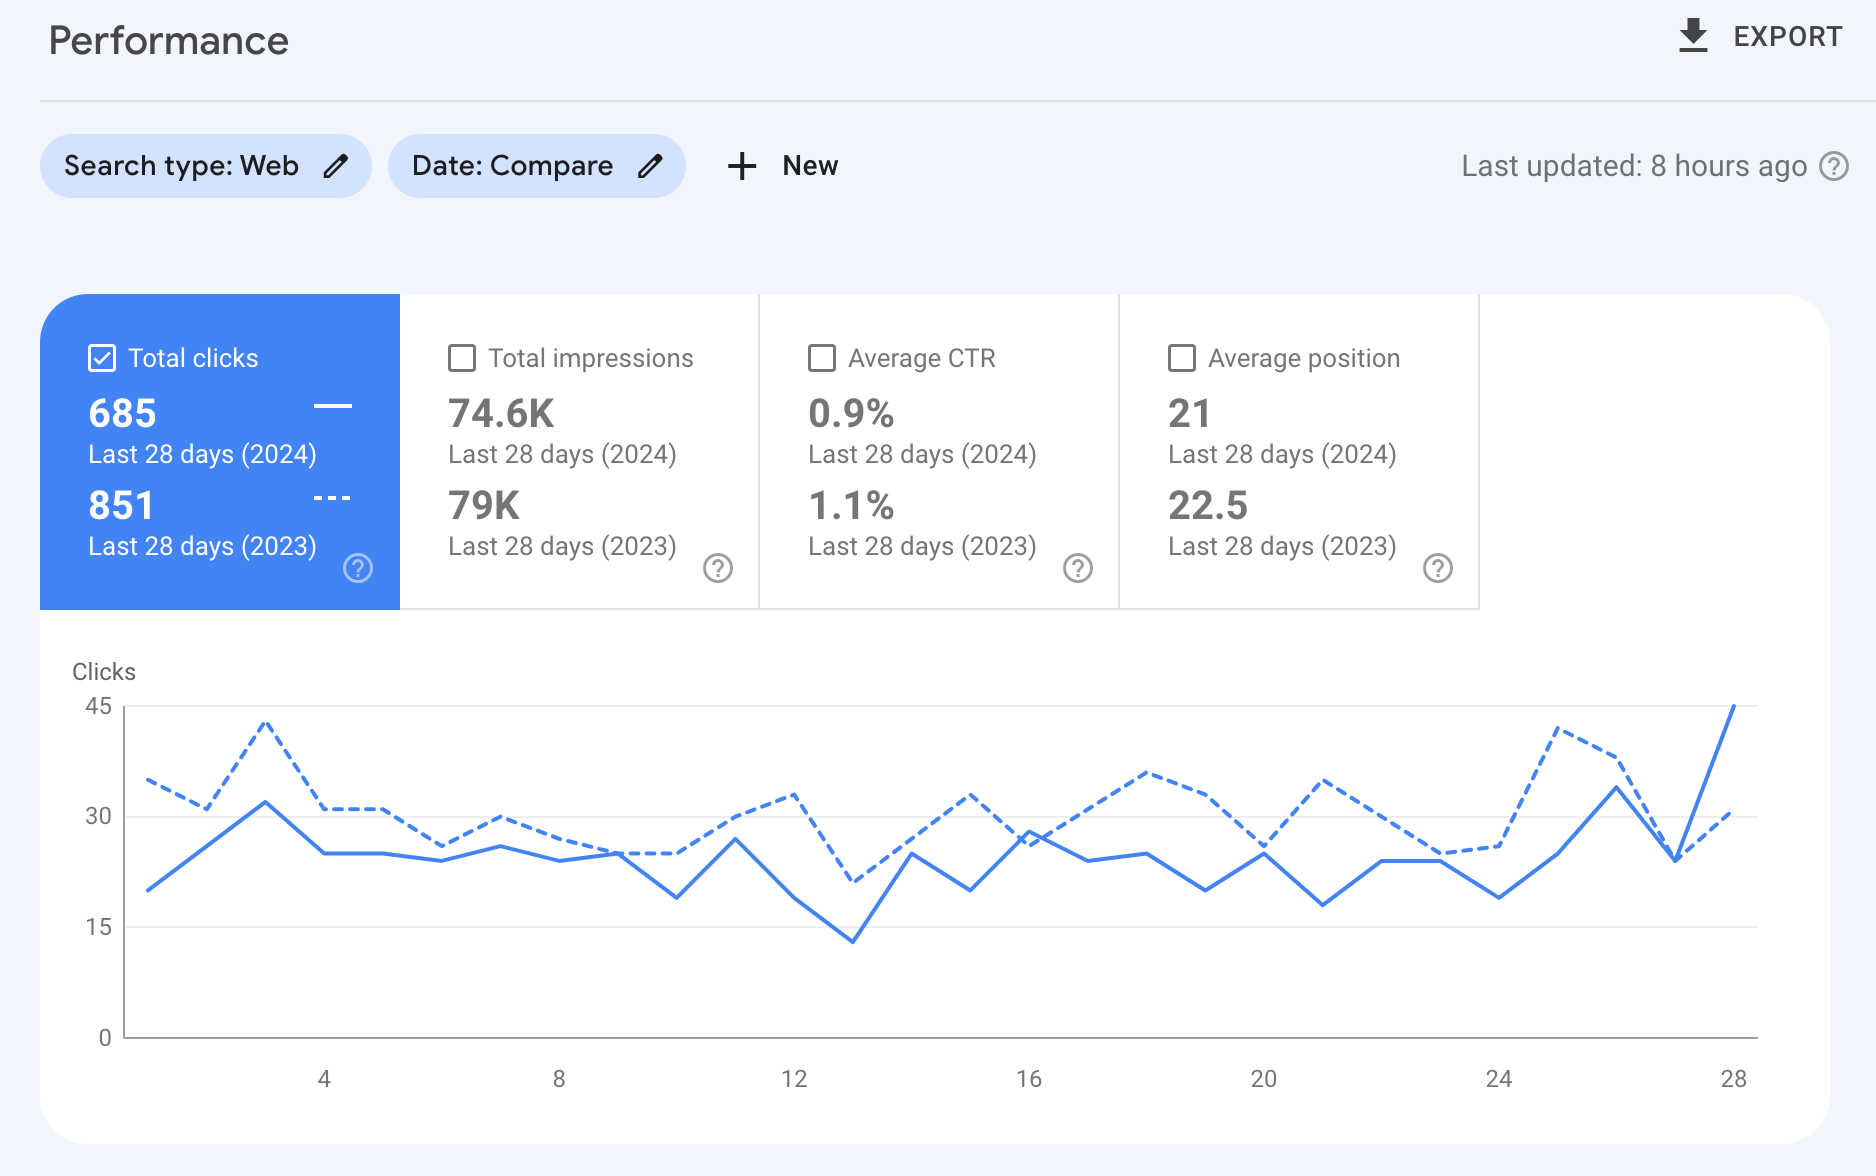
Here’s an example of comparing Google Search Console (GSC) clicks year over year (YoY). You can use GSC when reporting on a site you own or have access to the GSC profile.
And here’s another example of Site Explorer Overview showing YoY performance:
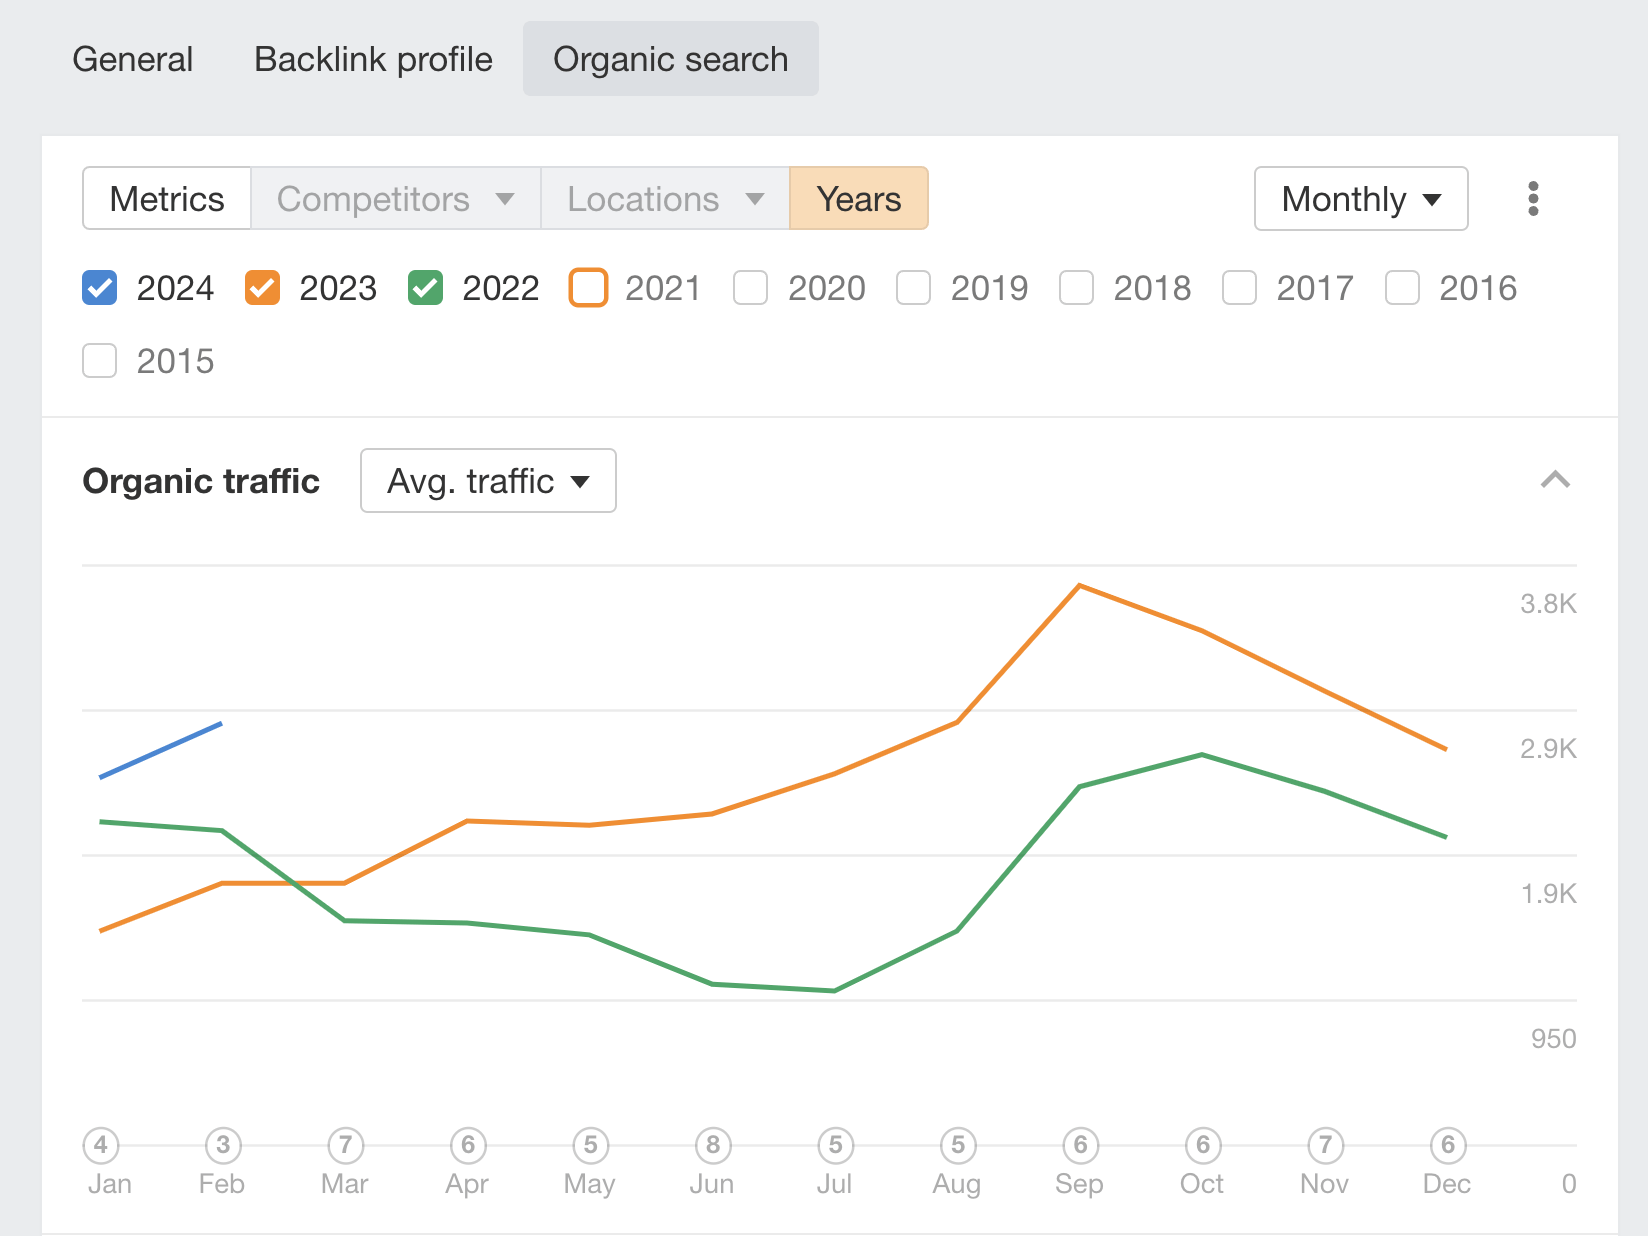
If you can’t get access to GSC or GA, then Ahrefs can show your website’s SEO performance over time. This is useful for tracking competitors’ Organic traffic performance.
You can access the report for free in AWT by clicking on your project in the Dashboard, scrolling down to Performance, and toggling the Years button.
The key point you want to communicate at this stage is the website’s total performance over time. Is the movement positive, negative, or somewhere in between? And, crucially, what does this mean for the website?
Next to the chart, provide a few lines of commentary on the performance.
For example:
- Organic traffic is up 5.5% MoM but down 3% YoY
- Organic traffic was higher than expected this month. This is due to {reason}
- There was a Google algorithm update at {date} that impacted our organic search traffic
Once you’ve established the state of organic traffic, the next task is to dig into the keyword rankings to understand which keywords are driving the most traffic.
Clients or stakeholders rarely want to see all of the tracked keyword rankings for their site.
Usually, they want to see:
- Winner and loser keywords from the time period – which keywords improved and which declined?
- A keyword position spread – for example, XX keywords rank in positions 1-5, XX position rank in positions 6-10)
You can use various keyword tracking tools to do this, but you’ll need a tool like Rank Tracker to regularly track your keyword rankings.
Let’s see how we can include these elements in our report using Rank Tracker.
To find keywords that have improved:
- Head to Position
- Select Improved
To view loser keywords, repeat the process but select Declined.
Once you have exported the keywords, you can present them in a simple table and add a bullet point commentary. 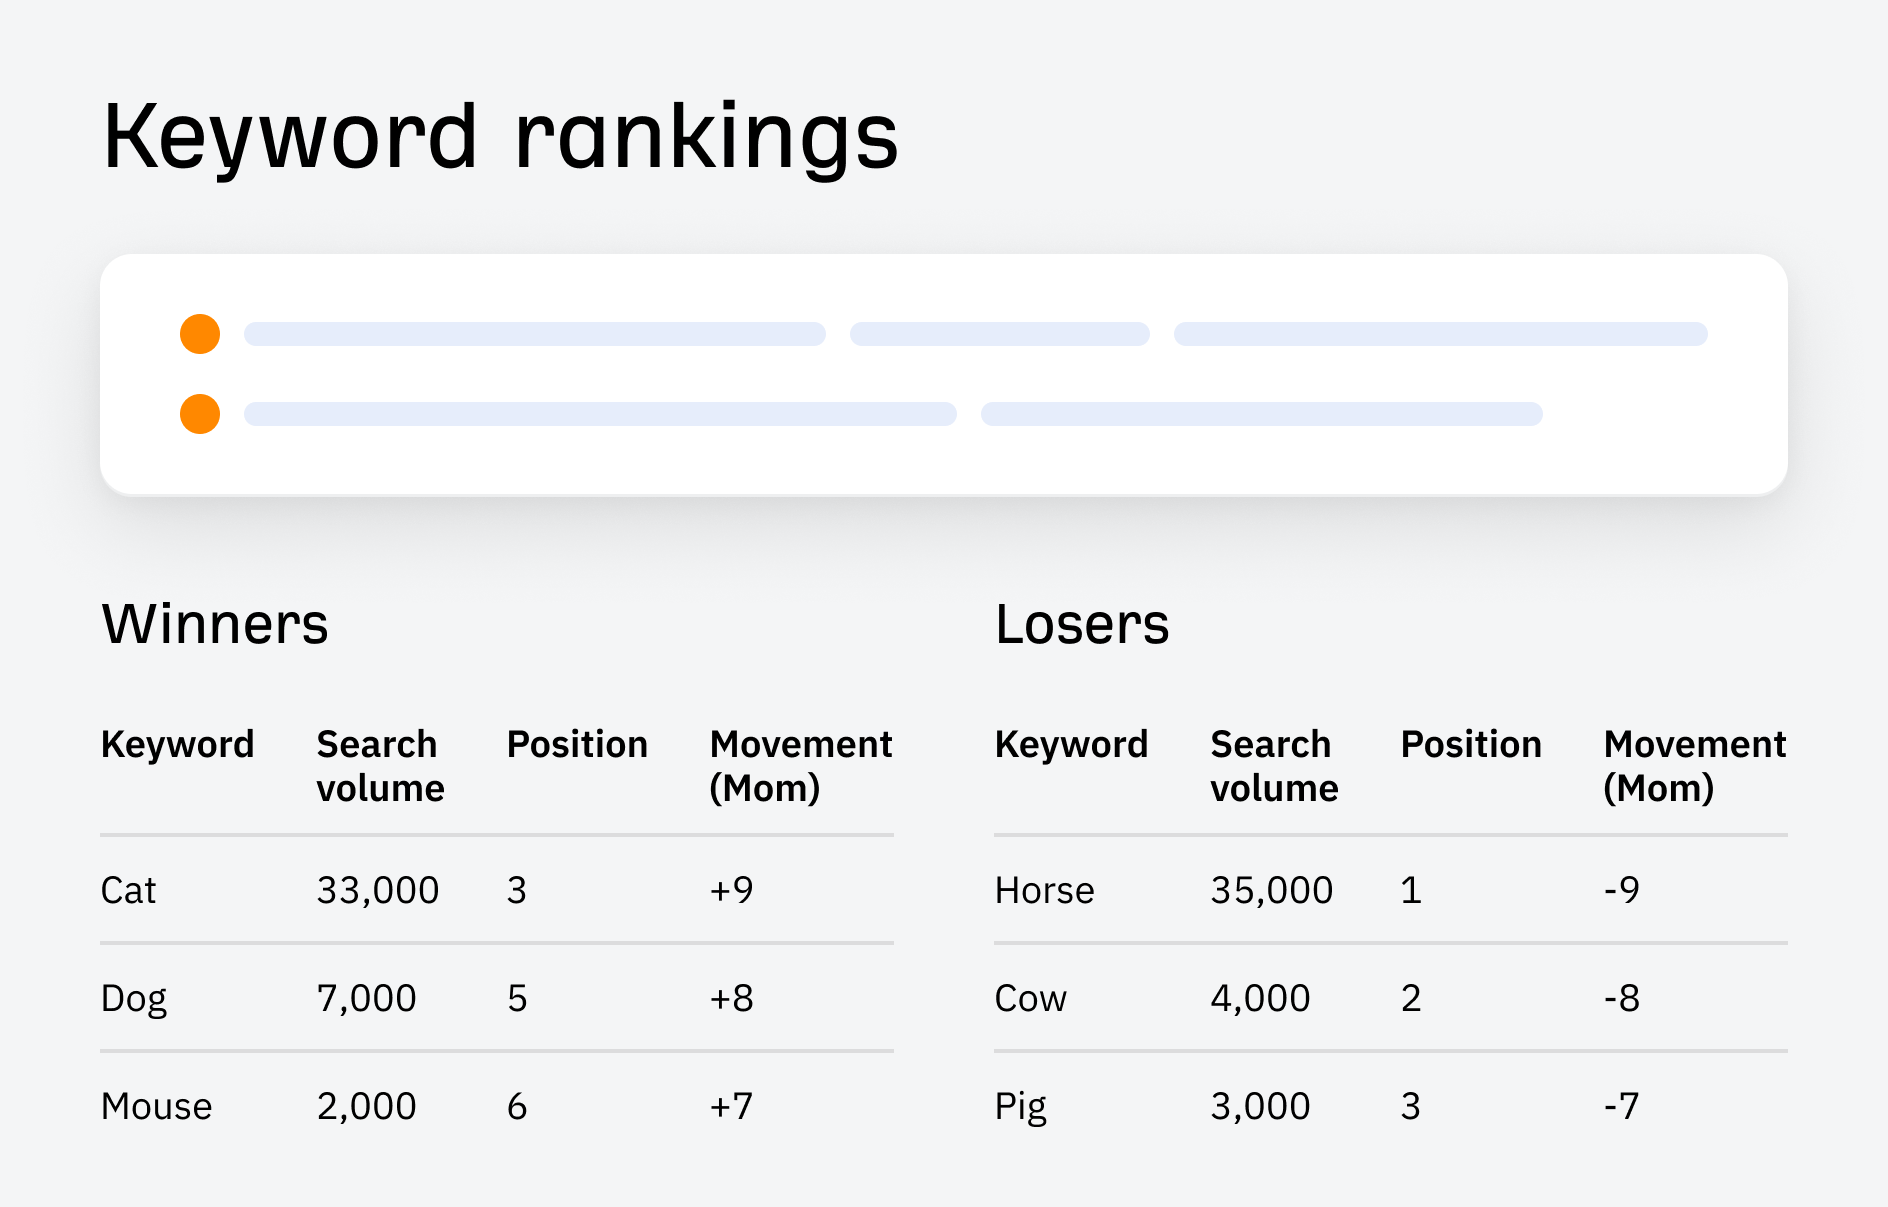
To see a keyword position spread, select a time period, then click on the Positions tab, and it will show how many keywords rank in each position.
You can visualize this in a chart over time like below, or you can take a screenshot from Ahrefs and include it in your report. 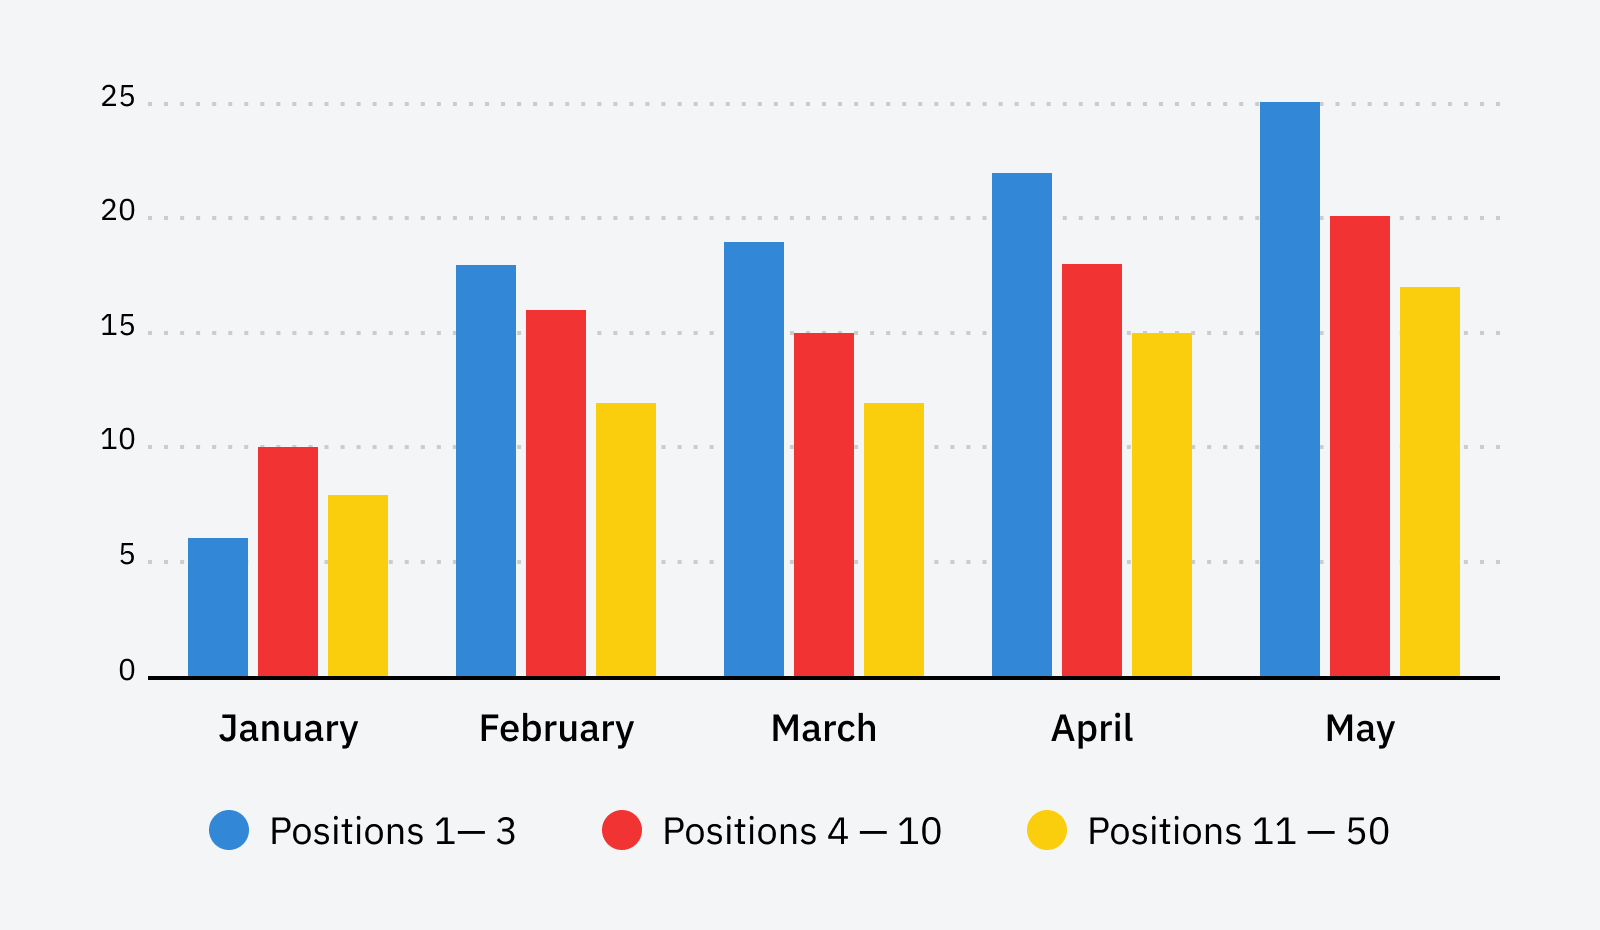
On the same dashboard, you can get the headline metrics like share of voice, average position, and SERP features.
If you’ve dabbled in SEO, you’ll know that links are a fairly big deal for SEO. So, how do you report on them in an SEO report?
SEO clients and stakeholders usually want to know two things:
- The number of external links you acquired during the time period
- The quality of those links
Luckily, Ahrefs’ Site Explorer can help you report on both elements.
But before we dive too much into the details, let’s see how we can get an overview of the last calendar month.
To do this:
- Head to Calendar on the sidebar
- Click on the Referring domains tab
- Check Dofollow
- Best links: Only
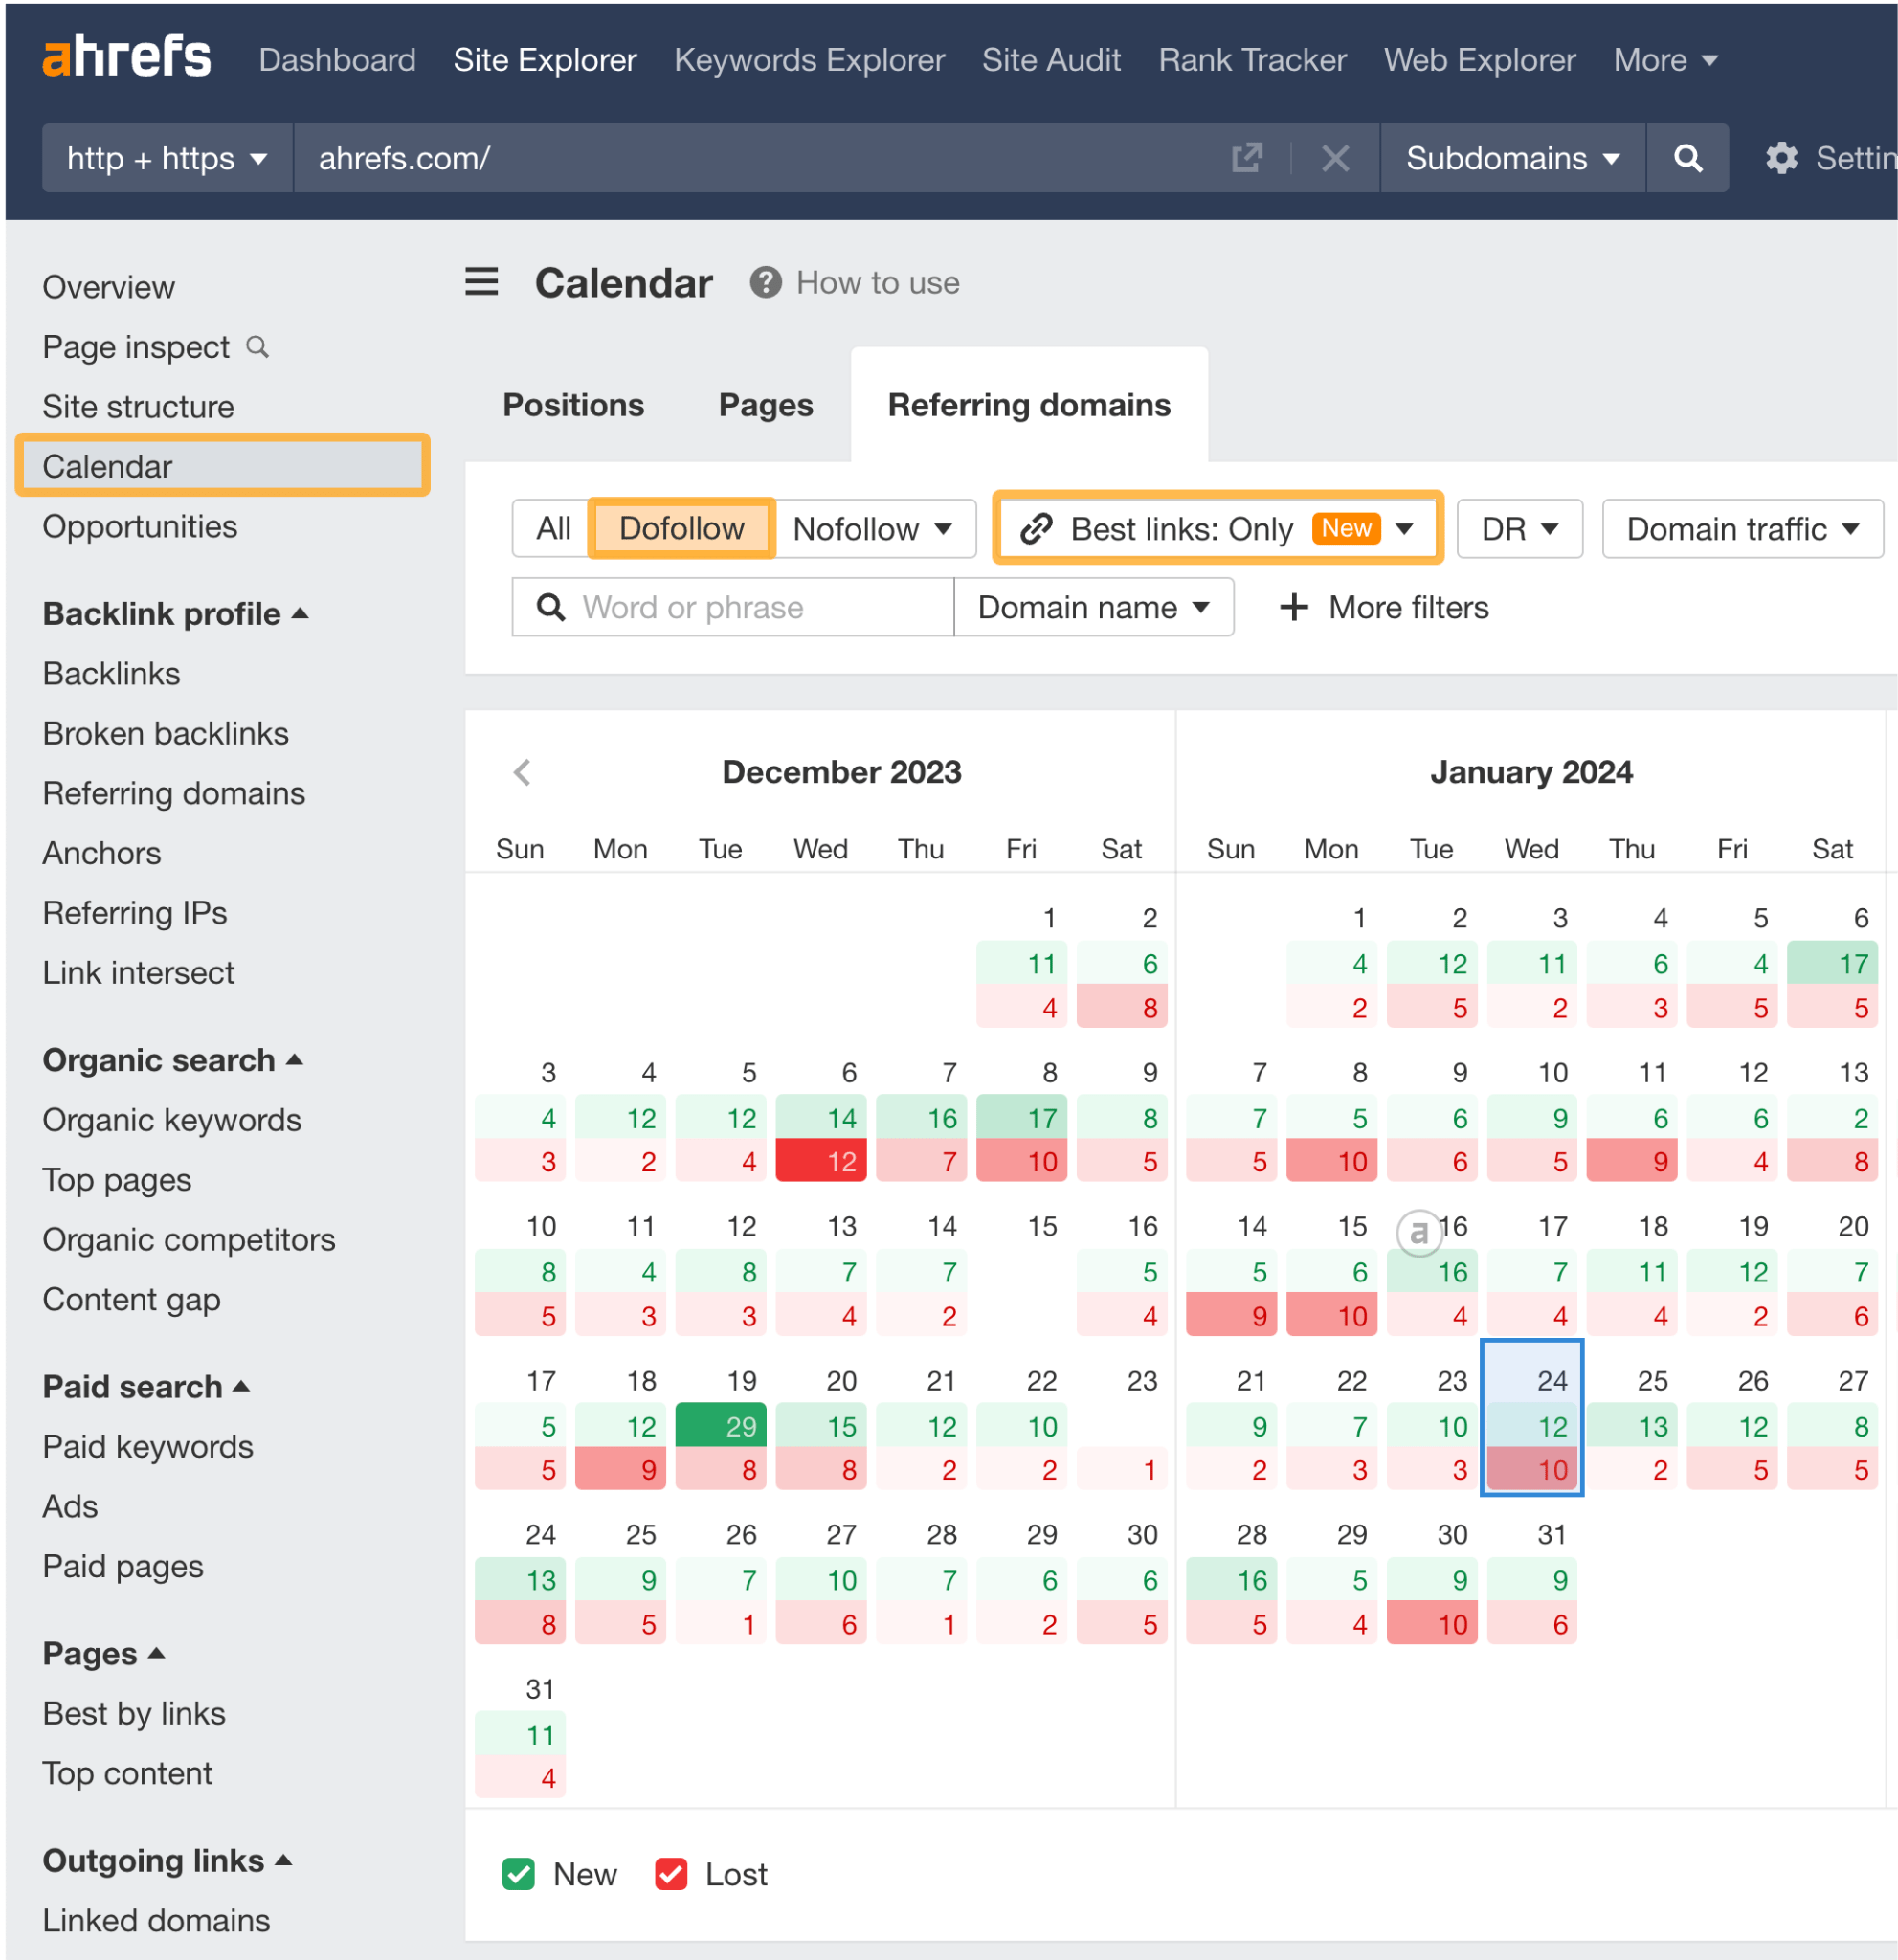
You could include a screenshot of this heatmap in your report to provide a general overview of the last time period.
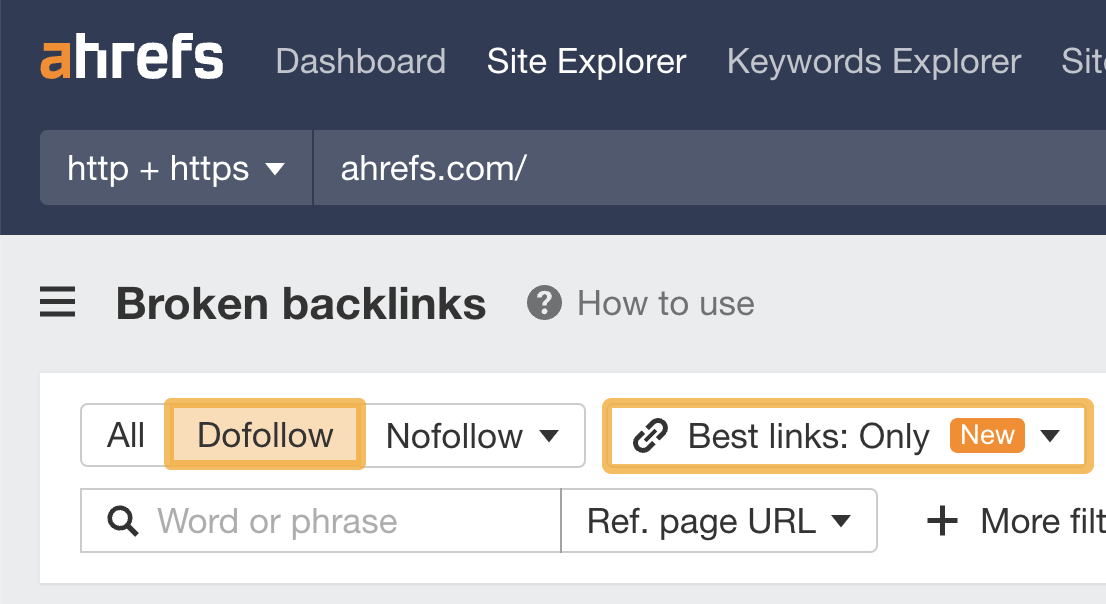
To find the number of links acquired from the last calendar period, do the following in Site Explorer:
- Select Dofollow
- Select New
- Set the time period (I’ve used the last 30 days, but you can use a custom range to get the exact dates for the previous month)
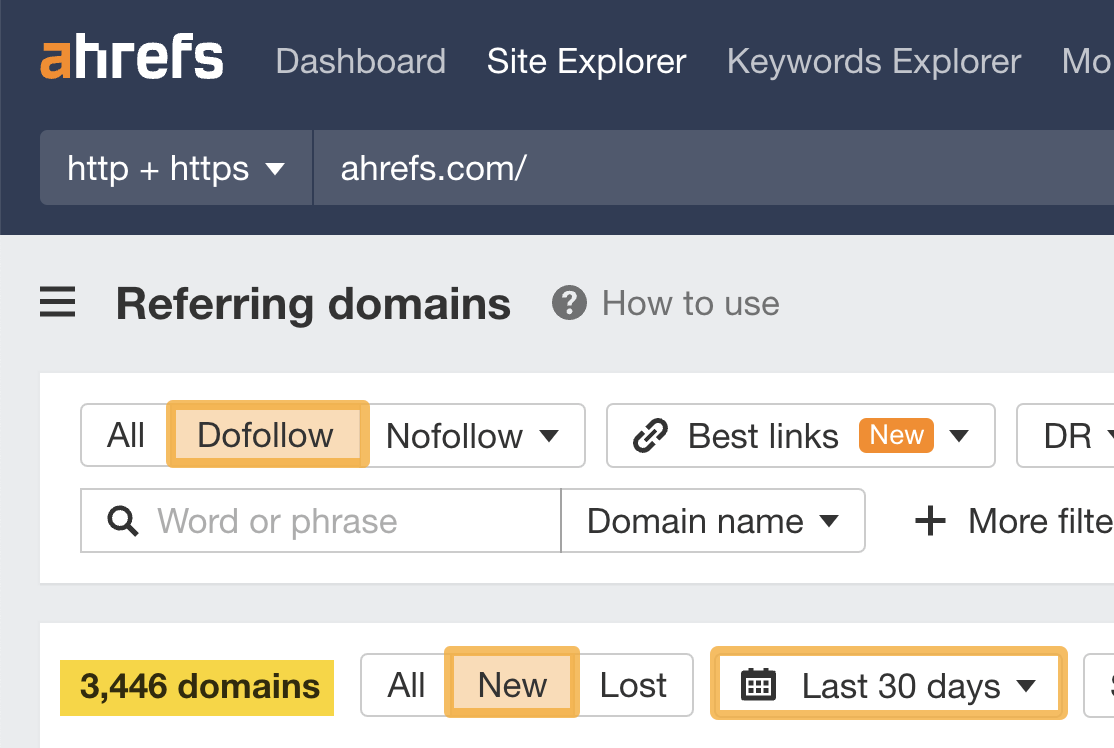
Once you’ve added these settings, you can see we’ve acquired 3,446 domains during this period.
If we want to highlight the quality of any of the links, we can do this in the report as well. Just scroll down to see all the domains.
Here’s an example of a high-quality link Ahrefs.com acquired during this period. It has a domain rating (DR) of 93. This is the type of link that would be worth sharing in an SEO report.
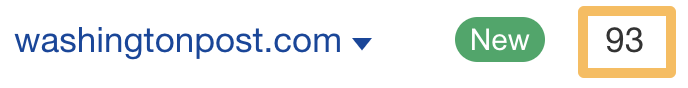
Once we’ve shown this is an important link, the first question stakeholders might ask is, what is the Washington Post linking to on Ahrefs?
If we click on that link, we see they’re linking to our SEO basics article.
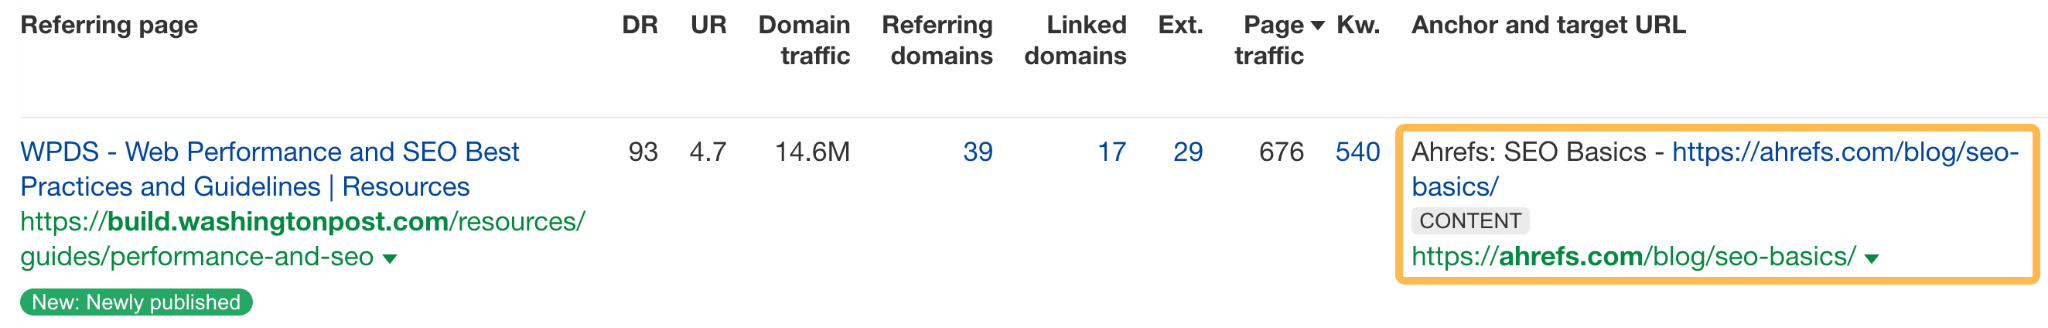
This would be a valuable insight to share in the SEO report because it shows that this type of content is capable of earning high-quality links.
Business cases for creating new content can be hard at the best of times. By highlighting high-quality links in your SEO report, the value of content becomes more obvious to stakeholders, and they’ll be more inclined to increase investment in SEO.
As well as reporting on links you’ve acquired, it’s worthwhile to report on links you’ve lost.
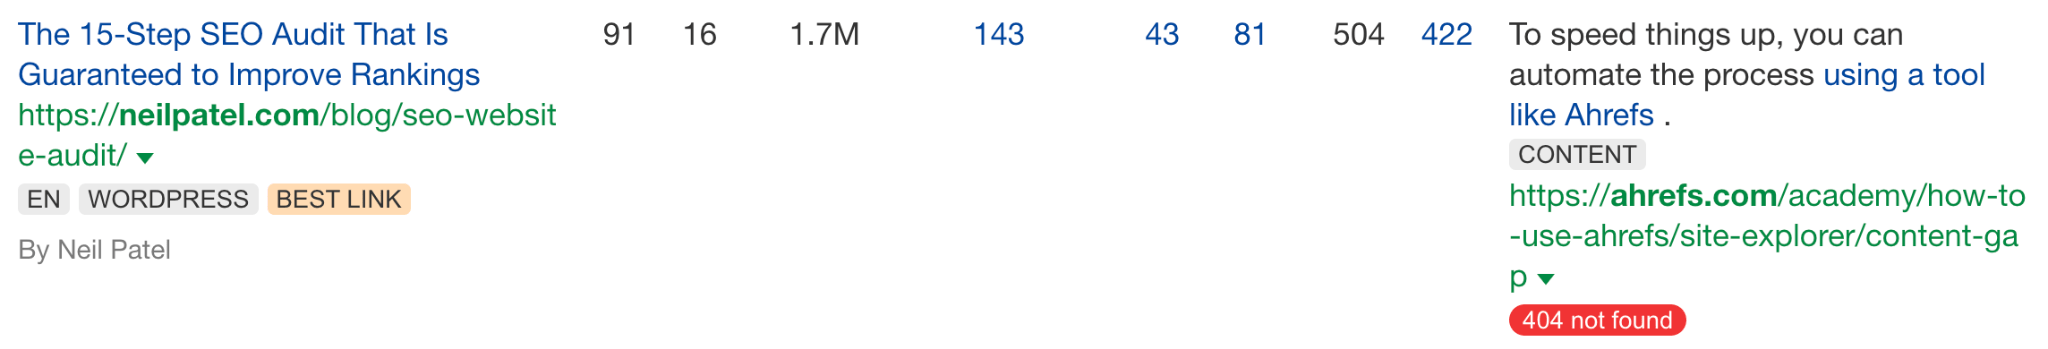
Sometimes, you can lose links accidentally by making site changes. You can report on this using Ahrefs’ Broken backlinks report.
We can see that Ahrefs has a broken backlink from Neil Patel… alas.
Reporting on technical SEO is often harder than it looks. For SEOs, it’s easy to get lost in the details, but most stakeholders aren’t as interested in the details as you are and just want to know one thing: is their site in good technical health?
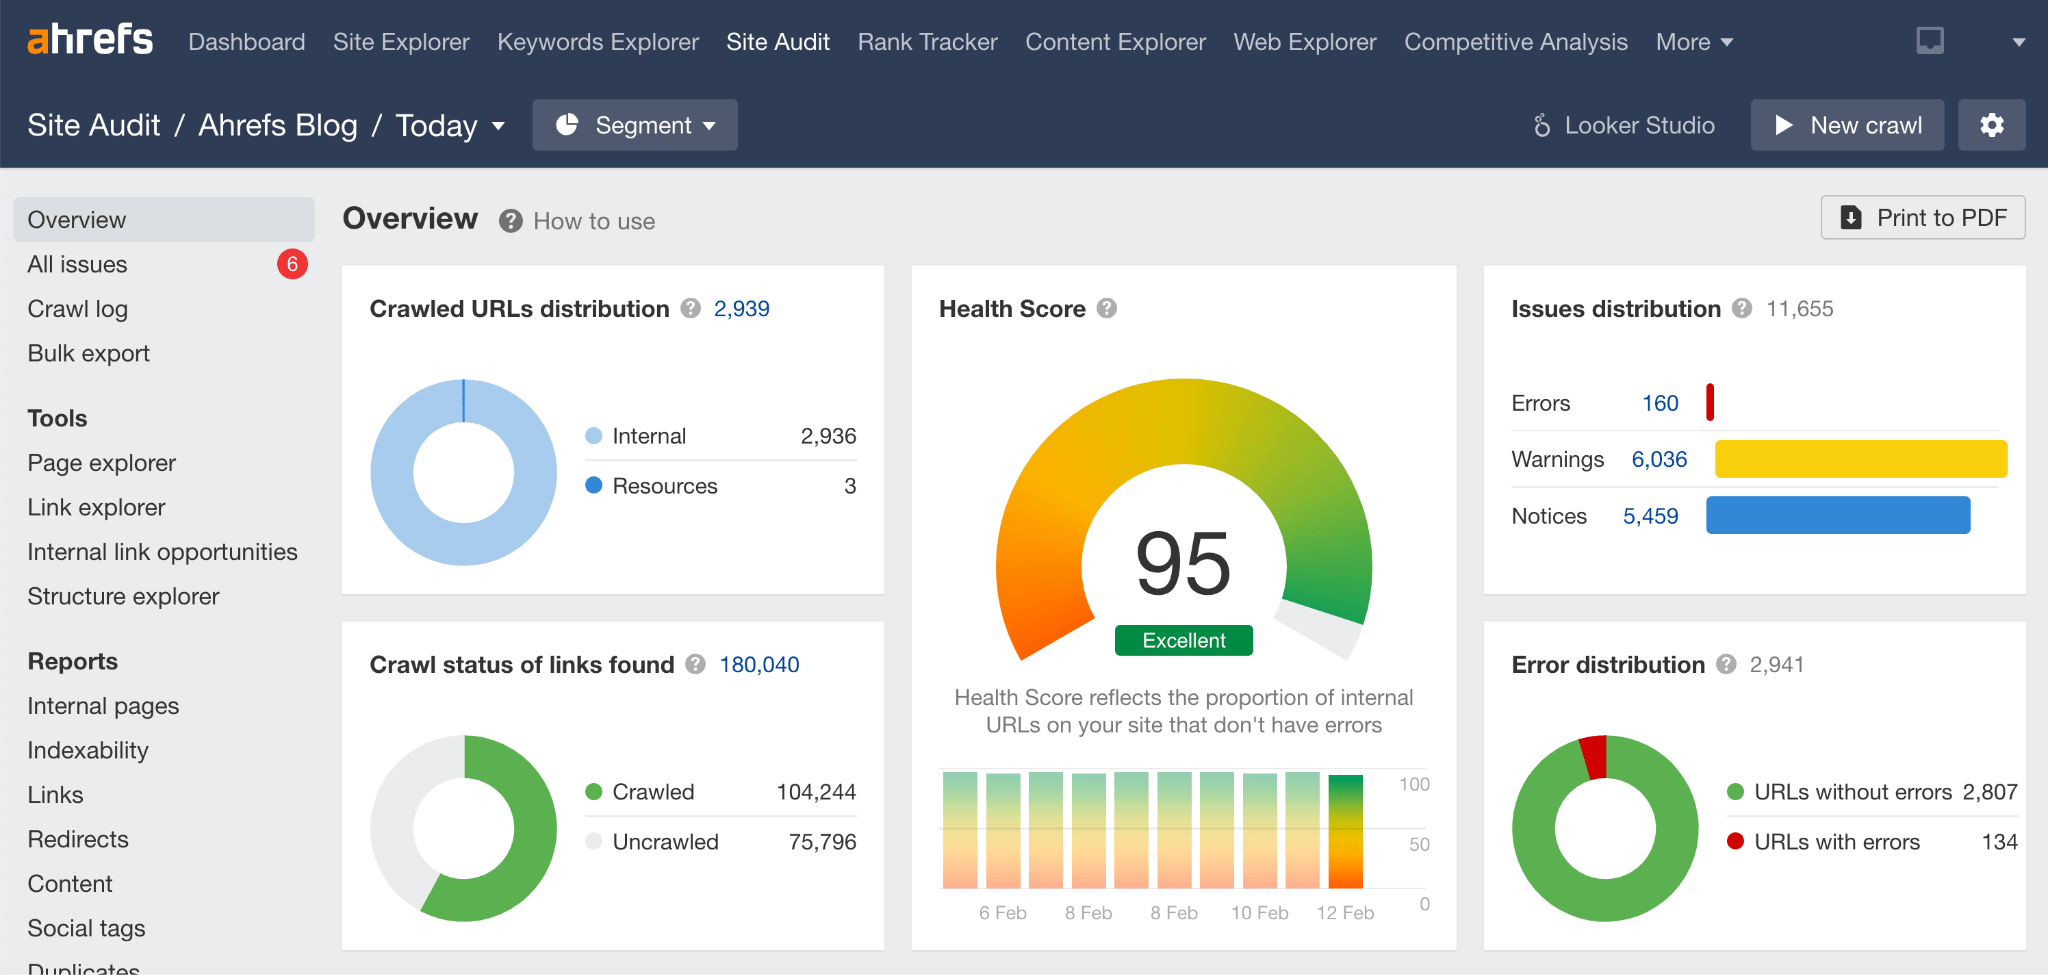
To answer this question, you can run a Site Audit crawl and check the website health score.
If you have access to Google Search Console, you can run a Site Audit for free on your website. Click here to get started.
Site Audit scores your website from 0-100 after the crawl based on its technical SEO health status. If the score is low, it means there are some technical issues to be fixed.
As well as running a Site Audit crawl, you can check in GSC to see if there are any technical issues with page indexing or page experience (like core web vitals or HTTPs).
Usually, if everything is fine, there isn’t any need to report on it. Unless your stakeholder or client is technically focused, keeping the technical part of your report as concise as possible is best.
If you create content regularly, assessing its performance in your SEO reporting is important—otherwise, you won’t know whether you are wasting your time.
In my experience, when it comes to content, stakeholders want to know:
- What the best-performing content was during the time period
- What organic traffic it drives
- What opportunities exist in the content space
For smaller content projects that have less than 1000 URLs, you can use Portfolios to track these keywords.
I use Portfolios myself to track the performance of my articles in Ahrefs.
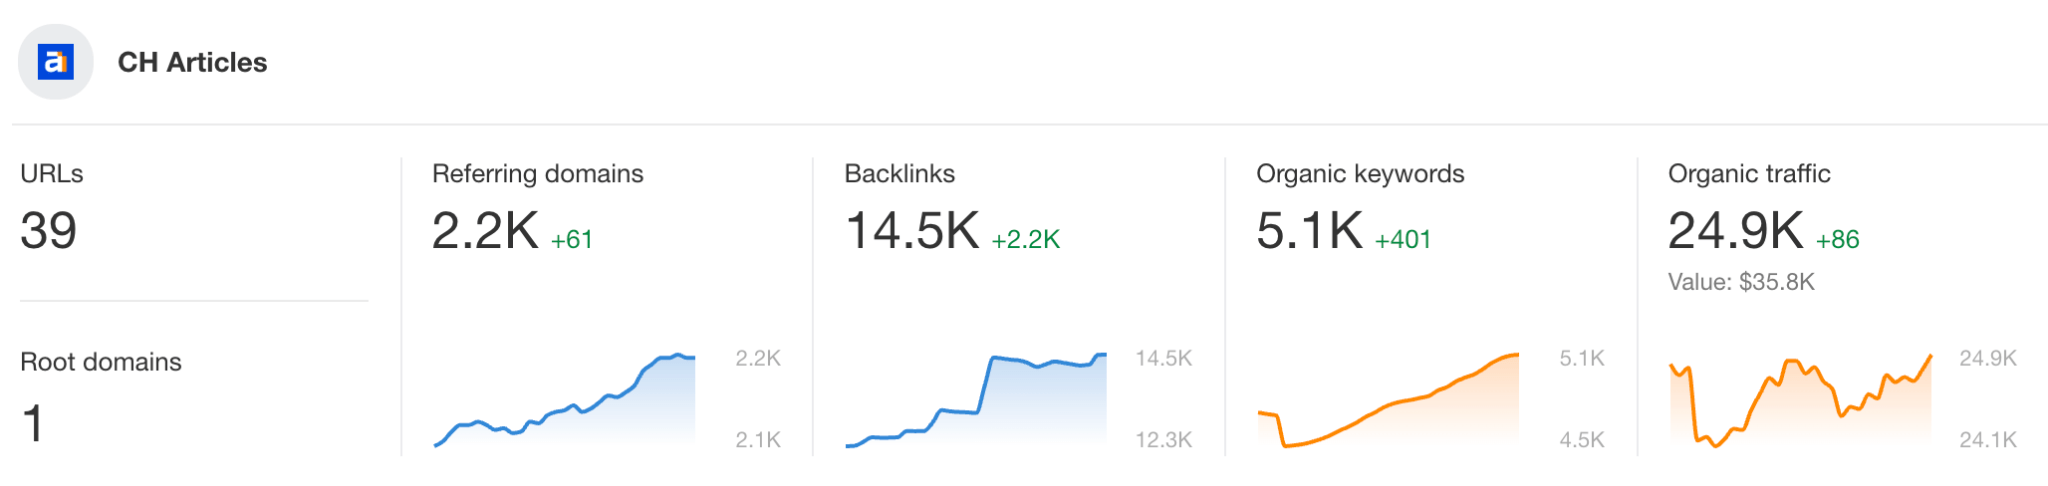
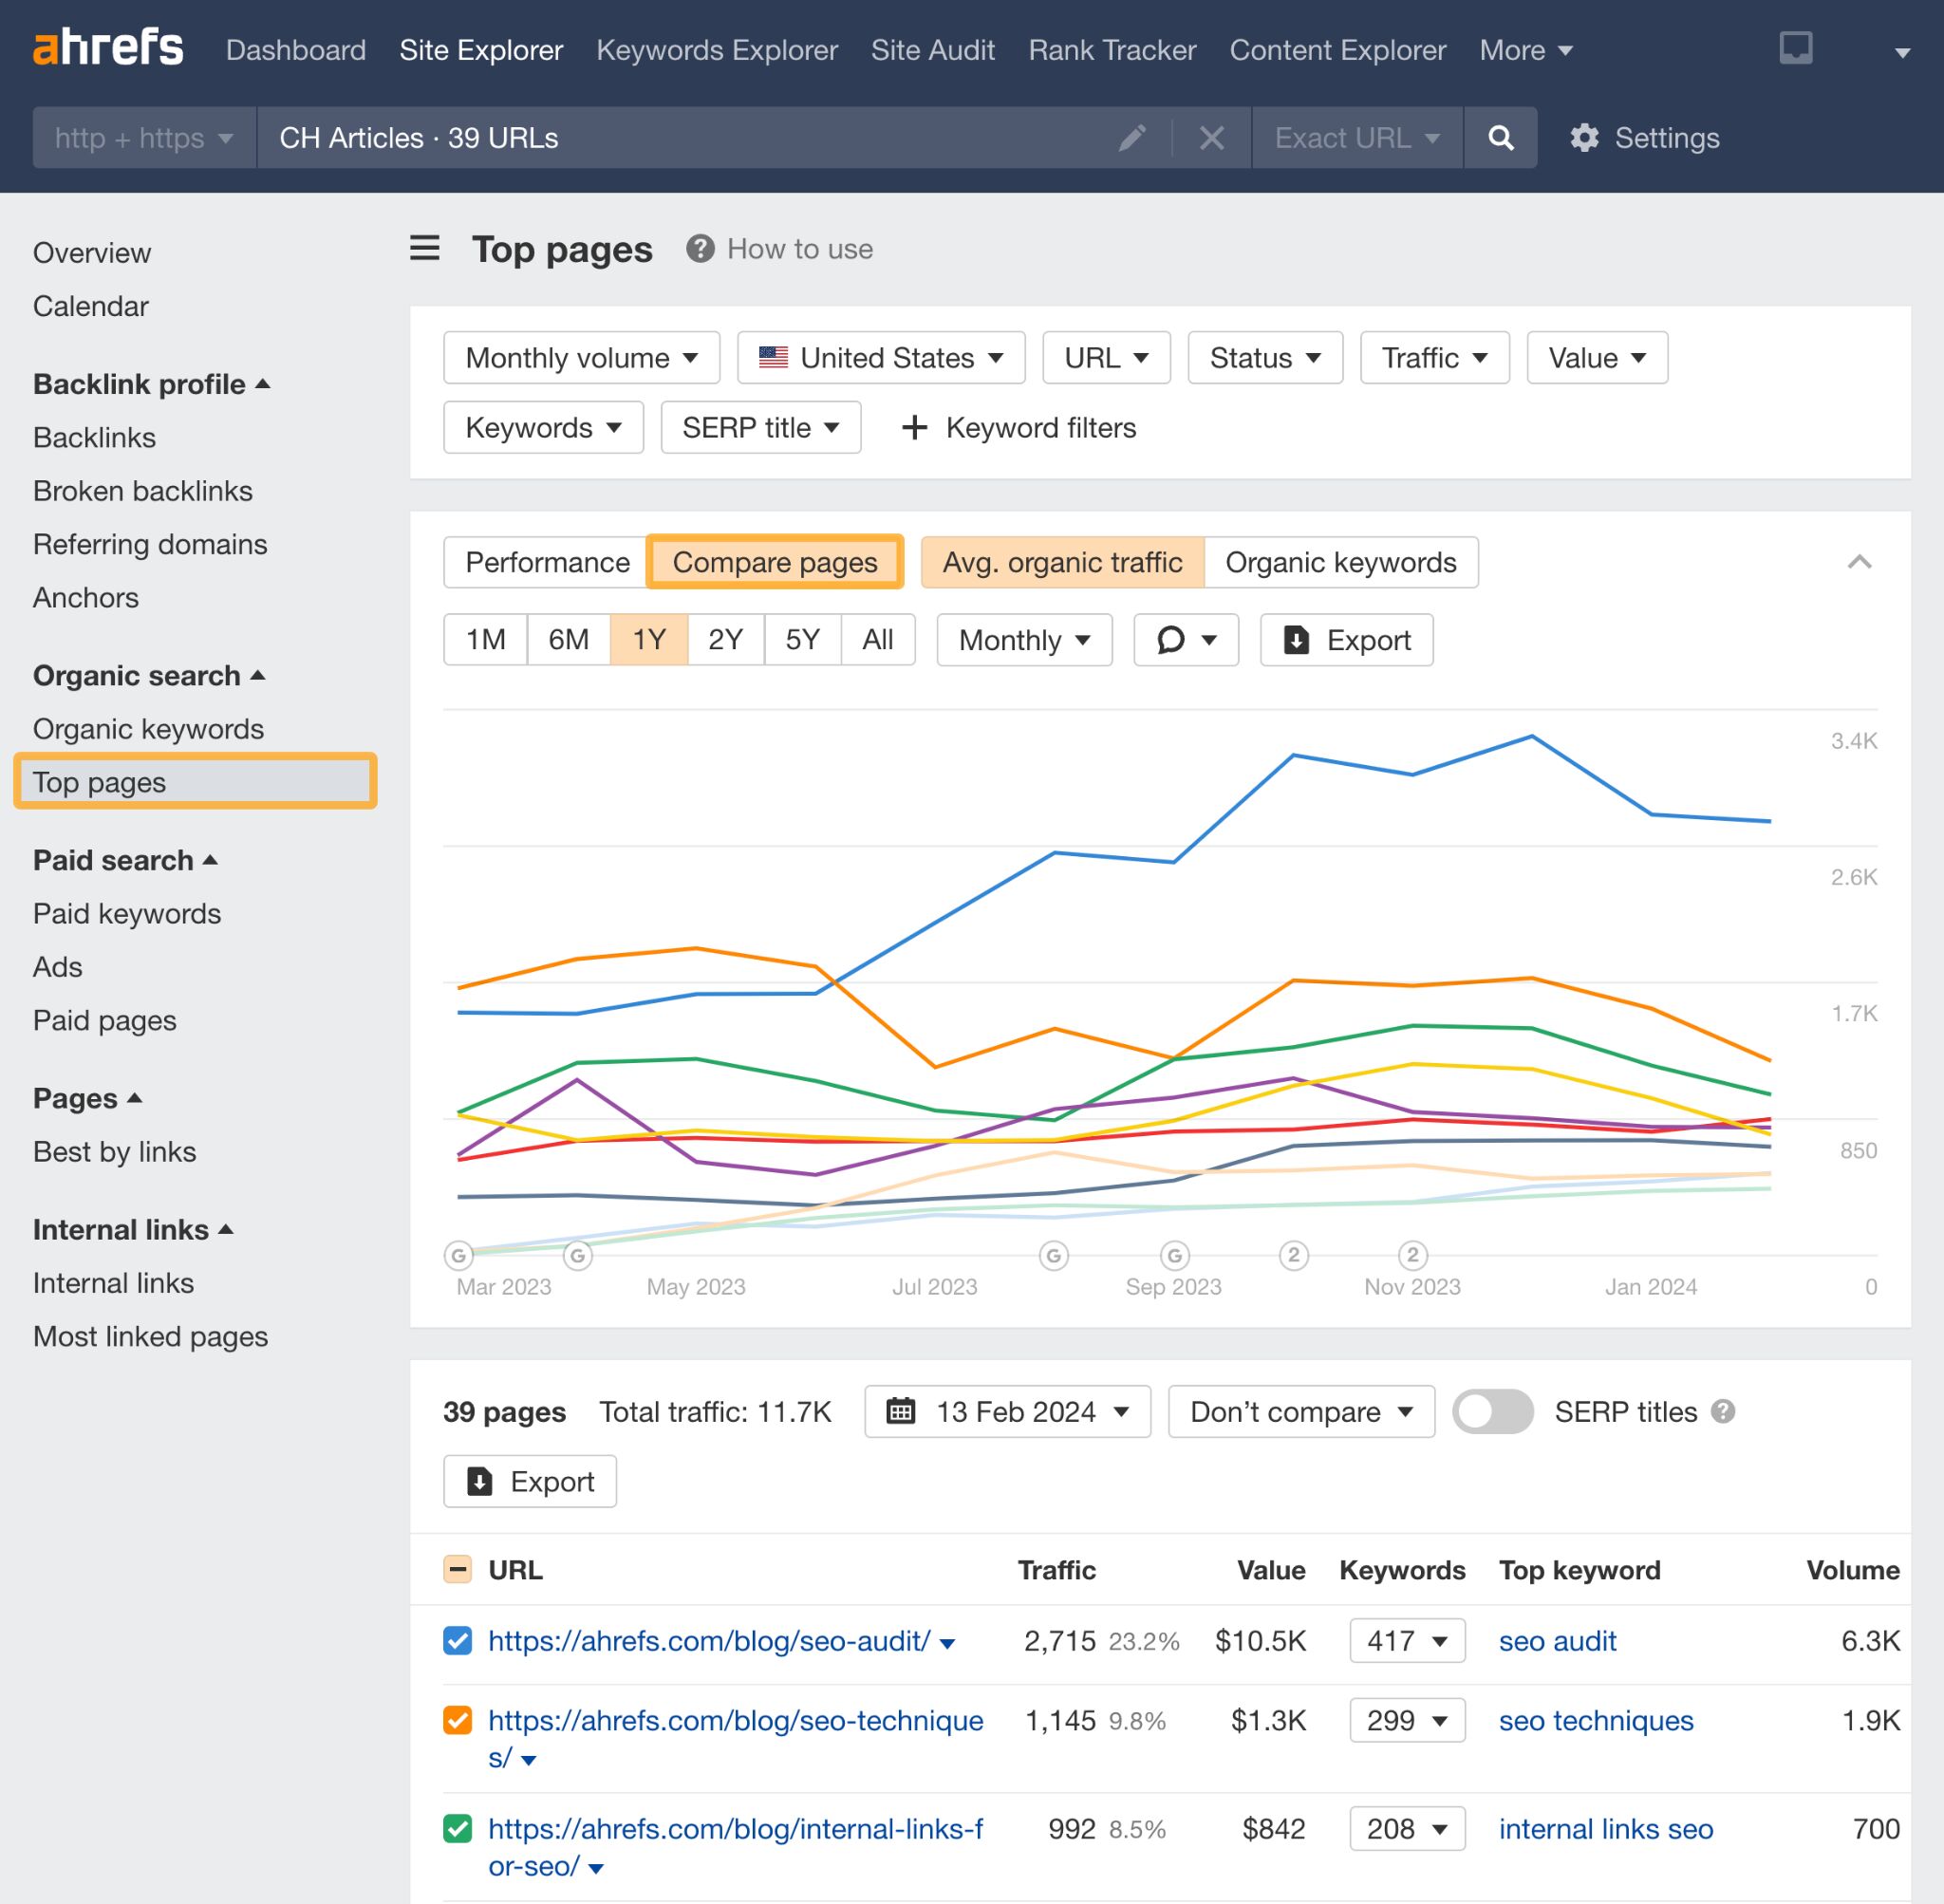
Once you’ve set up your Portfolio, head to the Top pages report and click on Compare pages. On this page, you can get a good visual screenshot to share in your report of content performance, or if you want, you can Export the data and chart it yourself in a spreadsheet.
In addition to reporting on your site’s performance, it can also help to report on your competitor’s performance.
This gives stakeholders a better understanding of the digital landscape they are operating in: who they’ll compete with in SERPs, and who they should look to for inspiration.
You can do this in 30 seconds by heading to Site Explorer and typing in your competitor in the search bar.
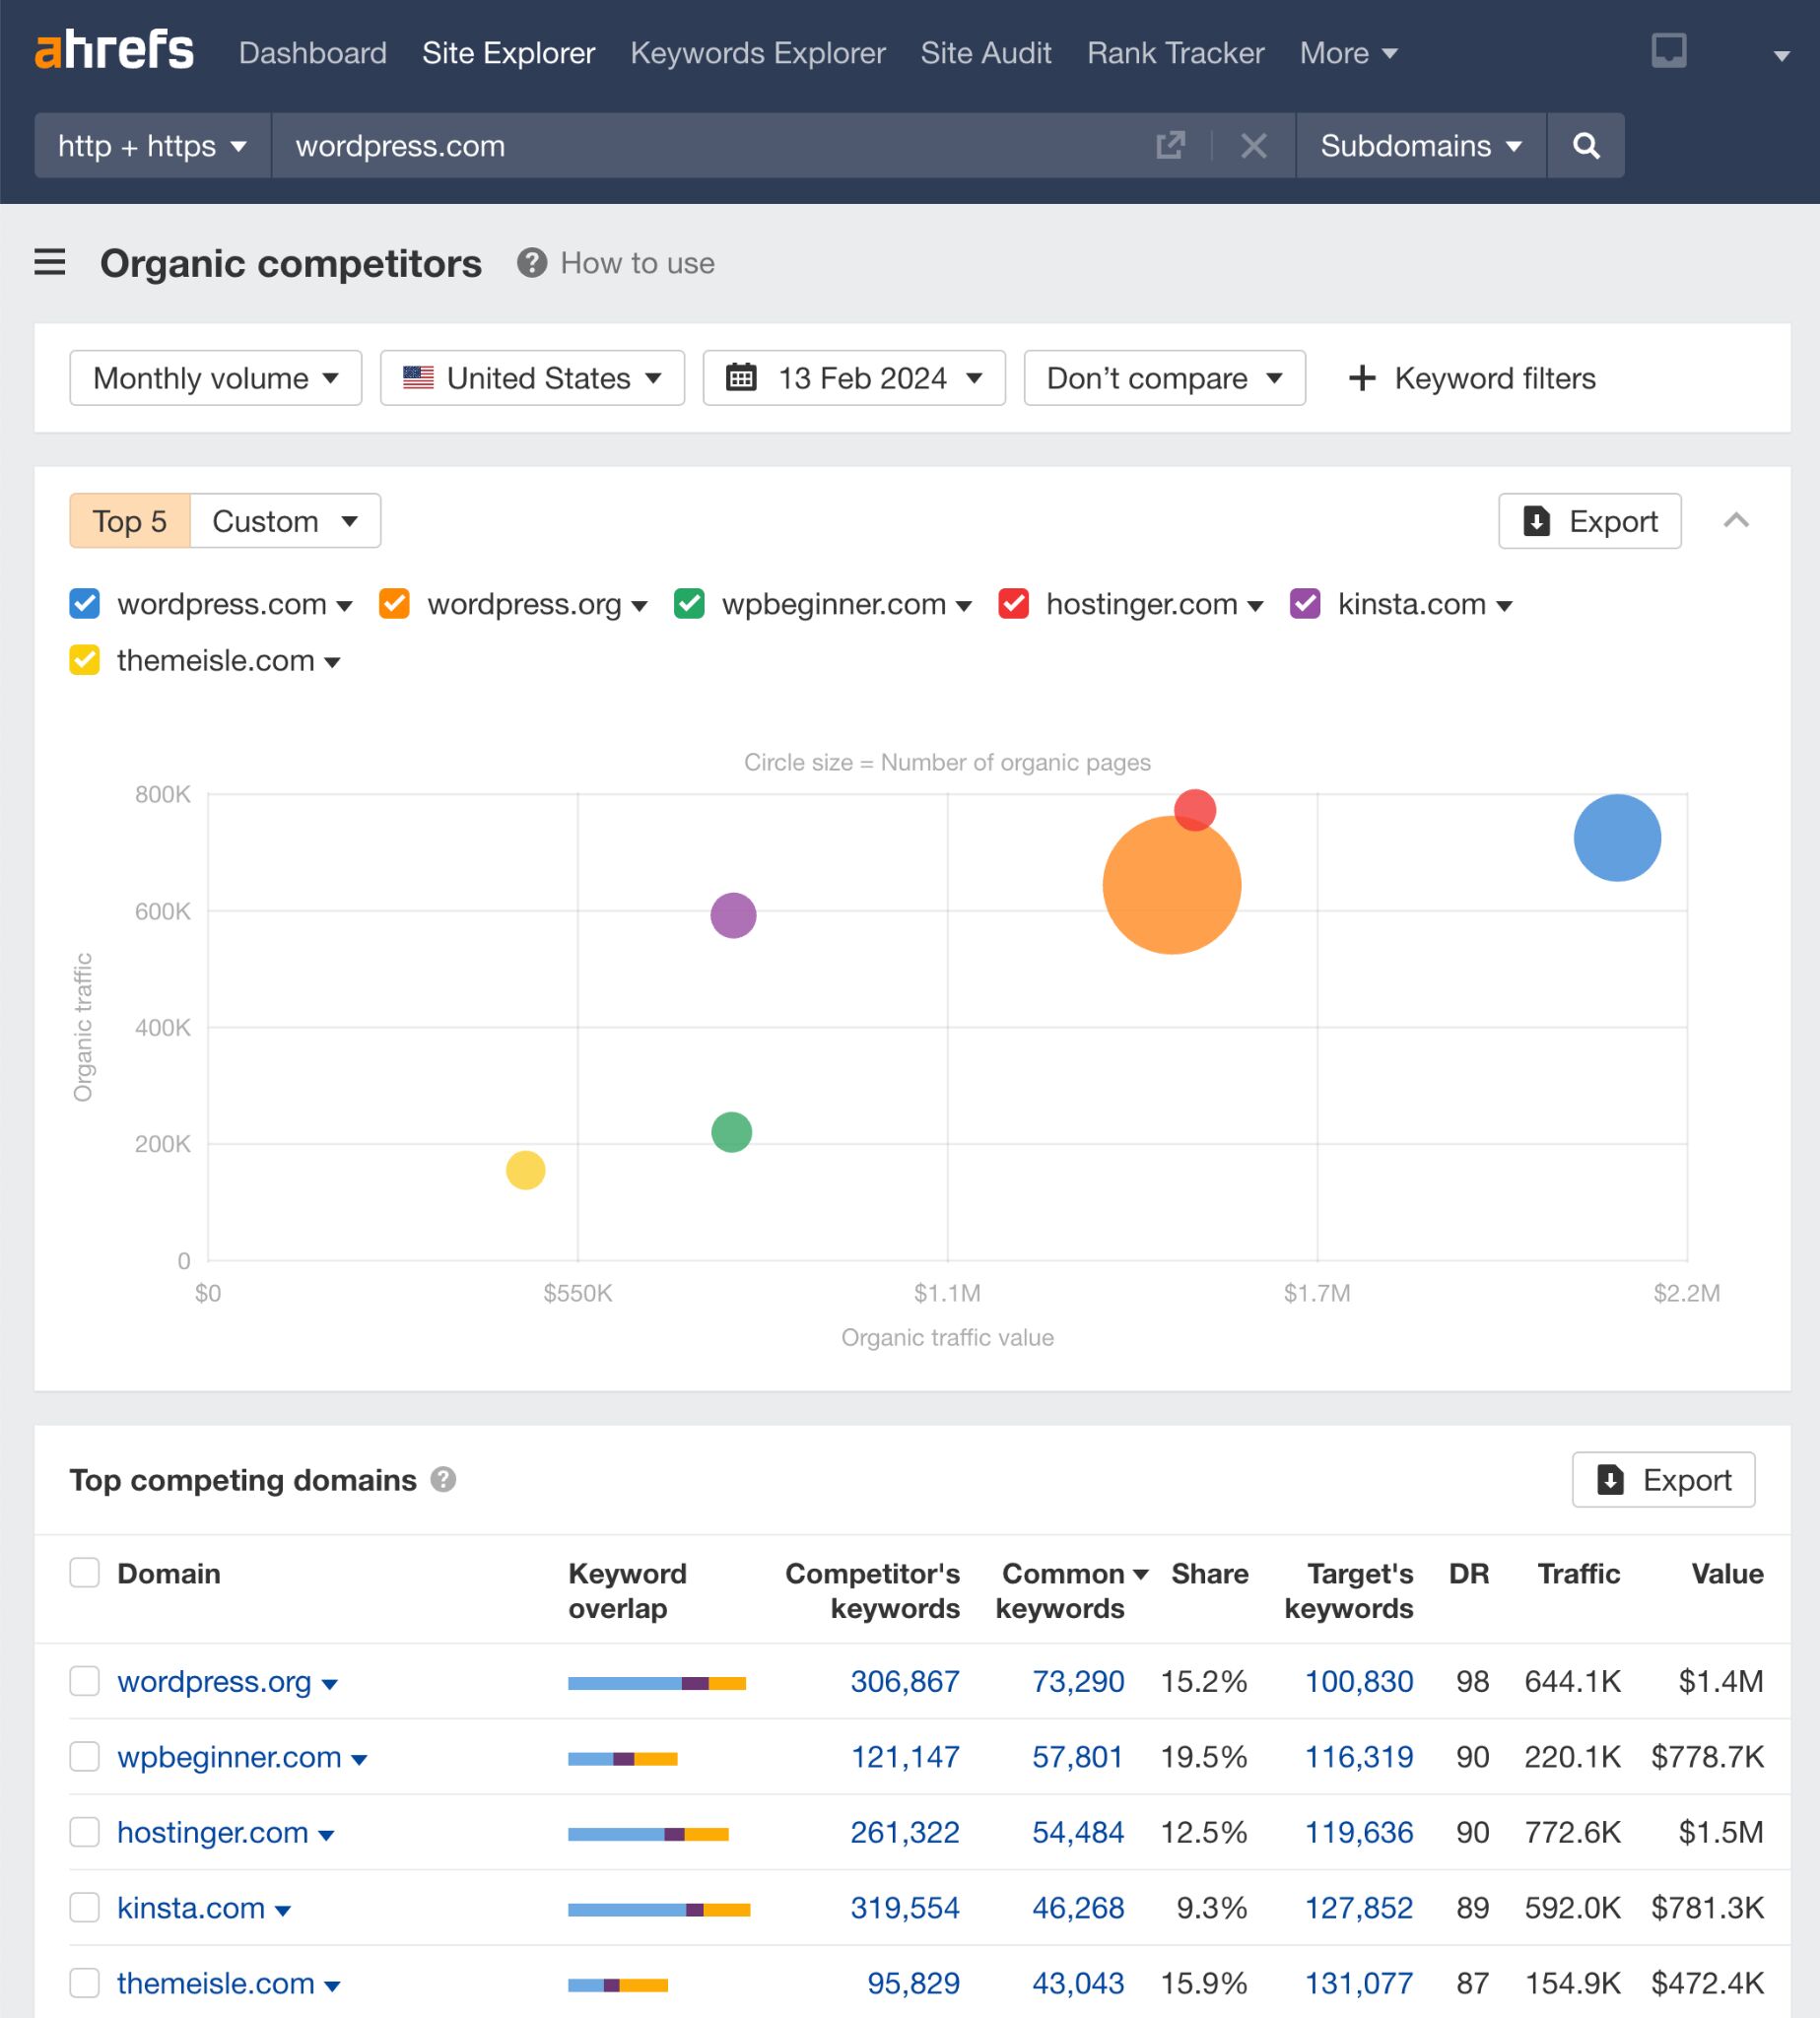
Then click on the Organic competitors report, and you’ll get an overview of the top competitors in your space.
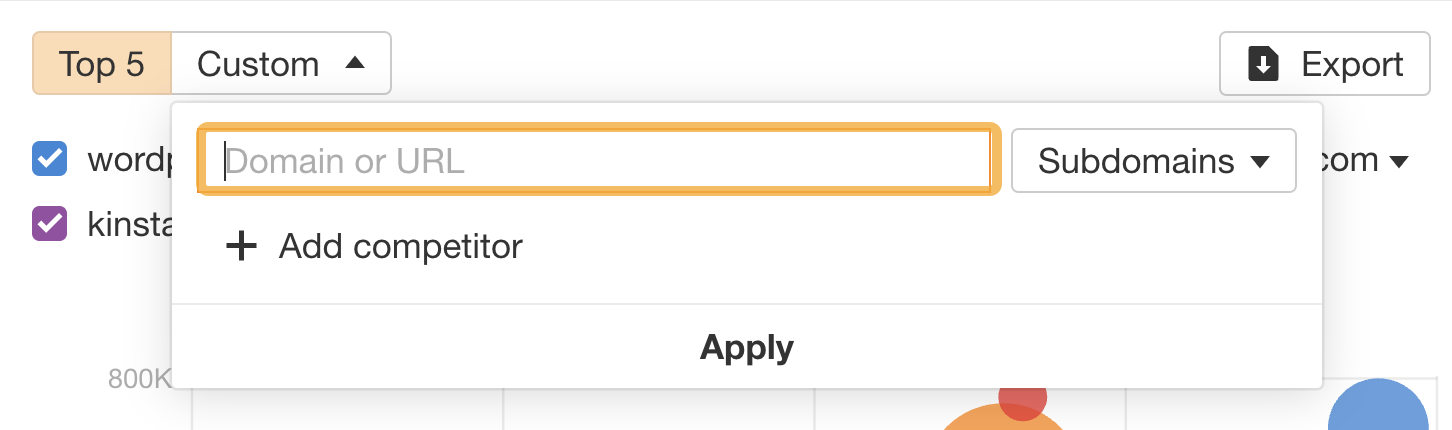
If you want to add specific competitors, you can do so using the Custom tab.
This report is helpful as it gives you a client-friendly visual representation of your competitors’ performance. But more importantly, it shows your competitors’ keywords and their overlap with your own site, helping you to make strategic SEO decisions to outrank them.
In the SEO report, I would screenshot the top half to include in my report and then export the data from the bottom half of the table to filter out the more detailed information that would interest the stakeholders.
Ahrefs makes it easy to find things to improve in its Opportunities report. This report can identify content, links, and technical opportunities in a single click.
Here’s an example of the content opportunities it can find:
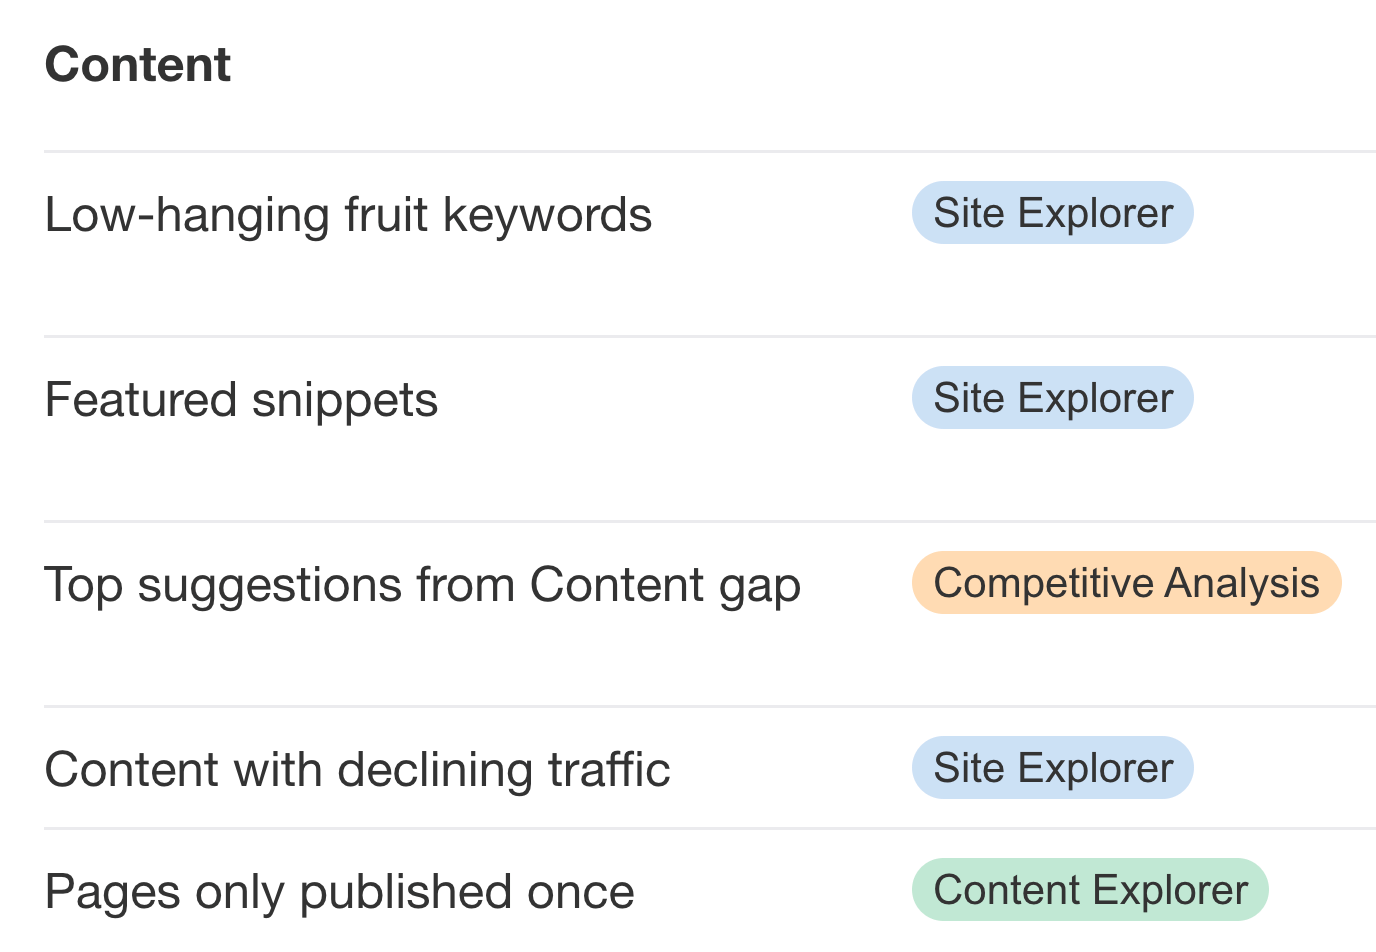
- Low-hanging fruit keywords: shows keywords between positions 4-15 in Site Explorer that could be easy to rank for.
- Featured snippets: shows keywords between positions 2-8 in Site Explorer where the target doesn’t rank for a featured snippet
- Top suggestions from Content gap: shows keywords that the target’s top 10 competitors rank for, but the target doesn’t
- Content with declining traffic: shows pages with declining traffic in the last six months that could do with an update
- Pages only published once: shows old pages that have low traffic that might need an update
If you work through this report, it’s easy to spot opportunities for the website you’re reporting on that you can share with stakeholders.
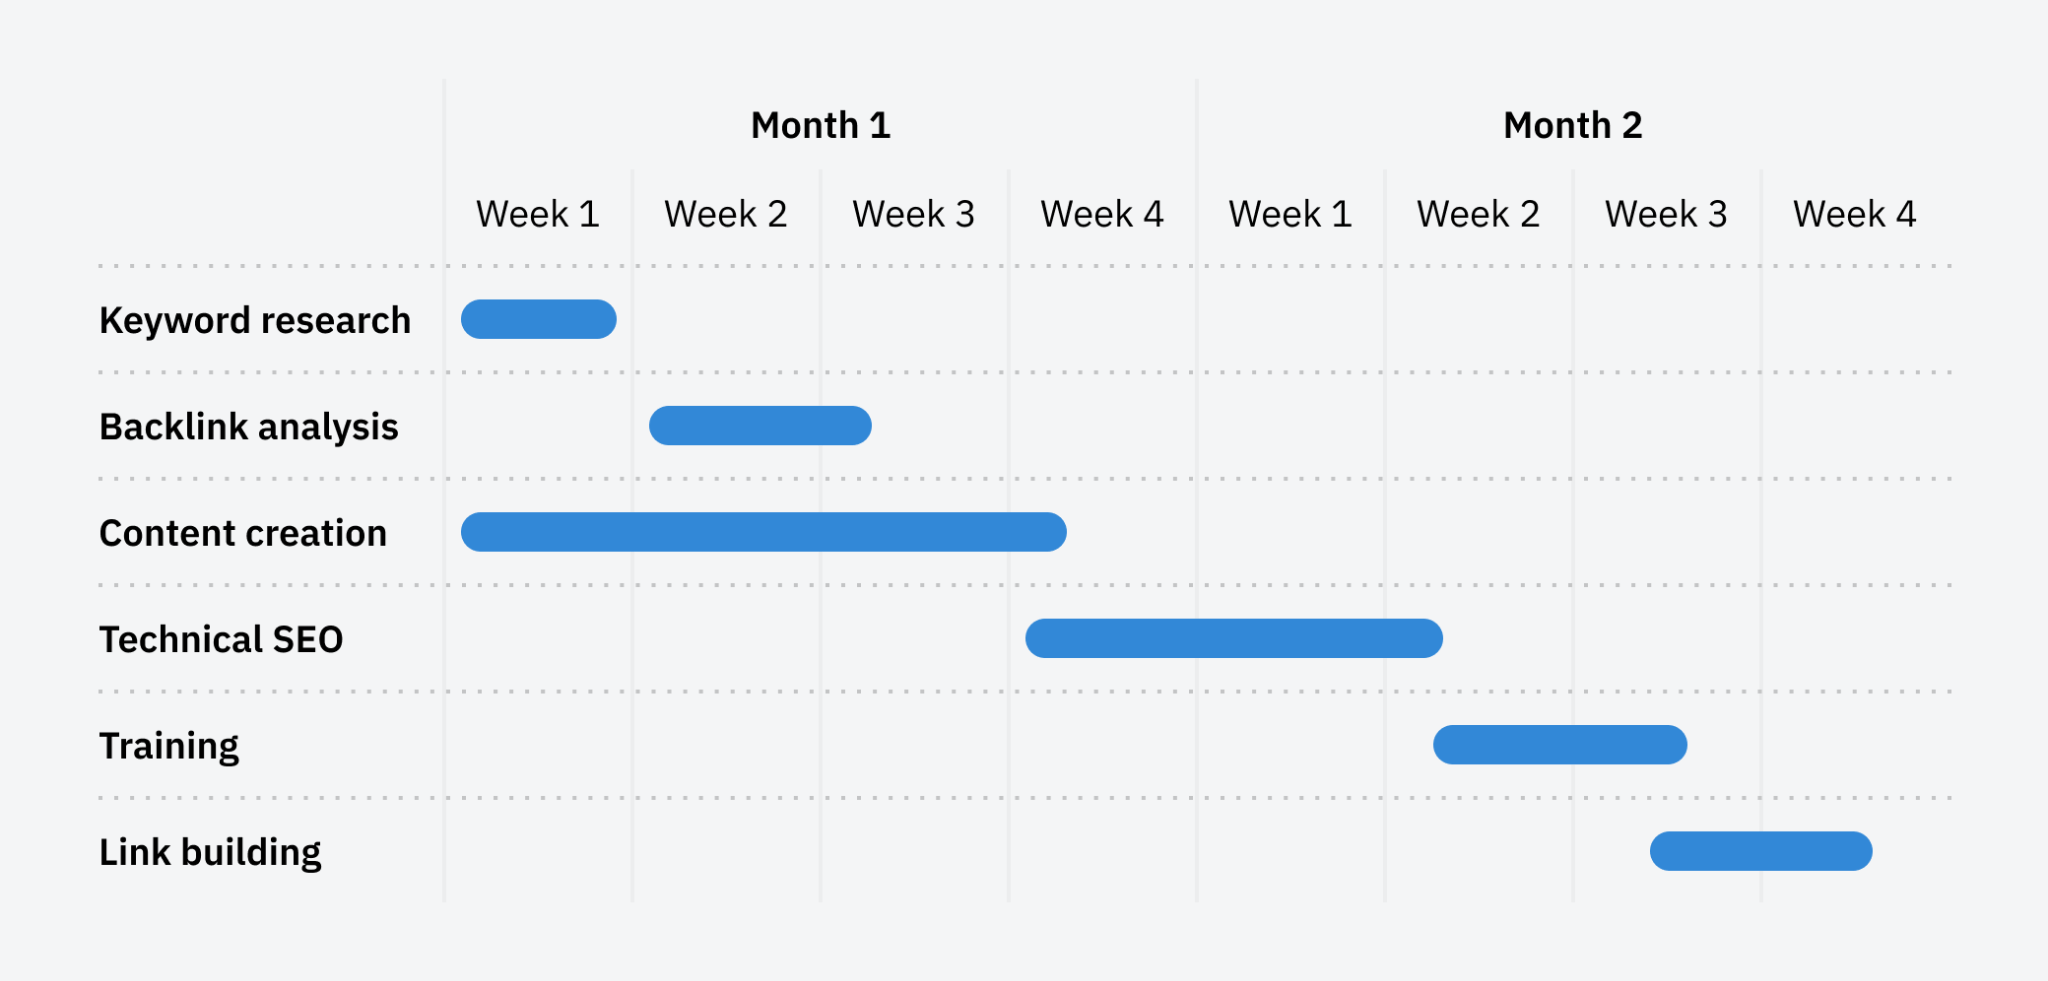
Lastly, most SEO reports will share an update on the progress of their SEO campaign: the work that’s been completed so far, the next stages of the process, and the milestones you aim to hit.
The best way to do this is to share progress through an SEO roadmap Gantt chart showing your total SEO campaign.
Rather than messing around with a spreadsheet, I usually head to Canva and use one of their premade templates.
But if you want to go down the spreadsheet route, you can use our Google Sheets template.
You can quickly adapt these templates for your purposes, giving stakeholders a good idea of what work has been done on the account and what is coming next.
Final thoughts
SEO reports are important as they act as your virtual paper trail, documenting your progress to the top of Google. Without them, it can be hard to prove all the work you’ve put in to get to the number one spot.
But for many clients, SEO is just one small ingredient in the marketing mix. They aren’t as interested in the minutiae of SEO as you are. So, if you want to win your clients over on the value of SEO, show them the opportunity, appeal to their emotions, and ground your decisions in industry-trusted data—like Ahrefs.
Got more questions? Ping me on X. 🙂