Using Real-Time Data: Why It Matters and How to Do It

Today, readers are bombarded with more content than they could consume in a lifetime. And their attention spans, along with news cycles, are getting shorter. With so much information flying around at such a fast pace, engagement and loyalty are becoming more challenging to foster.
Now it’s more important than ever to craft stories that engage readers in the right way, at the right time, in the right place. Essential to that mission is knowing what content works, when, and where. Real-time data makes that possible.
Neil Powell, a seasoned product specialist at Parse.ly, recently hosted a webinar where he walked through the importance of real-time data and how to take advantage of it in the Parse.ly dashboard. Neil has been a Parse.ly power user for years, using the tool extensively during his previous role as the Head of Journalism for S&P Global.
During the webinar, Neil explained how to analyze real-time data to inform a content strategy that boosts engagement, loyalty, and exposure.
He covered how real-time data can help you:
- Understand which content resonates with your audience
- Inform your social media strategy
- Take advantage of spikes in traffic
- Curate your homepage with the most engaging stories and content.
Let’s recap what we learned.
Setting the baseline for real-time data analysis
At its core, real-time data is a form of experimentation where one plus one does not always equal two or even a clear, actionable directive. Often, to determine what works and what doesn’t, we need to adopt an agile mindset. After all, how each audience engages with content can vary widely by minute or by channel. What works once may not work again or from user to user. Establishing data-driven baselines is the formula for success here.
For example, let’s say we set a goal of increasing engagement on social media. A great starting point will be understanding what that engagement looks like today—the status quo. Once we start taking action, we’ll create a hypothesis and check it against our baseline, asking: Is this action moving things up or down, or is it making things worse?
Setting a baseline helps us parse through actions and activities that drive engagement, loyalty, and exposure, and those that don’t.
Removing the cheat codes
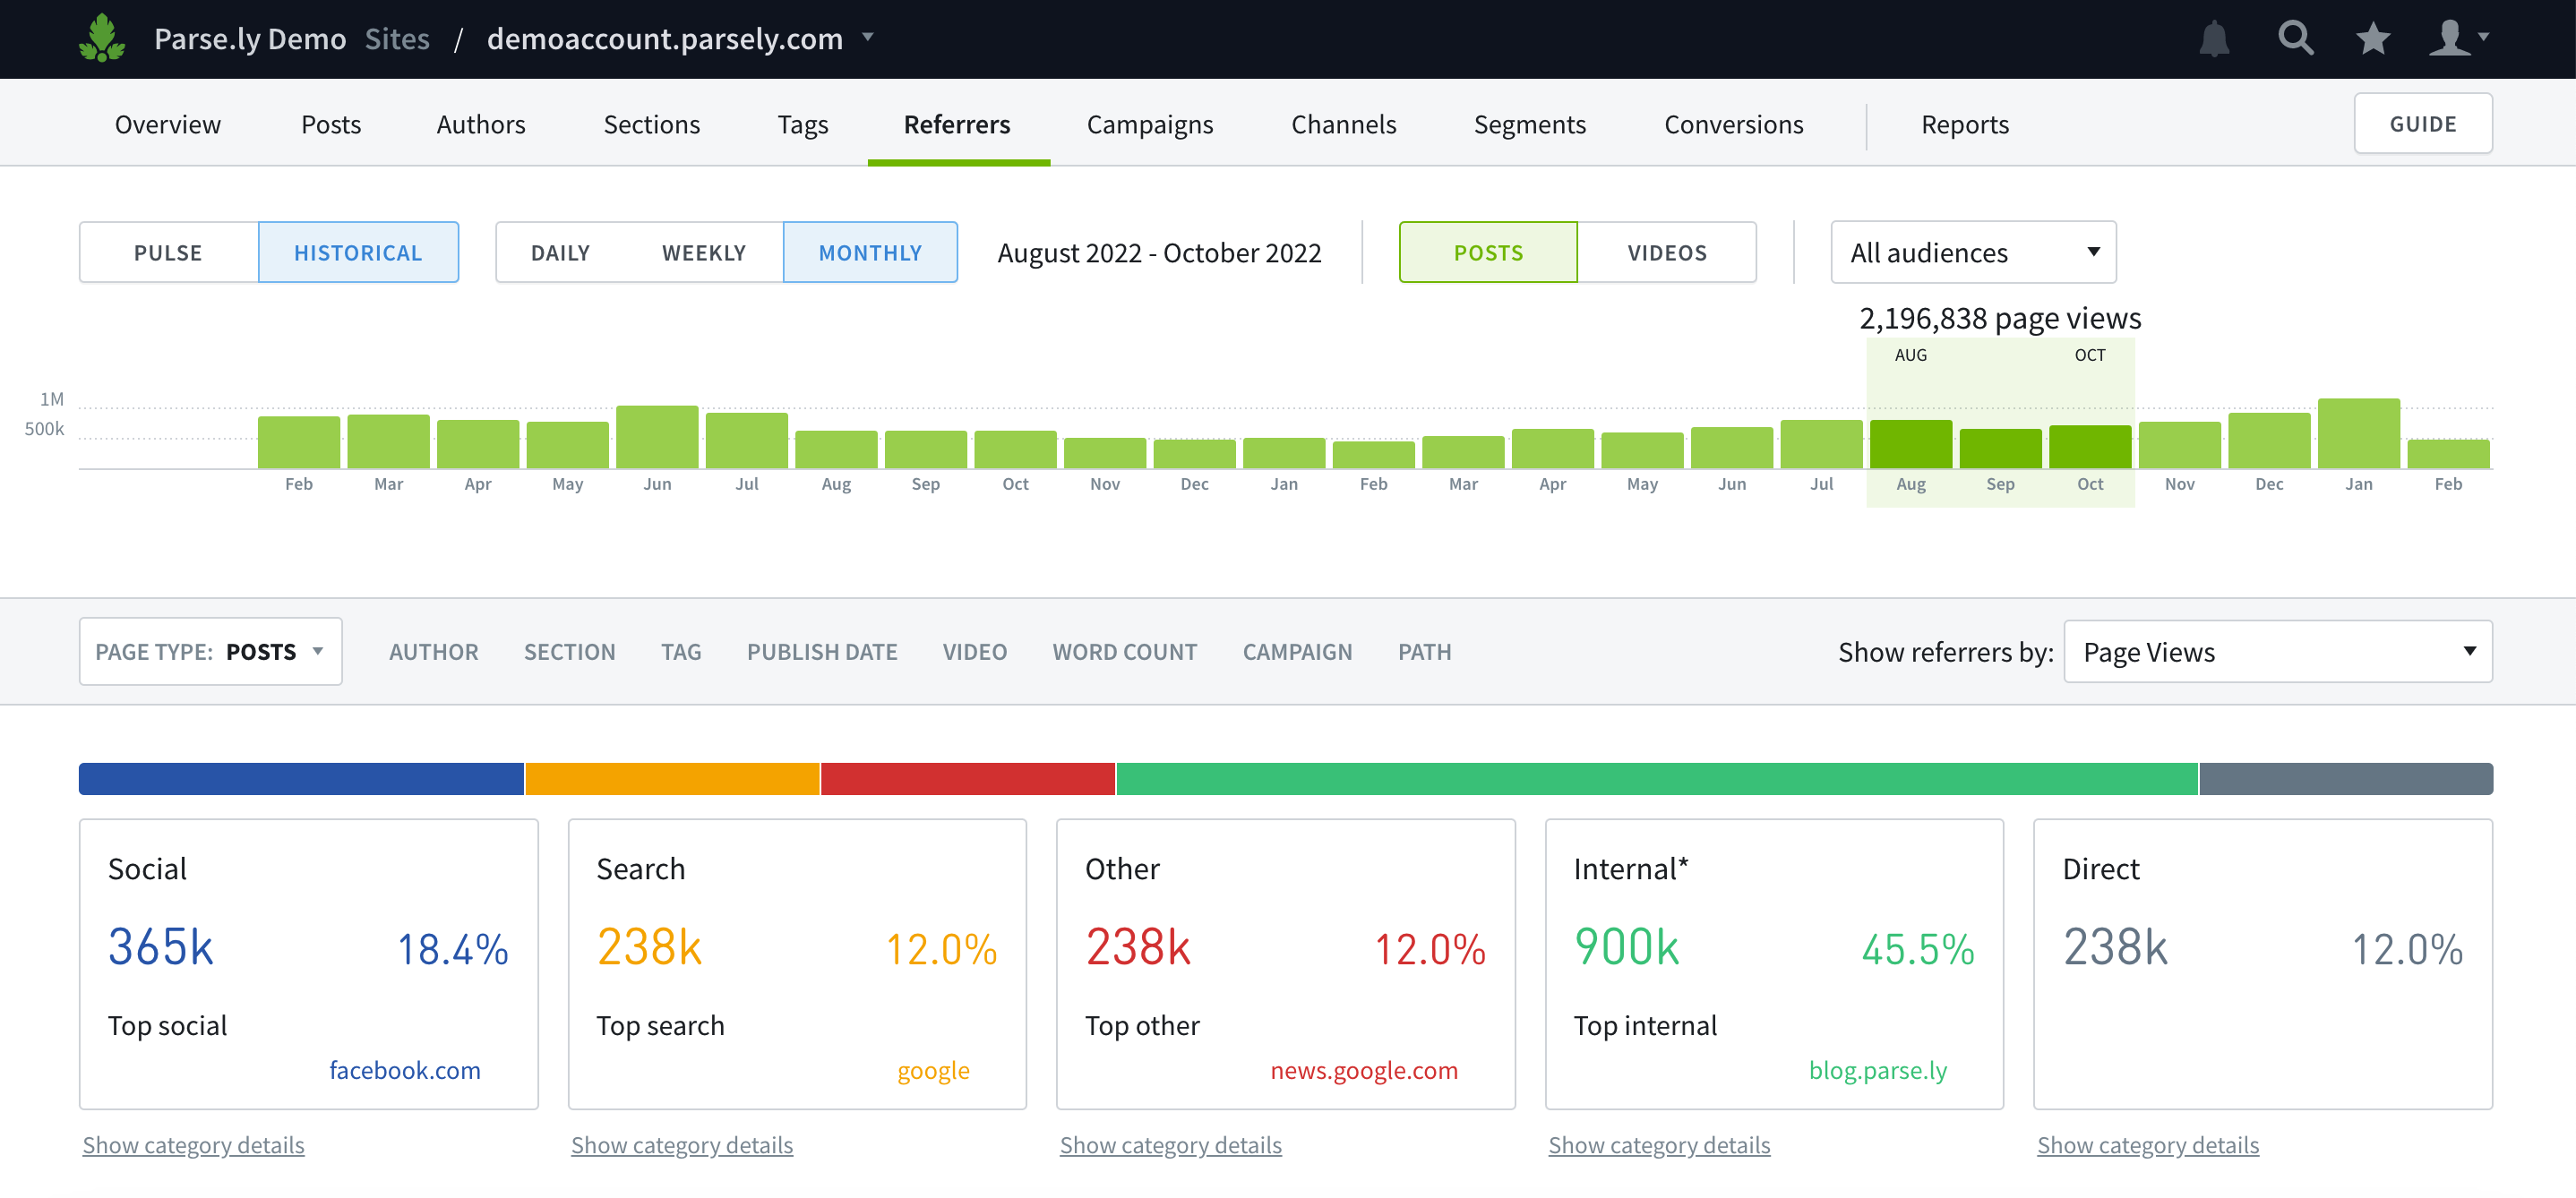
Let’s say we filter our data to see referral traffic sources over the last quarter and learn that we’re getting 18% of our traffic from social media, with our largest engagement from Facebook. We’re getting engagement through other channels, but not as much as we are through social.
Since we’re interested in driving an organic strategy and lowering our customer acquisition costs, we’ll remove the “cheat codes”—our paid social ads and campaigns through our corporate handles.
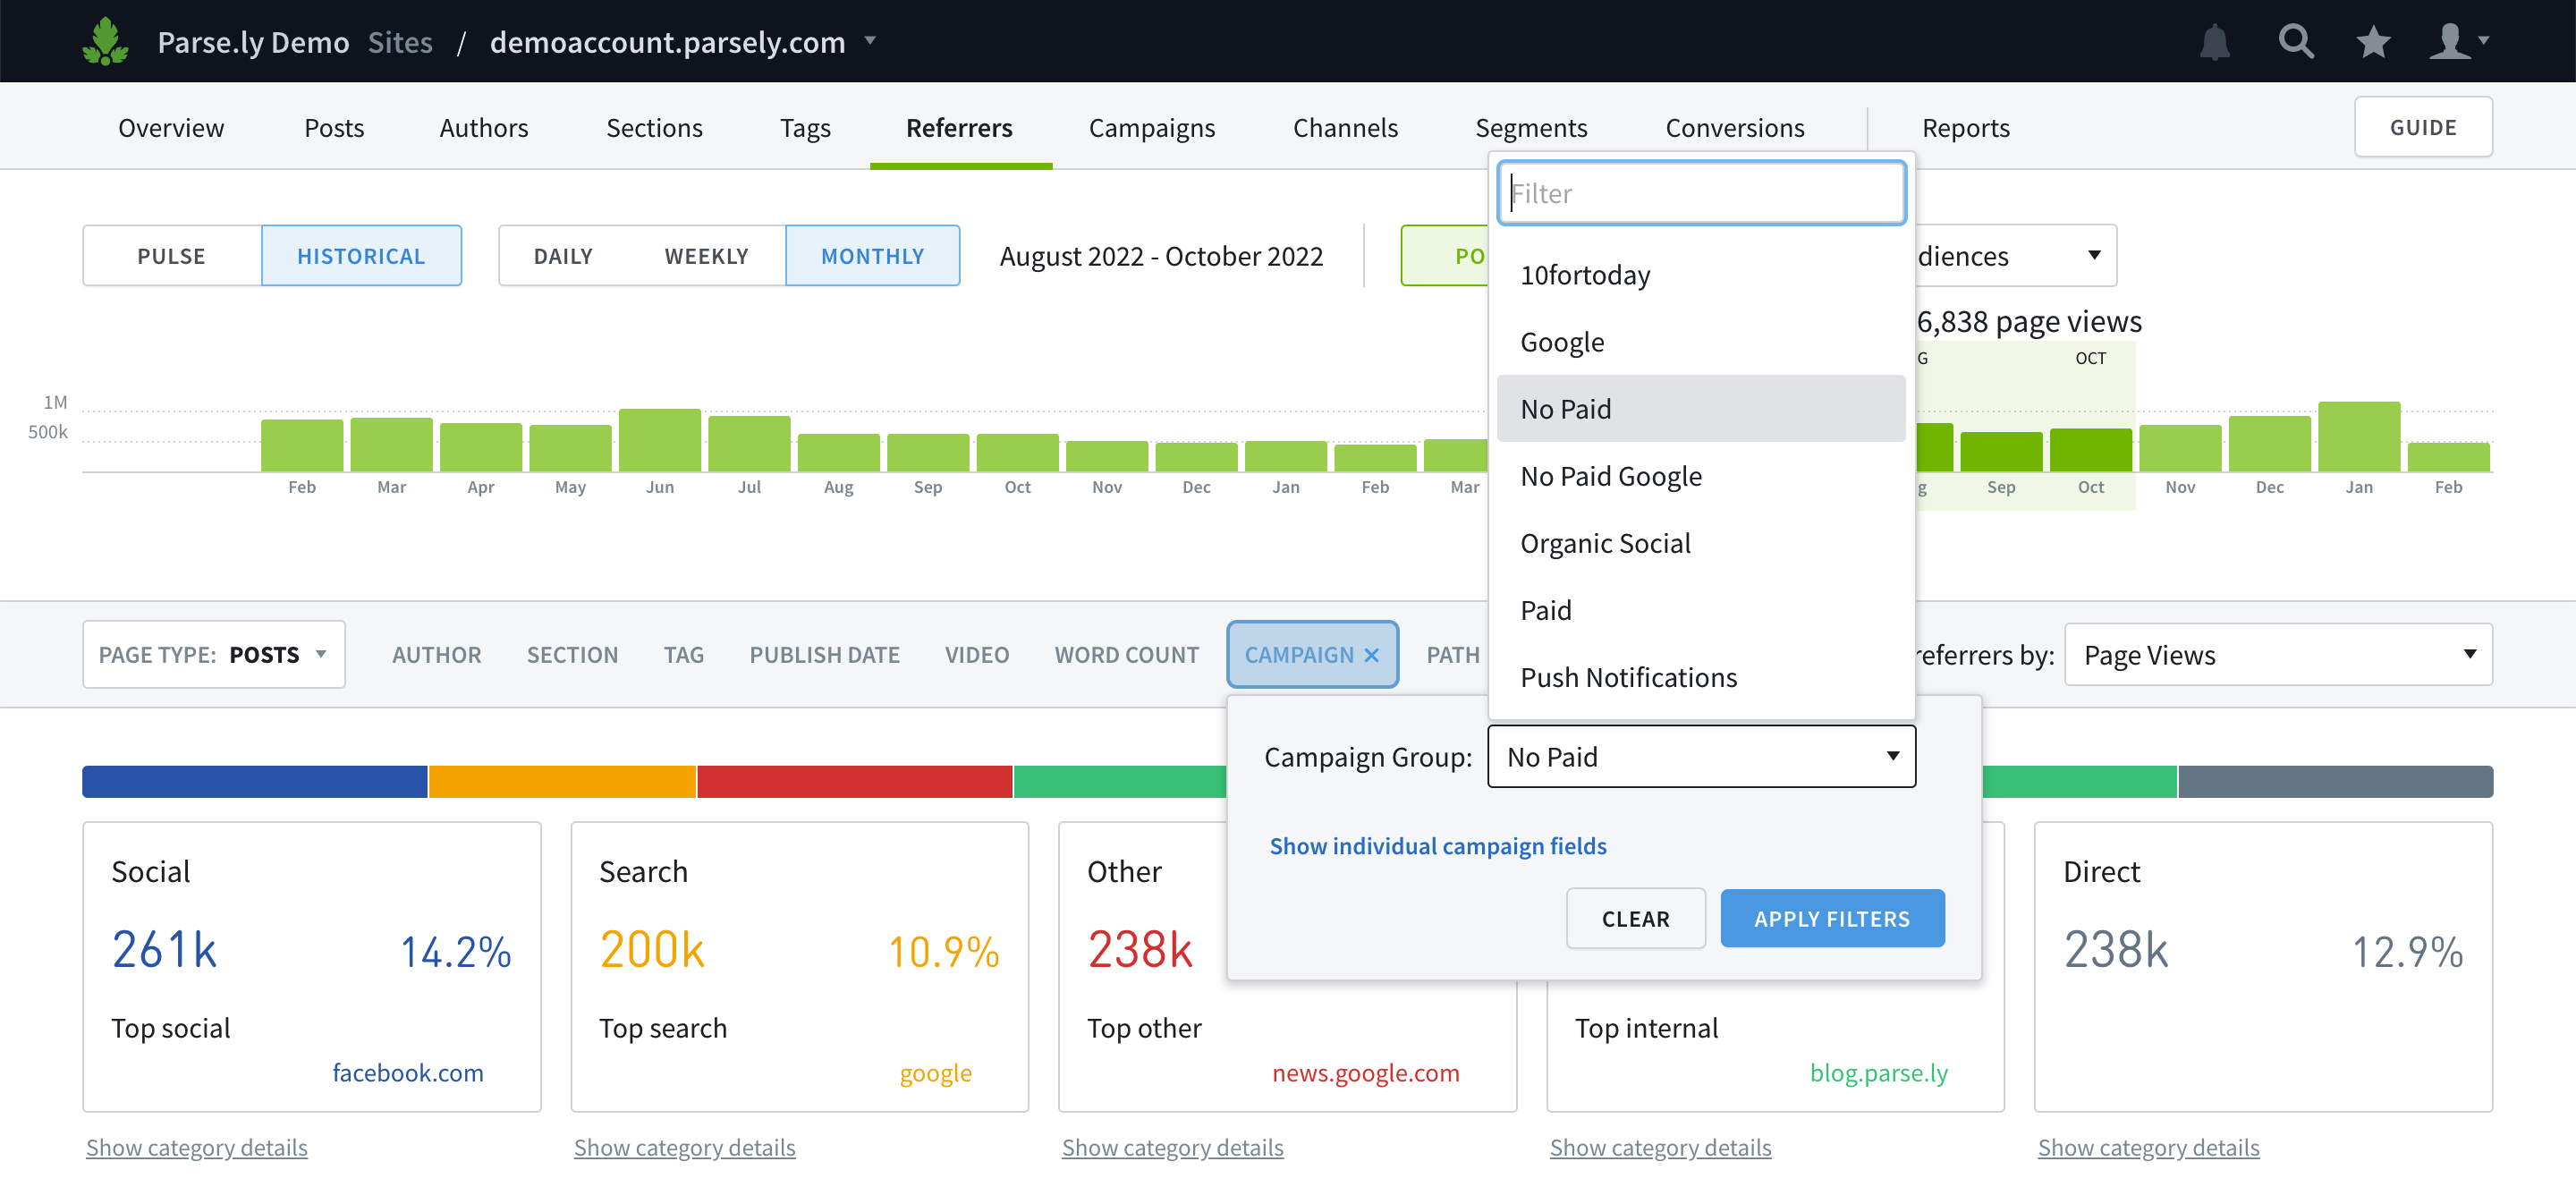
This lowers our percentage of social media referral traffic from 18% to 14%, giving us an organic baseline from which to work. Next, we’ll set up a way to monitor success.
Assessing success using real-time data
We care about driving organic social media traffic, so we want our analytics dashboard to float organic metrics to the top for us to consider.
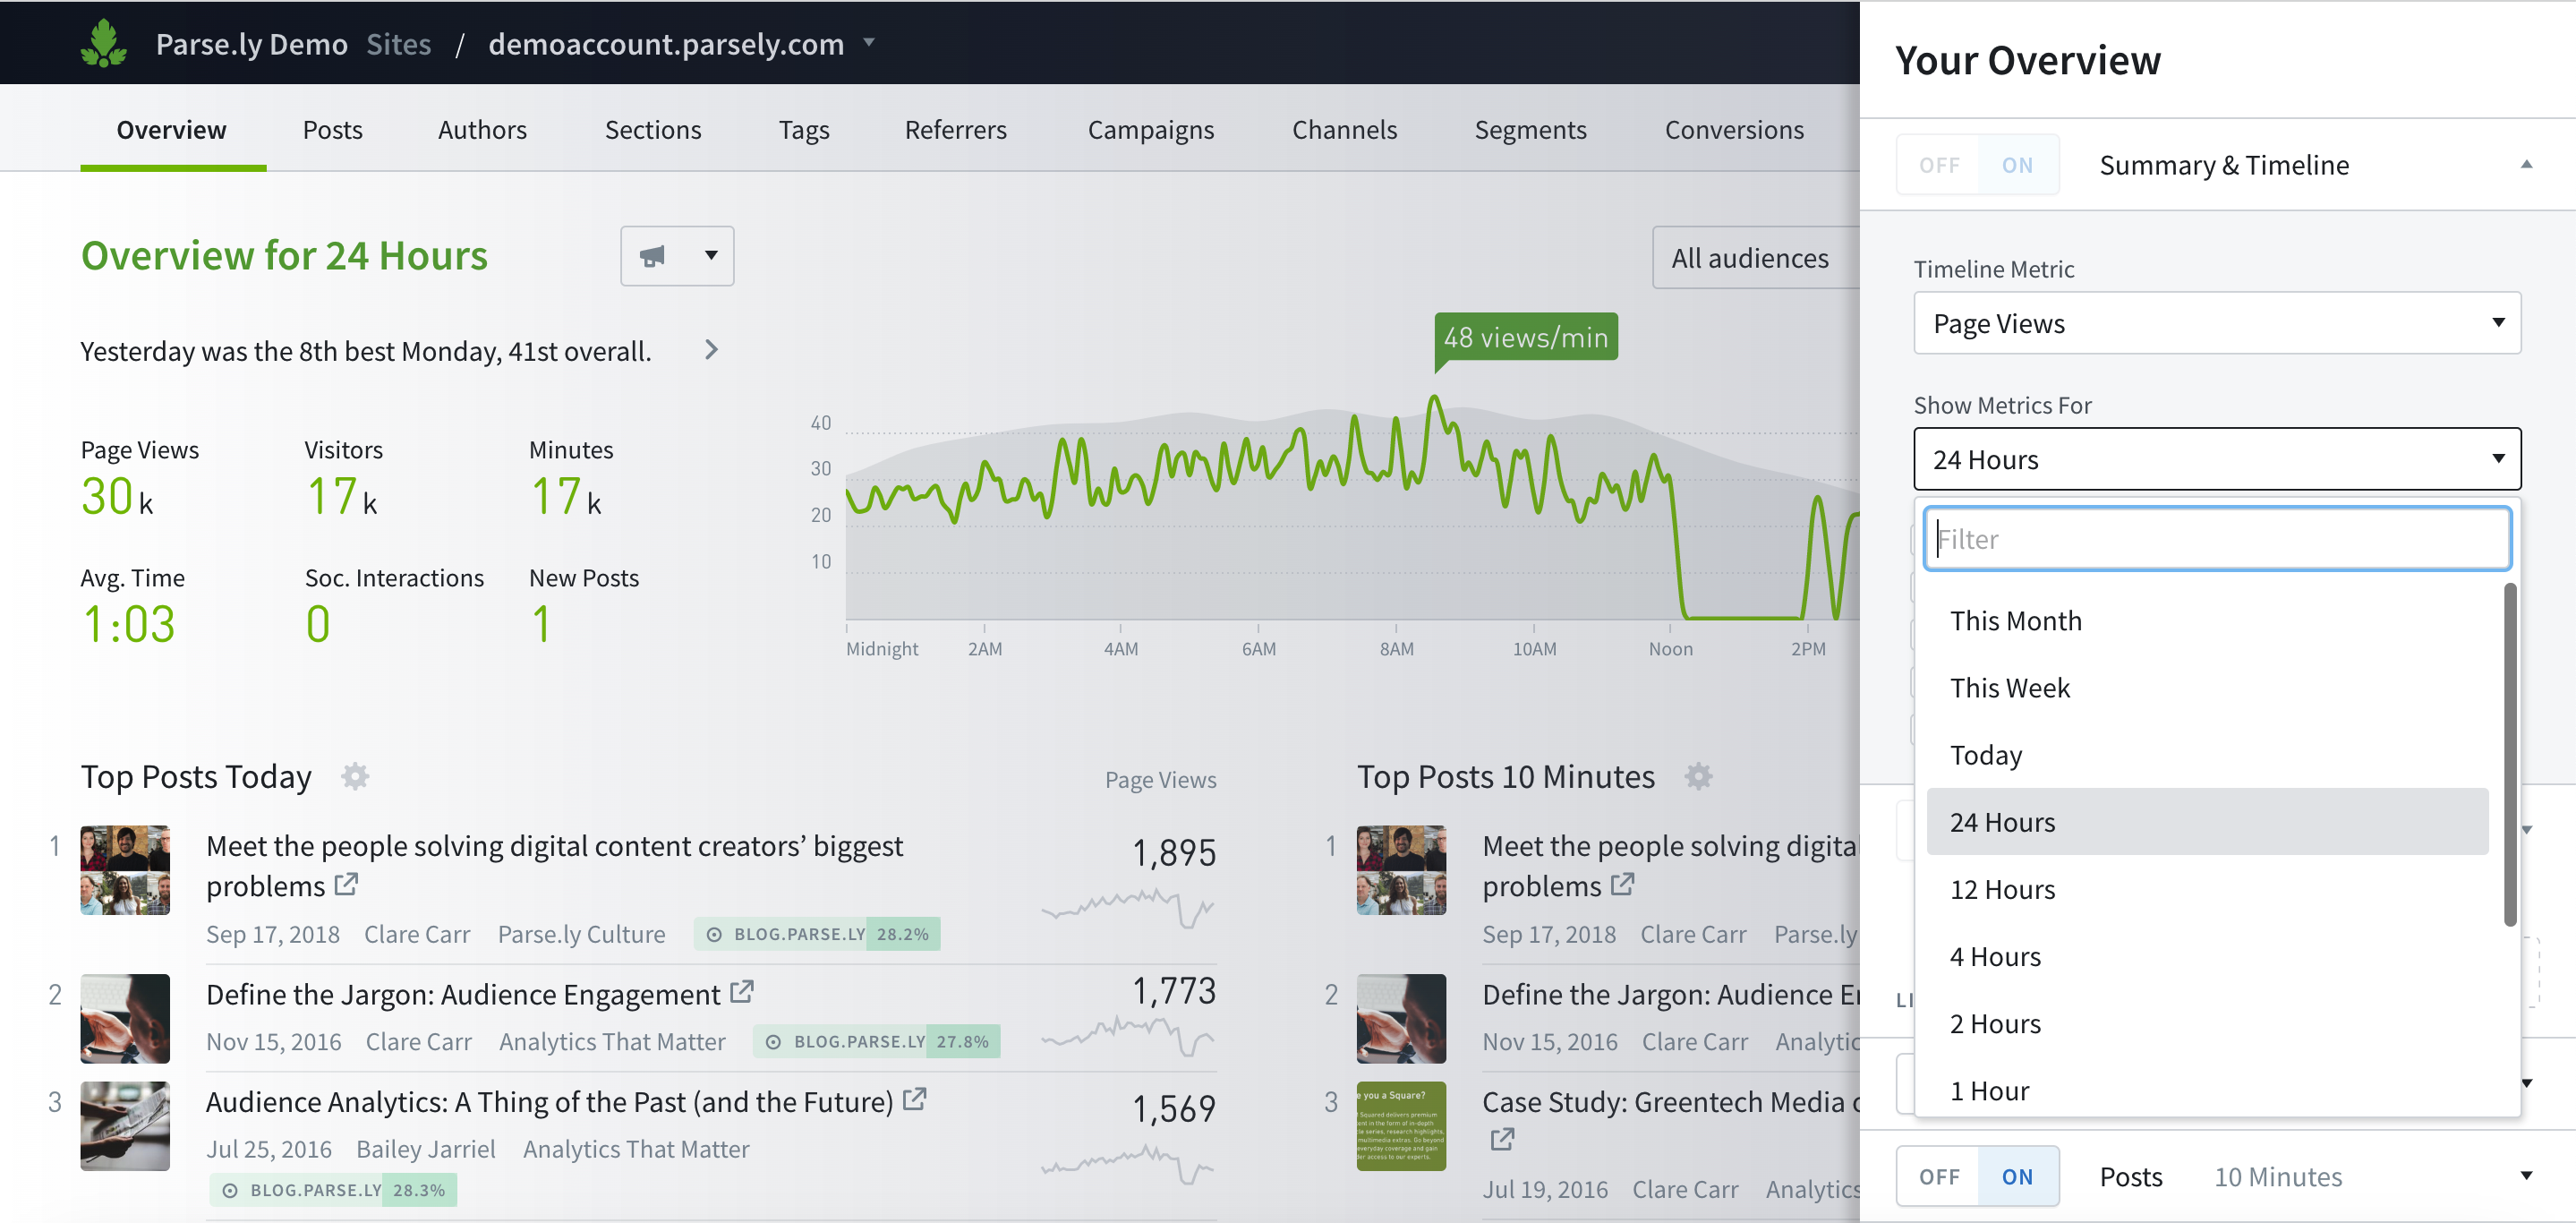
We can use our Parse.ly dashboard to monitor what’s working and not working in real-time over a longer timeline or a shorter timeline, even down to the minute (which we’ll see later).
Our dashboard is currently set to monitor data over a longer timeline, but we’ll shift it to show aggregates throughout the day. This helps us understand when our audience is most likely to interact with our content. We can also monitor which topics are doing well based on our keyword topics, or the actual content pieces that are driving engagement. We can even monitor social interactions, such as tweets or Facebook likes and comments.
We’ll monitor Social Referrals first to help us understand where people are coming from in the last five minutes. Are there any spikes?
The Parse.ly dashboard updates every five seconds to give us a real-time understanding of how people are engaging with our filtered metrics. We can even be alerted to posts that are going really well and take a closer look at what’s driving engagement.
For example, as traffic from Twitter bubbles to the top, we can dive in and investigate if the spike is coming from our own social handle or an organic source. Turns out it’s coming from an older, evergreen piece of content giving us the traffic uptick. To amplify engagement, we can tweet out this article and monitor results.
The goal is to learn about our audience’s typical consumption patterns and traffic trends so we can align our posting accordingly. For instance, if engagement is up at 1:00 p.m., we can ready our most popular content for 12:00 noon across our social channels then monitor the results. We can experiment with different voices, formats, headlines, etc., to maximize our audience engagement.
This helps us dial into which content works best for certain times and channels.
Analyzing topic performance in real time
During Neil’s time as the Head of Journalism at S & P, one of his go-to tactics was using the Tags dashboard in Parse.ly. His team covered news for Mergers and Acquisitions, which could include as many as three to four different daily deal announcements. The bulk of their content was published in the morning.
After publishing content, Neil would go to the Tags section of the Parse.ly dashboard to see a list of all of the topics his team was covering and how they were performing. There he looked at 30 minutes of data to track real-time engagement. For the next 30 minutes, he looked at how each topic was performing, paying particular attention to the ones that were spiking.
For example, he created tags for the industries Telecommunications and Banking, placing them into tag groups under the label Mergers and Acquisitions. He then compared tags in real time to see which topics were resonating most with his readers.
This informed his team’s follow-up coverage throughout the day. If, for instance, there were two major deals announced, but his team didn’t have enough bandwidth to cover both in-depth, they looked at the data to see which content was driving the most traffic and engagement, helping prioritize their efforts.
The real-time capabilities of the Parse.ly dashboard let Neil and his team monitor what topics and content were resonating most with their audiences in the moment, then use that insight to more effectively direct their resources.
Using real-time data to curate your homepage
Real-time data is also useful for curating an engaging homepage. Traditionally, editors chose which articles are placed above the fold while marketers lobby for their own preferred content.
But how do you take a smarter, data-driven approach, one that doesn’t rely on playing favorites or using gut feel? Use the Parse.ly API plugin to see your homepage with an overlay that shows real-time engagement, including metrics such as clicks per minute.
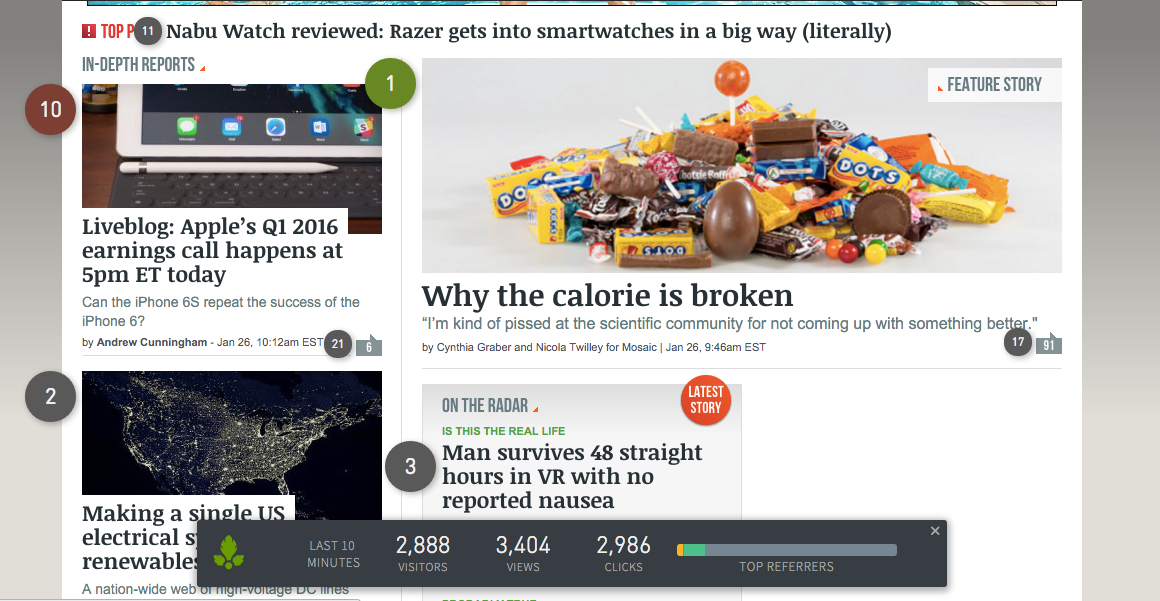
If your top slots don’t have the highest clicks per minute, you can remove or replace them with higher performing content. The percentage change in clicks can be compared to the historical performance of this slot or to another parameter.
Five steps to effective real-time data analysis
Real-time data analysis can be boiled down to five steps:
- Set up a baseline and benchmark. Focus on organic metrics and remove cheat codes by setting up UTM parameters.
- Create a hypothesis. Note that taking action will require trial and error as audience interests vary over time.
- Set up a way to observe and stress test your hypothesis. Parse.ly makes this easy through an intuitive dashboard, providing several ways to track real-time performance, even down to the minute.
- Compare real-time data to the baseline. Be honest about what’s working will help personalize experiences for readers and attract them to your content.
- Make changes. Stay agile and adapt where needed.
Want to learn more about Parse.ly and our platform’s real-time tracking capabilities?