Google Analytics (GA) is the baseline in website traffic monitoring tools. It’s estimated that nearly 70% of the top 10,000 sites on the web use it, as do 55% of the top one million sites.
But while GA is wildly popular (and free), it definitely has its limitations. Fortunately, there’s an expanding ecosystem of tools that supplement GA to give digital marketers much richer, actionable insights into what’s happening online.
 Three tools in particular—Pave AI, Klipfolio, and Rouguelytics—are worth a closer look for the capabilities they provide. Each serves a different function, so depending on your specific needs, it may be worthwhile investing in one, two, or even all three of these tools.
Briefly, PavaAI uses artificial intelligence and machine learning algorithms to find patterns in GA data that human analysis will likely miss. Klipfolio displays GA data in graphical dashboards, and enables you to integrate that information with a social networks, ad platforms, marketing automation systems, and other data sources. Roguelytics shows you how visitors are engaging with your content in real time, and how they move through your site.
All three tools offer a free trial period so you can evaluate them without risk or commitment.
 The Pave AI algorithm looks at 16+ million possible combinations of metrics within Google Analytics to identify the most important insights across all marketing channels, and offers data-driven recommendations to improve digital marketing results. It also connects to Google AdWords, Facebook Ads, and Twitter Ads, as well as several popular ecommerce platforms, so that data can be integrated into the analysis as well.
The initial setup is quick and intuitive, as shown, though it’s a bit tricky if you manage multiple GA accounts under one email address. Oddly, it doesn’t include LinkedIn ads. It also unfortunately requires entering a credit card even just for trial use, an uncommon practice. These are minor quibbles though, kinks the company will hopefully iron out soon.
 Once setup is complete, you can run your first report. This generally takes 20-30 minutes to run.
The completed report, attractively and professoinally formatted, graphically displays some basic GA measures at the top: visitors overview and engagement, with change from the previous month; top channels driving website traffic; and conversion highlights.
Where it gets interesting is in the correlations it surfaces. It’s difficult to give relevant examples because there are literally millions of possible correlations, and which ones the algorithm surfaces will be unique to your website.
But on one website I tested, the tool noted an unusual spike in conversion traffic over a three-day period, and tied these conversions back to traffic sources. The report displayed engagement by hours and days; not surprisingly, the most active time correlated with the site’s new blog post publishing schedule. It noted that “visitors from Google and Twitter spent 1.3x more time than the average visitor and made up 47.12% of total sessions.” And it helpfully suggested, “Visitors from Google spent 5.2x more time when they are returning. Retarget these users to bring them back to the site.”
There are 26 pages of charts, correlations, and recommendations. Some are coincidental or hardly surprising, but many are interesting and are the types of data combinations a human analyst would be unlikely to find—certainly in just 20-30 minutes.
Pave AI is worth evaluating for any website that tracks conversion actions such as downloads, blog subscriptions, or online purchases.
Pricing: $39/$79/$179 per month; enterprise and custom agency pricing by quote
This is a dashboard creation tool that enables you to mash up data from a wide variety of sources into charts or “Klips” and manipulate the data in various ways.
Out of the box, many of the top-level measures are merely more visually appealing presentations of basic social media insights and GA metrics: number of followers by social network, traffic change by source month over month, top landing pages from organic search.
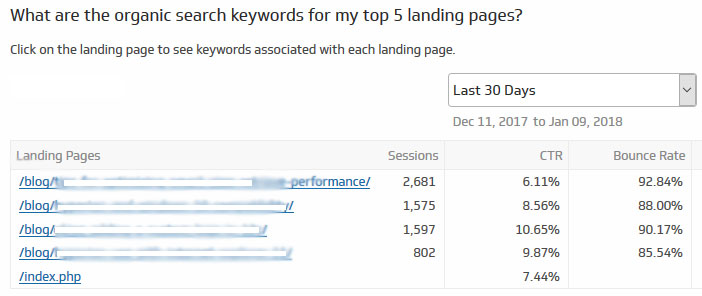 Even some of the basic Klips however go beyond standard GA metrics; for example, Klipfolio displays the top keywords driving traffic by landing page, and organic search keywords for the top five landing pages.
But the real power of Klipfolio is the incredible number of data sources that can be connected and manipulated. Dashboards can incorporate information not just from GA and social networks but also more than 100 other sources including Act-On, AWeber, BaseCamp, Base CRM, Eventbrite, HubSpot, MailChimp, SEMrush, and more.
You can create your own Klips with the editor, customize charts and visualizations, aggregate and sort data, even apply formulas. But that all takes time and experimentation; the downside of Klipfolio’s sophistication is that it’s difficult to give it a fair shot in just two weeks. The more effort an analyst puts into this tool, the more benefit can be derived from it.
Setup is fairly easy, but don’t make mistakes because it’s really hard to undo anything. Add the wrong Google account? Didn’t mean to add that Klip? There’s no obvious way to undo actions. Initial connection errors can also be frustrating, though closing out and retrying seems to fix most errors fairly quickly.
Klipfolio is a powerful analytics and dashboard creation tool, but it requires a significant investment of time and trial to really get the full benefits of the system.
Pricing: four levels – $29/$49/$99/$199 per month
While PaveAI and Klipfolio excel at providing a comprehensive overview and analysis of your digital marketing data, Roguelytics really shines at a much more granular level.
Though it provides a graphical display of GA metrics like top pages viewed, top sites referring traffic, and visitors by country, that’s not why you’d use this tool (PaveAI and Klipfolio show the same measures more elegantly).
 The value Roguelytics uniquely offers is real-time visitor visibility. Once you’ve installed the tracking code on your site (or installed the simple-to-use WordPress plugin) and logged into your Roguelytics account, you’ll see a small elephant at the upper-right of the screen. Clicking the elephant opens and covers the right half of your screen with the real-time analytics summary specifically for that page.
There are no obvious glitches or shortcomings in this tool. It’s easy to set up and intuitive to interpret. There is a caveat, however: it’s most valuable on relatively high-traffic sites. Websites with 10,000 or fewer visits per month may not generate enough real-time visitor data to really provide value. It’s worth evaluating in any case, but will be most valuable to sites with periods of high traffic flow.
Pricing: free; $25/$75 per month; enterprise pricing by quote
PaveAI finds correlations amid GA and online advertising data and makes action recommendations based it’s machine-generated analysis. Klipfolio enables you to combine data from GA plus more than 100 other sources to build sophisticated analytical dashboards. Roguelytics provides real-time insights into on-page user actions.
Any of these will tell you more than what GA supplies on its own. All are worth a closer look for digital marketing professionals.
