
Your marketing automation platform houses crucial marketing data that drives your business. But what good is all that data if you can’t view and parse it in the formats and reports that make sense to you and your team? That’s where marketing analytics software comes in.
Most of the major marketing automation platforms have some form of analytics built into the user experience. Act-On is excited to announce that we’ve just made a major update of our marketing analytics functionality, including a new AI search that lets you ask data questions in natural language.
Whatever software you use, gathering the right insights is key to improving performance. But often those key insights lie deeper than what’s provided by standard performance reports (e.g., email send reports, landing page visitor reports). That’s where a true analytics engine is required, to enable you to dive deep into your data, segment according to your business needs, and bring in custom data.
Let’s go through some use cases for marketing analytics software. What reports should you be looking at regularly to get the most out of your automation stack?

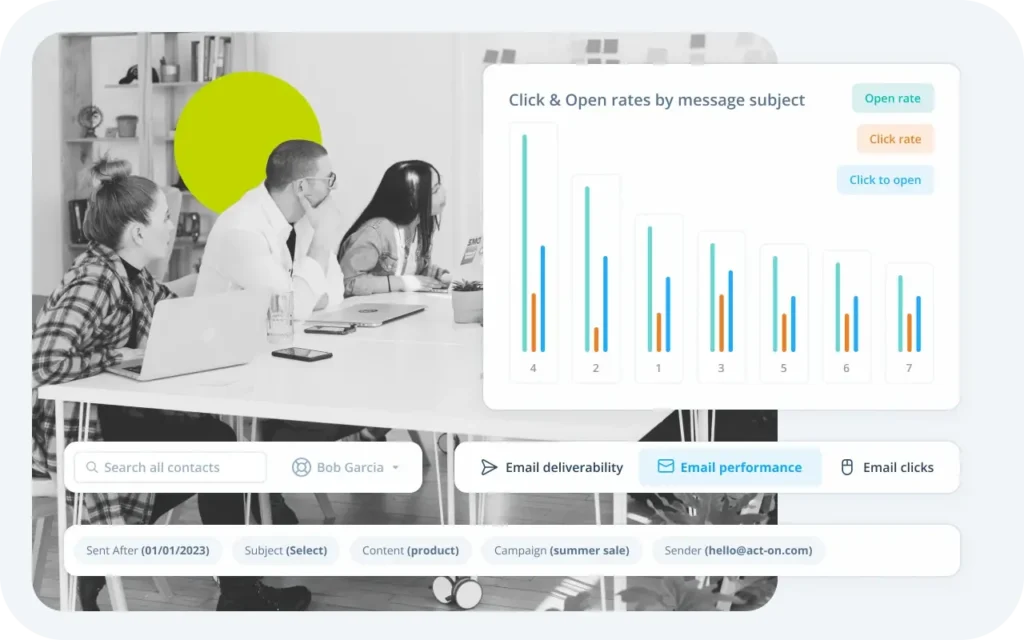
View side-by-side email results to spot trends and anomalies
Results for one email are handy. Results for multiple emails are a force multiplier for marketing strategy. Visualizing metrics like click and open rates across a range of emails helps you spot trends and potential outliers in your marketing programs.
Perhaps a certain category of email always seems to get higher engagement. Or maybe a certain subject line format is having outsized impact compared to others. These are the types of observations that can lead to new standards and processes across your team that you wouldn’t have come up with otherwise.
Every audience is unique. Now analyze email, content, and subject line performance per unique audiences. Then segment audiences by company size, geo, or industry. Applying this more advanced analysis across your email results is how you get to know your audience better than anyone else.
Track daily form activity to draw conclusions about audience behavior
Monitoring daily form activity is like having a pulse on your audience’s behavior. By tracking how your audience interacts with your forms on a day-to-day basis, you gain valuable insights that can shape your marketing strategy.
Are certain days of the week more popular for form submissions? Do certain forms consistently perform better than others? Are there trends in the timing of form submissions that coincide with specific marketing campaigns or events? These are the types of questions you can answer with reports on daily form activity
Understanding these patterns can help you optimize your marketing efforts. For instance, if you notice that your forms receive more submissions on Fridays, you might consider launching targeted weekend campaigns. Or if you find that certain forms have a higher abandonment rate, you can fine-tune them to improve conversion rates.
Easily spot deliverability failures in customizable charts
Deliverability is the lifeblood of your email marketing campaigns. With customizable charts, you can easily keep a close eye on deliverability and take swift action when issues arise. Drill into key deliverability metrics such as bounce rates, spam complaints, and email opens in real-time.
Keeping your finger on the pulse of deliverability means you can spot failures and warning signs as soon as they develop, rather than waiting until your sender reputation takes a dive. Are you working with outdated email lists or technical issues? What’s causing that spike in bounce rates?
By monitoring deliverability in real-time with customizable charts that suit your specific needs, you can maintain a healthy sender reputation and ensure that your emails consistently reach the inboxes of your audience.
Understand suppression practices behind your recent email sends
Nearly every marketing automation program uses suppression filtering to prevent emails from going to customers, active sales, or any group that is not appropriate for the given email program. Maybe it’s an issue with the recipient’s domain, or too many hard or soft bounces at the address. Maybe someone on your team has added certain emails to a manual suppression list. Whatever the reason, understanding these trends with suppression can clue you into deliverability issues before they become major problems.
Did a certain email or specific nurture program have more bounces or failed deliveries than others? Maybe it’s time to audit that list for deliverability and make sure there’s not a deeper issue.
Maybe you’ve been beating up a list with too many repeated sends, triggering suppression rules for that nurture program. That could be a sign that you need to stop sending so aggressively to that list, or risk being reported as SPAM by recipients who could otherwise be prospective customers.
Go beyond click rates and dive into behavior paths and CTA performance
While click rates are a valuable metric, they only scratch the surface of understanding your audience’s engagement. To truly optimize your marketing strategy, it’s essential to dive deeper and explore more nuanced behavior paths.
What calls to action (CTAs) have been most enticing to your audience in recent weeks and months? Behavior paths provide a comprehensive view of how recipients navigate through your emails, interact with forms, and peruse your website. Are they following the desired path, or are there drop-offs at certain stages? Understanding behavior paths allows you to identify bottlenecks and optimize the user journey.
Are certain CTAs driving more conversions, while others go unnoticed? By identifying high-performing CTAs, you can replicate their success in future campaigns. This data-driven approach enables you to create more effective and compelling email campaigns that resonate with your audience on a deeper level.
Use smart filters to zero in on specific groups of emails or dates
Navigating through vast amounts of email data can be overwhelming. Smart filters are like a compass to guide you through. Imagine you want to compare the performance of your email campaigns during different days, months, or key events. Smart filters enable you to quickly isolate the data for those specific timeframes. Are your summer campaigns more successful than your winter ones? Smart filters help you find out.
Likewise, you can use smart filters to segment your email campaigns by audience demographics, geographic locations, or other criteria. This level of granularity empowers you to tailor your marketing strategies for different audience segments and optimize your campaigns accordingly.
Whether you need to analyze specific campaigns, date ranges, or audience segments, smart filters simplify the process and enhance the precision of your marketing analytics.
AI to the rescue! Ask natural language questions to form hypotheses and test assumptions
One of the hardest things about data analysis is knowing which questions to ask. You know you have the right data to draw conclusions…you’re just not sure what you’re looking for yet.
This is where things get really exciting. The most cutting edge marketing automation platforms will allow you to ask natural language questions. Start with something simple and build on it. Which of my emails are performing best? Are my top 20 performing emails getting similar results for open rates and click through rates? Which of my emails have high open rates but low click through rates?
Before you know it, you’ve gone down the data rabbit hole and found a way to drive more engagement from your content. AI gives marketing automation the power to field these kinds of open-ended questions and serve up useful data and charts to move you from confusion to clarity.

Create custom dashboards and share reports to strategize as a team
Collaboration is the cornerstone of a successful marketing team. The best marketing analytics platforms let you create custom dashboards and share reports to facilitate seamless communication.
Pinning reports to your marketing analytics platform is like placing essential information on a bulletin board for easy reference. You can highlight key insights, top-performing campaigns, or critical trends that demand attention. This ensures that your team is always on the same page and aware of the most important data points.
Moreover, the ability to create dashboards and share reports fosters open communication, encourages data-driven decision-making, and empowers your team to collectively strategize for better outcomes. It ensures that everyone has access to the information they need to make informed choices and drive the success of your marketing campaigns.
No Need for Separate Marketing Analytics Software with Act-On Marketing Automation
As you read through this list, maybe you were nodding along enthusiastically, recognizing all the rich reporting options that your marketing automation platform gives you.
Or maybe you were stuck in a serious case of marketing FOMO, lamenting the lack of options at your disposal. If your marketing automation solution doesn’t do this for you, or is too difficult for the marketing team to fully utilize, maybe you should give Act-On a try. All of the use cases above are available with our advanced analytics capabilities.