
Google Search is a digital giant.
But how big is it, exactly? What should you know about its search users’ habits? And how is the platform adapting to recent advancements in AI?
Let’s dive into the latest Google Search statistics to find out.
Google Statistics Highlights
- There are 5.9 million Google searches per minute
- Top-ranking Google search results see a 22.4% click-through rate
- 63% of Google searches occur on mobile in the U.S.
- Google accounts for 91.54% of the global search engine market
- 66% of web traffic referrals come from Google
- Most Google searches are three to four words long
- Featured snippets appear twice as often on desktop as on mobile
- 46% of Google searches have local intent
- Google’s Shopping Graph has over 35 billion product listings
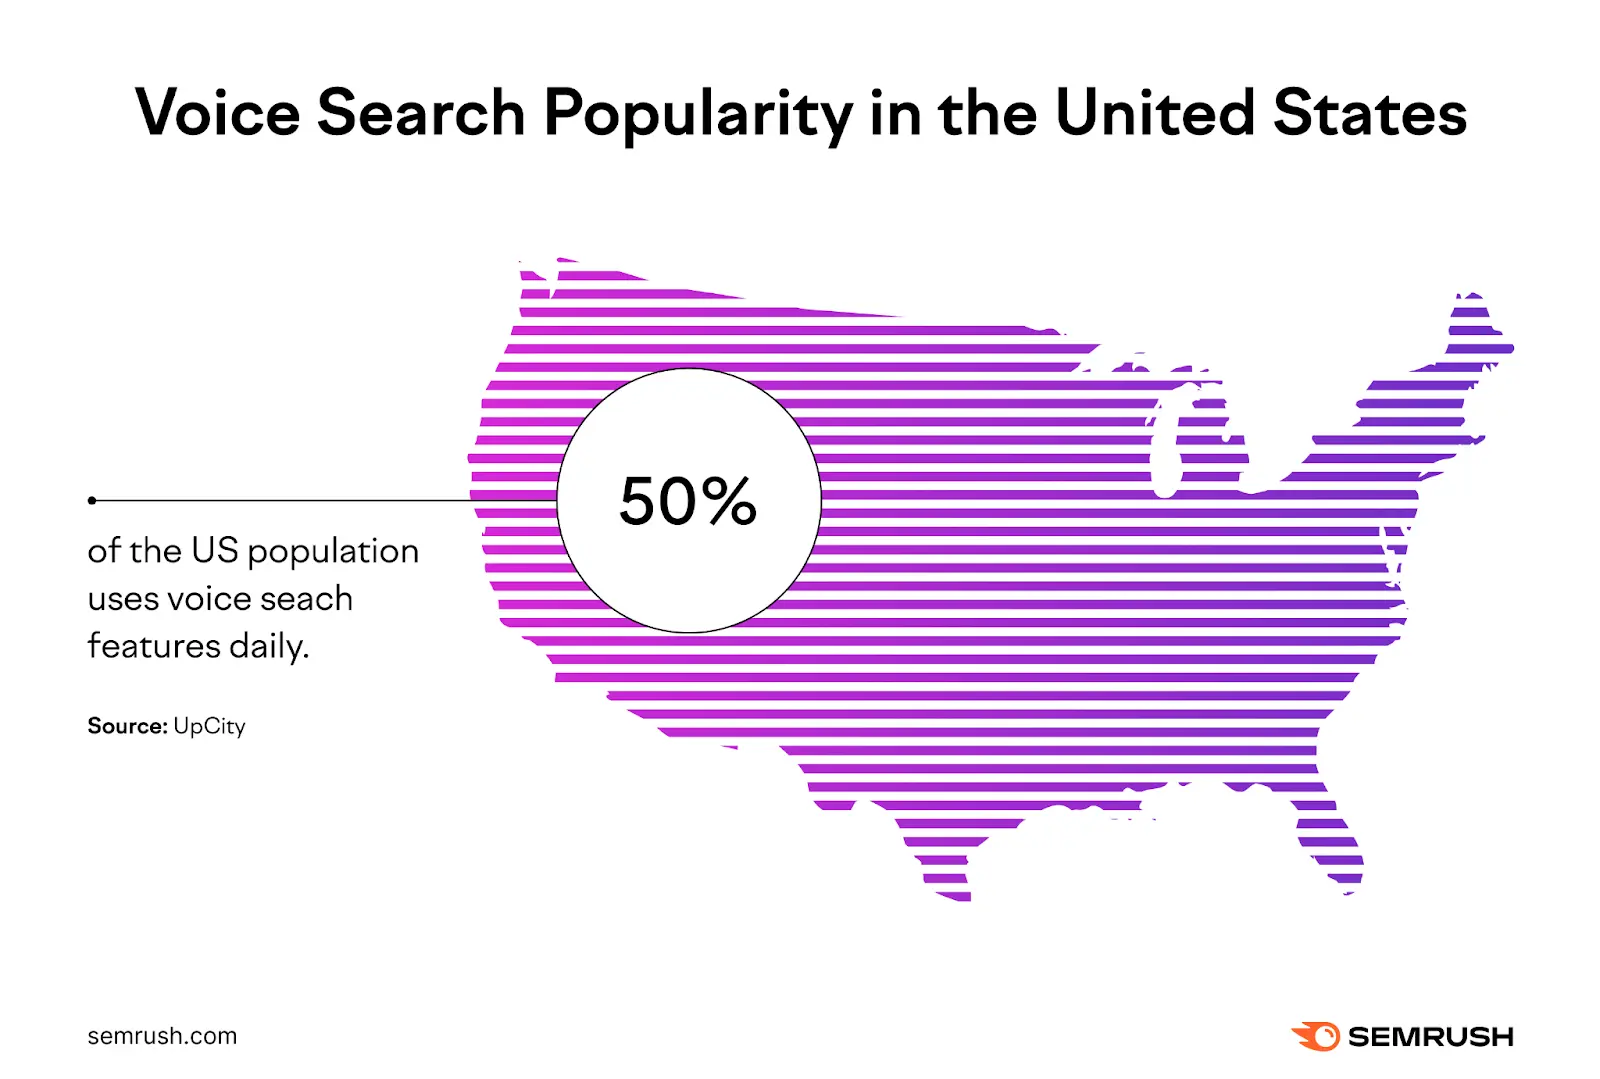
- 50% of the U.S. population uses voice-enabled search each day
General Google Search Statistics
1. Google Processes 5.9 Million Searches Every Minute
To put this figure into perspective, 5.9 million searches per minute is roughly 8.5 billion searches per day. Or 3.1 trillion searches per year.
2. Top-Ranking Organic Search Results See a 22.4% Click-Through Rate
Anyone familiar with SEO already understands the value of achieving a high position in Google’s search engine results pages (SERPs).
And the stats speak for themselves. On mobile, the average click-through rate (CTR) is 22.4% for position 1, 13% for position 2, and 10% for position 3. Meanwhile, position 10 gets you just 2.3% of clicks.

3. Google’s Search Index Is Over 100,000,000 GB in Size
Every time you perform a search, Google scours hundreds of billions of webpages stored in its index to surface relevant results.
This index is built through Google’s web crawlers, which systematically move from webpage to webpage via links. And make records of what they find.
And since content on the web is always changing, Google’s crawlers are constantly at work to ensure the data in its index stays up to date.
4. 63% of Searches Occur on Mobile Devices in the U.S.
Desktop devices no longer account for the majority of searches. And Google has updated its systems accordingly.
In October 2023, Google confirmed that its switch to mobile-first indexing was finally complete. In other words, Google now crawls and indexes pages from the perspective of a mobile browser.
This means mobile webpages must be optimized to perform well in search results.
5. 27.03% of Google’s Desktop Traffic Comes from the U.S.
The U.S. accounts for the most Google visits of any country.
India is in second place, accounting for 4.46% of visits. And Brazil comes in third, at 4.41%.

6. The World’s Most Googled Terms in 2022 Were ‘YouTube’ and ‘Facebook’
For actual Google searches, statistics show the term “YouTube” received almost 400 million monthly searches—over 3.1 billion searches during 2022.
Meanwhile, “Facebook” received 322 million monthly searches.
7. 15% of Daily Google Searches Are Brand New
A significant proportion of Google’s trillions of annual searches have never been searched before.
This is one of the main reasons Google continually works to improve its systems to ensure users receive helpful answers to their queries from a wide range of quality sources.
8. Google’s Autocomplete Feature Reduces Typing by 25%
Google estimates this reduction saves the world over 200 years of typing time per day.
That means humanity has won back close to 1.4 million years of typing since the autocomplete feature first launched in 2004.
Google’s Search Engine Dominance Statistics
9. Google Accounts for 91.54% of the Global Search Engine Market
Google Search is the undisputed world champion of search engines. Its closest competitor, Bing, has a 3.19% global search engine market share.

More specifically, Google claims 82.74% of the desktop search engine market and a staggering 95.16% market share on mobile.
(StatCounter Global Stats, 2023)
10. Google’s Search Engine Market Share in North America Is 89.08%
In Europe, this figure increases to 91.91%. It grows to 95.41% in South America. And it’s 97.53% in Africa.
(StatCounter Global Stats, 2023)
11. 66% of Web Traffic Referrals Originated from Google in 2019
Google is by far the leading provider of referral traffic to other websites.
Facebook is the second largest provider, accounting for 5.1% of referrals in 2019. YouTube (another Google property) also contributed 3.9% of web traffic referrals in 2019.
(Jumpshot via SparkToro, 2019)
12. Google Sites Receive 276 Million Unique Monthly Visitors in the U.S.
This makes it the most visited multi-platform web property in the U.S.
Microsoft comes in second, with 244 million visitors. And Facebook comes in third, with 237 million visitors.
13. Google Sites Made $191 Billion in Ad Revenue in 2022
Google properties like Google Search and YouTube generated almost $200 billion in ad revenue last year.
For perspective, that’s more than double the ad revenue they generated in 2018.
Desktop vs. Mobile Search Statistics
14. Most Google Search Queries Are 3 to 4 Words Long
In our Zero-Clicks Study, we found that 38.2% of U.S. Google searches on desktop contain three to four words. This figure was 39.9% for mobile searches.
And queries with one to two words account for 31.6% of searches on desktop and 31% of searches on mobile.

15. Users Take More Time to Make a Decision When Searching on Mobile
On desktop, about 45% of users’ decisions on what to do next occurs within five seconds of searching. On mobile, this figure drops to 33%.

This could be because mobile users have a smaller screen to work with, meaning they spend more time scrolling through Google’s results.
16. Users Reformulate Their Initial Searches More Frequently on Mobile
Google users often refine their initial searches when they don’t find what they expect in the search results.
On desktop, users change their queries 17.9% of the time. On mobile, they do it 29.3% of the time.
17. Desktop Searches Result in More Zero Clicks Than Mobile
On desktop, 25.6% of searches result in zero clicks. While on mobile, this only happens for 17.3% of searches.
This could be because desktop users are more likely than mobile users to encounter SERP features that answer their query directly (like a featured snippet).
18. Different SERP Features Appear More Frequently on Mobile vs. Desktop
Images appear 12.5 times more often in search results on mobile.
Meanwhile, featured snippets and Google Ads are twice as prevalent on desktop.

Consumer Behavior Search Statistics
19. 49% of Consumers Use Google to Find New Products
Many consumers habitually turn to Google when considering their next purchase, whether they plan on buying in-store or online.
In fact, 45% of shoppers use Google to research a purchase they intend to make in a physical store.
20. 50% of Online Shoppers Say Images Help Them Make a Purchase
Product listings, detailed specs, and reviews aren’t enough to convince customers to buy.
You need high-quality images and videos to truly showcase your products to online shoppers in a way that persuades them to buy.

21. Online Shoppers Click on 3D Images 50% More Than Static Ones
Google encourages merchants to make the most of its advanced 3D shopping capabilities.
But 3D shopping experiences are currently only available in the U.S. and are limited to shoes and home goods.
22. Google’s Shopping Graph Contains Over 35 Billion Product Listings
Google’s Shopping Graph is an AI-powered, real-time data set storing billions of product listings. And over 1.8 billion of those listings are refreshed every hour to give users the most up-to-date, reliable product results.
Local Google Search Statistics
23. 77% of Consumers Use Google When Looking for Local Business Information
This data on individuals from the U.S., France, Germany, and the U.K. shows people rely heavily on Google to discover information about businesses in their local area.
For this reason, businesses that maximize their online presence through local SEO stand to significantly increase local traffic, awareness, and sales.
24. 21% of People in the US Use the Internet to Find a Local Business Each Day
And a further 32% use it to research a local business multiple times per week.
This widespread use of Google to find local businesses underscores the need to optimize your local search presence.
25. Google Maps Searches for ‘Shopping Near Me’ Increased Globally by Over 100% in 2022
Google’s traditional search results aren’t the only way to discover information about local businesses.
Google Maps is also a go-to source for nearby business information.
Creating and optimizing your Google Business Profile (pictured below) will ensure your business is visible to local Google Maps users.

26. 78% of Holiday Shoppers Who Visited a Store Search Online Before Going
Appearing for relevant local searches is essential for attracting more customers to your brick-and-mortar store.
Having no online visibility could mean potential customers simply take their business elsewhere. If users can’t find basic information about your business online, it’s unlikely they’ll turn up at your door.
27. 60% of Smartphone Users Have Contacted a Business Directly Using Search Results
Mobile users don’t just use Google to research businesses but also to contact them directly (e.g., using click to call ad extensions).
Adding multiple contact options to your Google Business Profile and website makes life easier for potential customers. Which could lead to more inquiries, visits, and sales.
28. Local Business Searches on Mobile Increased 250% in 2019
Between April 2016 and March 2019, mobile searches for “store near me” more than doubled.
These searches included queries like “grocery store open near me” and “auto parts store open near me.”
Paid Search Statistics
29. Google Ads Deliver a 700% ROI
Google estimates that for every $1 an advertiser spends on Google Ads, they get $8 in profit through both search and ads.
30. Google Ads Have an Average Conversion Rate of 7.04% Across All Industries
The two business categories with the highest conversion rates are physicians and surgeons as well as animals and pets. Both have an average conversion rate exceeding 13%.
The lowest-performing category is apparel, with an average conversion rate of 1.57%.
31. The Most Expensive Google Ads Keyword in 2023 Cost Over $200 per Click
Keywords within the legal industry are generally more expensive than in any other category.
This proves it: The most expensive keyword in 2023 was “motorcycle injury lawyer,” with an average cost per click (CPC) exceeding $200.

Google Visual and Voice Search Statistics
32. Half of the U.S. Population Uses Voice Search Each Day
People are increasingly using voice search to get quick answers to simple questions without having to type.
Voice search is especially popular with younger adults, with 58% of consumers between 25 and 34 using it daily.
33. Most Voice Searches Are Related to Weather, Music, and News
Weather-related queries are the most frequent types of voice searches across the U.S., the U.K., and Germany.
Interestingly, more than half of voice search users in the U.S. have used the technology for food delivery compared with just 32% in Germany.
34. People Use Google Lens for 12 Billion Searches Every Month
Google Lens is a visual search tool that uses AI to detect objects and text in images.
For example, if you point your camera at a famous landmark, Google Lens can recognize and provide facts about what it sees.
The number of searches made using Google Lens has increased by four times since 2021.
So Much for the Numbers—Time for Action
Here’s what’s clear from these Google statistics: Search is more popular than ever. It’s a fixture in the lives of billions of people. And it looks like it’s here to stay.
Now, it’s time for you to integrate the insights mentioned here into your own organic strategy and monitor your search engine performance with tools like Project Dashboard.
Get started by clicking the “+ Create project” button in the top right-hand corner of the dashboard.

Enter your domain or subdomain and give your project an optional name. Then click “Create project.”

You’ll see all the available data for your project in the dashboard. Plus multiple widgets for tools like Position Tracking, Site Audit, and On Page SEO Checker.
You can set up each of these connected tools by clicking the corresponding “Set up” button.
