.png)
What are response curves?
As an important output of Marketing Mix Modeling (MMM), response curves show you the estimated cause and effect relationship between your various marketing activities and business performance. This helps you to forecast, make plans, and optimize your budget allocation. Ideally, these relationships should be based on the evidence you’ve derived from recent data to which you have access.
This type of modeling is the missing link for many marketers because if you don’t understand your response curves, you don’t know what to do differently in the future.
The response curve is a way of summing up a very large number of different "what-if?" scenarios. If you spend €1,000,000, what do you get, and how does it look? Should you try to get the OK to spend €3,000,000 and what difference could that make? Once you’ve got the basic idea of the response curve, it has a remarkable impact on the way you think about business.
For example, you can create a response curve using the data from a recent marketing campaign by modeling that data. You can look at how the amount spent on a marketing campaign (horizontal axis) would affect the number of sales you get (vertical axis). This would produce a curve which shows the real-time cause and effect relationship between spend and sales. If you increase the spend on the marketing campaign, you would immediately be able to estimate the effect on your sales.
.png?width=281&name=desmos-graph%20(8).png)
Why are response curves important?
Response curves are important because they not only offer you great insights, but they also change the way you think about your marketing activities. These curves will help you link your actions back to outcomes that lead to a return. In Marketing Mix Modeling you use data to produce your response curves. This means you are using empirical evidence to understand your curve. Instead of setting your marketing budget by blindly guessing or comparing your budget to your competitor’s, you’ll use real data to inform your decision-making. You’ll also be more inclined to explore how your past data and your activities impact your results.
What do response curves look like?
Response curves tell a story. Their shapes are defined by the historic data that has generated them. You can tell a great deal about how you should act to achieve your business objectives from these curves. But what do the various shapes mean?
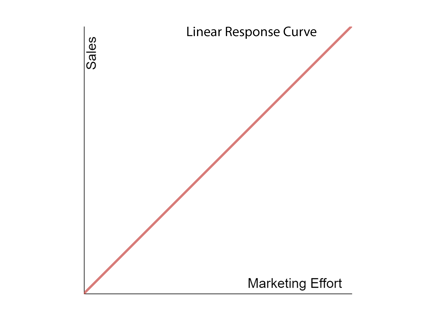
Response curves typically take on four basic shapes. Linear, concave, convex, and S-shape as pictured below. Let’s use marketing effort and sales as variables for these examples.
Linear, the simplest of the shapes represents constant returns. You would see this shape when adding to your marketing effort would increase your sales in a directly proportional way, forever without changing. This shows up as nothing more than a straight, upward or downward-sloping diagonal line. But as this scenario wouldn’t typically happen in the real world, you rarely see a linear response curve. Most of the time you experience diminishing returns and your line hits plateau making it a different response curve. You may see this result due to a lack of data or simply because the investments haven’t been high enough to start to saturate.
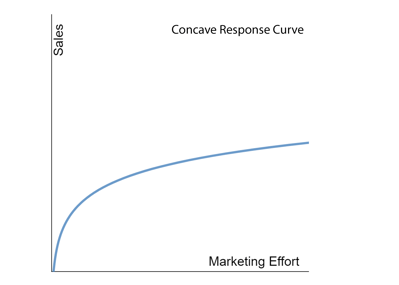
The Concave shaped curve represents diminishing returns in sales as your marketing activity increases. In the beginning, your marketing efforts see a nice return, but as you continue to increase your marketing activities you see less of a positive impact on returns. This happens until eventually your marketing activity no longer increases returns and your curve flattens out.
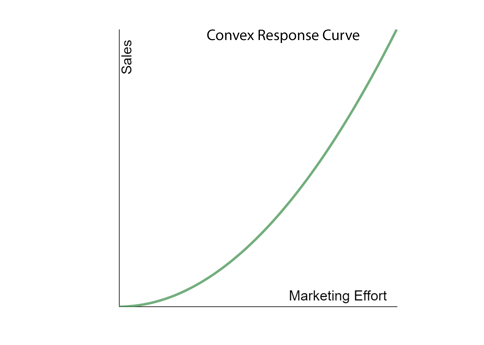
The Convex shaped curve represents an increase in returns as investment increases. In this scenario, the more you increase your marketing efforts the faster your sales grow. Unlike the linear curve, in the case of a convex response curve, the effect grows exponentially so that your marketing activities would cause your sales to increase at a faster rate. It’s important to note that convex curves are the least seen curve in Marketing Mix Modeling. They are very unusual and it often means that your marketing efforts weren’t getting anywhere near the saturation level.
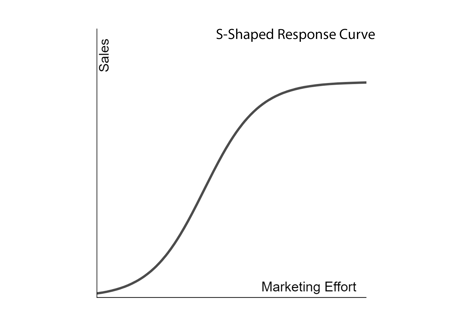
Lastly, your response curve can also be S-shaped. This starts as a Convex curve which then turns to a Concave curve. The curve starts almost flat or with a slow climb, then taking off and getting steeper and then, finally, flattening off again at the top, and any additional marketing activities fail to bring you an increase in sales, forming a lazy, elongated S. Although S-shaped curves are common in nature, they are less common in marketing.
Utilizing response curves in your Marketing Mix Modeling
Response curves are an output of Marketing Mix Modeling and an input to forecasting and optimization. This means response curves act as the bridge that takes you from modeling to future decision-making. Understanding your response curves tells you what to do differently in the future.
Marketers are faced with making future predictions for various marketing activities and response curves can tell you with some probability what may happen in different circumstances. As an example, you want to understand how your product’s price can affect revenue. Would dropping the price of your product actually increase sales revenue? Or, if we raise the price, would we see an increase in revenue with no real loss of volume? In this example forecasting through response curves show us that an increase in price would mean bringing in extra profit that would otherwise be left on the table.
Response curves also allow you to combine different scenarios. For example, if you spend X amount of your marketing campaign while also offering a 10% price reduction at the same time would it result in a significant increase in sales compared to only offering a decrease in price?
Or, maybe you would rather focus on optimization and making the most of your spend. You can use an algorithm such as the optimization algorithm within ScanmarQED’s modeling software to analyze your response curves and show you the most optimal points on the curves. So if, for example, you are a marketer who has been given an additional budget of €95,000 to be spent over a period of three months, the algorithm will tell you how best to do that, optimizing across all your different response curves and all your different marketing activities.
In closing, response curves are a reliable way to see the cause and effect relationship of your marketing activities and your company’s performance. By utilizing modeling like response curves, you can make more cost-effective decisions, forecast and plan, combine different marketing scenarios together, and have a deeper understanding of when and how to spend your marketing budget.
Learn more about response curves
If you’d like a more in-depth look at how you can derive response curves and better understand the impact of each of your marketing activities download our White paper “Understanding the impact of each marketing activity” by filling out the form below:

.png)