


You’ve probably already heard that statistics pages are a great way to generate links.
You’ve also likely noticed that some statistics pages are much more successful at earning links than others.
So I wanted to figure out what separates the most successful statistics pages from those that fall flat.
After researching and experimenting with my own content, I found five key things that seem to significantly improve a statistics post’s link attraction.
I’ll discuss each tactic in detail below and provide step-by-step instructions so that you can duplicate the results.
Incorporate Journalistic Keywords
I learned the reverse outreach hack from Brian Dean, and it’s now my favorite strategy to incorporate into any statistics page.
In the case study he wrote, his content organically earned over 5,000 links thanks to this method.
The idea is that instead of you reaching out to journalists and content marketers and begging them to link to your content, they find your content when looking for data to support their argument and naturally link to you.
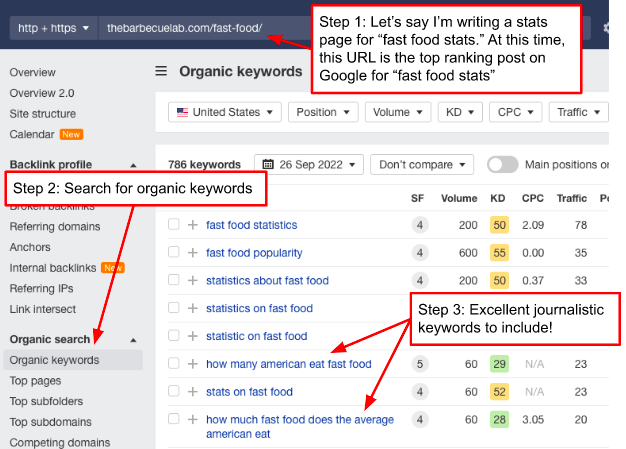
So start by finding long-tail keywords that are clearly hunting for data – Brian Dean calls them “journalistic keywords.”
To find these keywords, you can use a couple of different tactics:
- Find long tail keywords on competing statistics pages.
- Answer “People Also Asked” questions.
Finding long-tail keywords is pretty easy. You can Google the main keyword (e.g., “SEO statistics” or “coaching statistics”), take the top-ranking URL, and put it into your favorite keyword tool. Then, you can look at all the long-tail keywords and questions the page ranks for.
Here’s an example of this in action:
 Screenshot from Ahrefs, September 2022
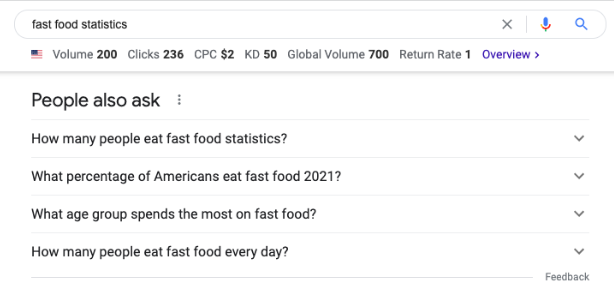
The other option is to look at the People Also Asked question box for your main keyword:
 Screenshot from search for fast food statistics, Google, September 2022
A pro tip is to click on each of the questions as it will generate even more questions:
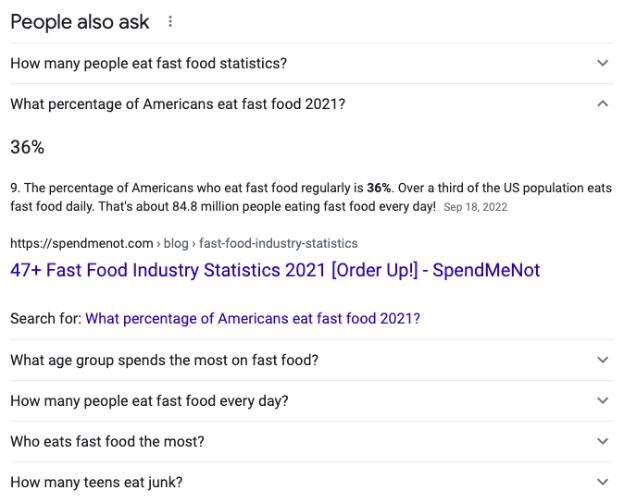 Screenshot from search for fast food statistics, Google, September 2022
As you include the statistical answers to each question in your post, optimize them for featured snippets by setting up the People Also Asked phrase as a question and then answering it as a complete sentence.
Here’s an example:
How many people eat fast food every day?
Approximately 85 million Americans eat fast food every day.
Find And Update Popular Stats
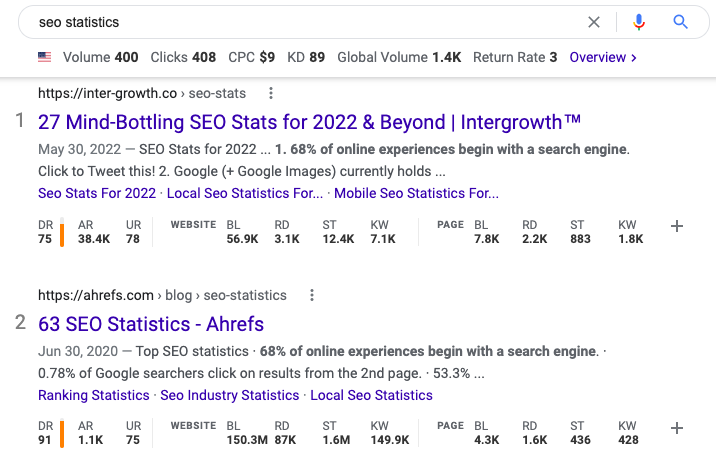
Ahrefs did a popular link-building study that walked through how it built 36 backlinks (for free) to a stats page by emailing websites with outdated statistics and offering more recent statistics posted on its brand-new stats page.
As a result, its post quickly became the top-ranking post for the term “SEO statistics.” Two years later, it’s still sitting in the second position.
 Screenshot from search for SEO statistics, Google, September 2022
Step 1: Take the top-ranking URL for your main keyword (e.g., “SEO statistics”) and put it into your favorite keyword tool.
Step 2: Check out its backlink profile and look at the most popular statistics. You can do this by scrolling through the backlink profile for the page and then doing an anchor text search for numbers you notice repeatedly.
For example, this statistic (“a third of Americans eat fast food each day”) seems to be popular:
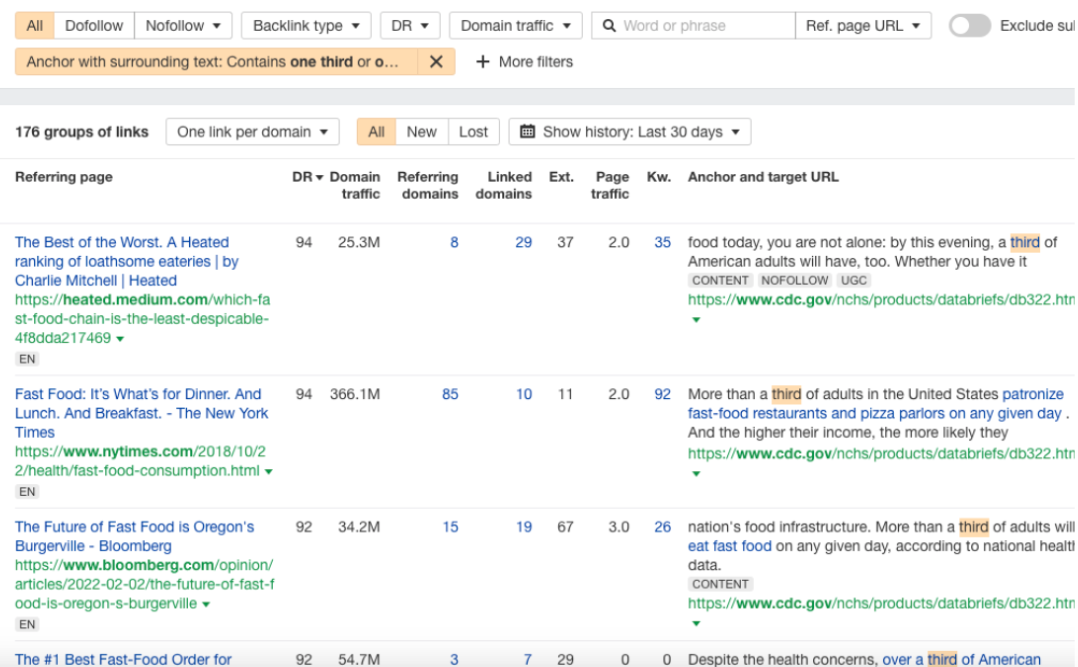 Screenshot from Ahrefs, September 2022
Step 3: Check that the statistic is outdated (at least 2-3 years old).
If it is, try to find a more updated statistic to replace it. If you can’t find a more up-to-date statistic, consider creating a new statistic yourself.
For example, I was doing a stats page for chatbots and found some dated statistics on how many people use chatbots by country.
So, I used Clearbit and another data extraction site to come up with more current statistics and then compared the new data to the dated statistics:
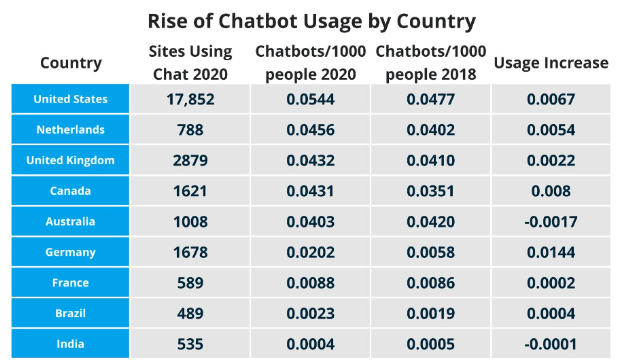 Screenshot from Chatfuel.com, September 2022
Step 4: Reach out to the websites with the dated statistics and offer the updated statistics.
Most people don’t respond to the traditional “link to my stats page because it’s better than the old page!”
However, most people like to have up-to-date content and, therefore, might be willing to swap out their old statistics for newer ones that you offer on a silver platter.
In fact, if you wanted to go the extra mile, you could even offer to update the whole page for them.
As mentioned earlier, this process helped Ahrefs earn 36 links in just a few weeks and catapult its page to the top of the search results.
Use A Hub And Spoke Model/Skyscraper Technique
I’ve noticed that many of the most successful statistics pages are organized in a hub and spoke/skyscraper style.
HubSpot’s Marketing Statistics page is an excellent example of a well-organized skyscraper-style statistics page.
Specifically, it includes the following sections:
- Content Marketing Statistics.
- Social Media Marketing Statistics.
- Video Marketing Statistics.
- Email Marketing Statistics.
- Lead Generation Statistics.
- Advertising Statistics.
- Marketing Technology Statistics.
- Sales Statistics.
This page even ranks well for many of these “spoke” statistics keywords. For example, the general page still ranks second for the term “content marketing statistics.”
 Screenshot from search for SEO statistics, Google, September 2022
So next time you create a statistics page, separate it into several categories and continuously update and build out those categories.
Include Original Data
Given that the meat of statistics pages is data, creating original data is another great way to attract links.
However, most people assume that creating new data is time-consuming and expensive.
While this is true if you intend to do a major “state of the industry” study, there are plenty of ways to create or extract original data for free (or cheap).
Below, I’ll walk you through a few of my go-to methods.
Scan Public Data
There is plenty of data available that most people simply don’t want to organize.
The first person to introduce me to this method was Andy Crestodina. He told me he wanted to know the average lifespan of a website, but that statistic didn’t exist.
So he pulled a list of the top 200 marketing websites (according to Alexa) and hired a VA to go into the Wayback Machine and record the last time the website had a major overhaul.
The answer was two years and seven months.
Today, that single statistic has earned that post over 1,000 backlinks from websites like HubSpot, Forbes, Wikipedia, the Content Marketing Institute, and other websites that you could never buy a link from:
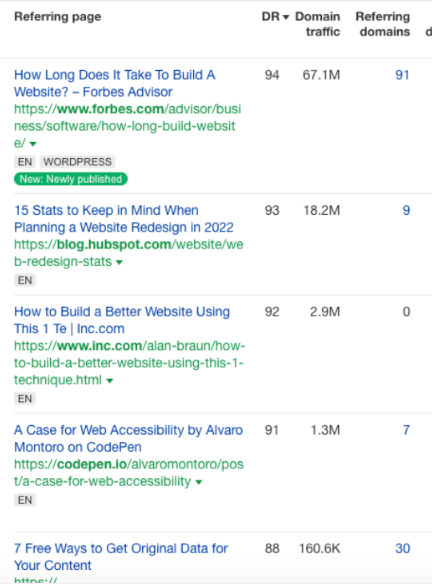 Screenshot from Ahrefs, September 2022
Leverage Internal Data
Another great way to create fresh statistics is to pull internal data.
Ahrefs has several excellent examples of this:
- 90.63% of Content Gets No Traffic From Google
- At Least 66.5% of Links to Sites in the Last 9 Years Are Dead
- Do Links Still Matter for Rankings? A Study by Ahrefs
I want to point out that Ahrefs always creates an individual post on each of these statistics and then later adds the statistics to its other dedicated statistics pages.
I’ve found that this is a clever way to maximize the links you can get for a single statistic.
For example, the first post I mentioned (90.63% of Content Gets No Traffic From Google) has over 8,000 backlinks (over 3,000 referring domains).
Without a dedicated post, that statistic could have easily gotten lost on a massive statistics page.
Therefore, consider pulling out your most valuable statistics and creating a dedicated post to promote that statistic and maximize links.
Send Customer Surveys
If you have a large email list, another option is to survey your customers or audience. For example, Andy Crestodina does an annual blogger survey, which always receives much attention.
He says that it takes over 100 hours to put together, though you can see that it is well worth the effort, given that it organically attracted over 13,000 backlinks (over 3,000 referring domains).
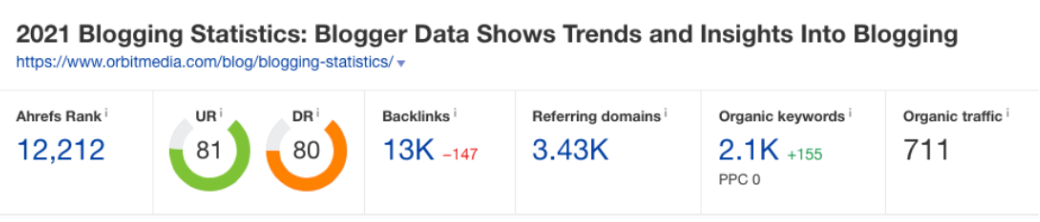 Screenshot from Ahrefs, September 2022
If you don’t have a list, you can also use a market research tool like SurveyMonkey or Pollfish, though this can get more expensive.
Create Graphics
Content marketers need data to support their claims, but they also need graphics and images to support their claims. Therefore, I strongly recommend creating graphics for your data as well.
For example, in the Google Lens search for the graphic below, you can see that a lot of different websites have shared it.
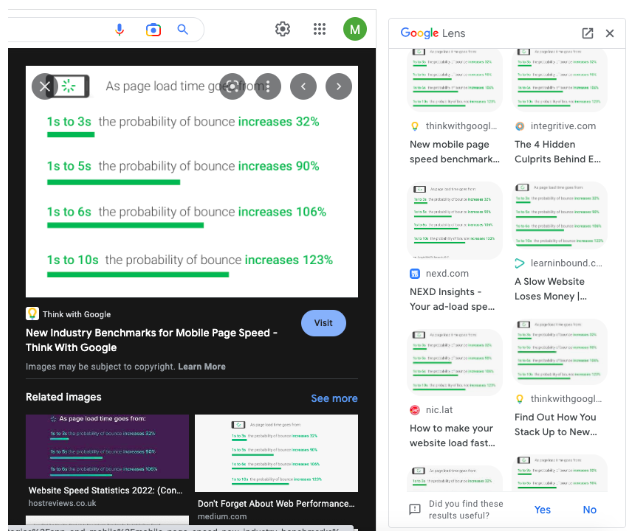 Screenshot from Google Lens search, September 2022
The best part about graphics is that you can take existing statistics and make graphics of them with your branding (just be sure to credit the original source).
Oberlo has plenty of examples of this:
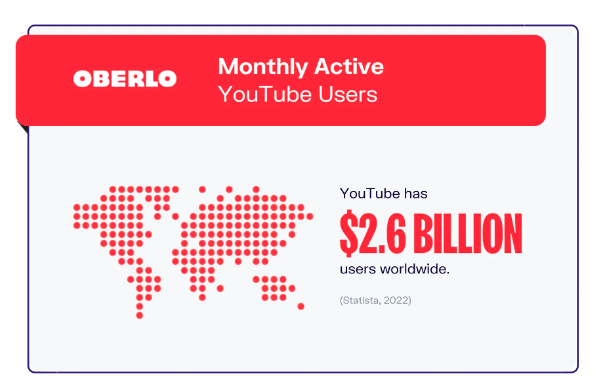 Screenshot from Oberlo, September 2022
If you don’t have a designer on staff, you can hire someone on Upwork or Dribbble to create graphics for you.
Start Updating Your Statistics Pages Now
Creating a great statistics page is a lot more than just creating the longest list of statistics that exists.
It’s about creating a resource that journalists and other content marketers find useful and can use to support their claims.
Try out some of these tips, and let us know if they help you generate more links!
More resources:
- How To Build Links That You Didn’t Ask For
- How to Find & Optimize Your MVPs (Most Valuable Pages)
- Link Building Guide: How to Acquire & Earn Links That Boost Your SEO
Featured Image: SEVENNINE_79/Shutterstock
