


If you’re sitting knee-deep in numbers you don’t understand as you rub your temples and debate plucking a number out of thin air and calling it your SaaS marketing budget this year, we definitely feel your pain.

Although establishing a marketing budget for your SaaS company can be overwhelming and tedious, it’s important you go through the motions of developing a beneficial and realistic budget. After all, effective marketing is an incredibly important part of a successful SaaS business.
B2B SaaS Marketing Budget vs B2C

SaaS can be divided into B2B products/services and B2C products/services.
- B2B SaaS products are products that are targeted at other businesses.
- B2C SaaS products are products that are targeted toward individual customers.
Unsurprisingly, there will be some differences in how these companies go about marketing and, therefore, how they will budget it. We’ve illustrated some of those differences in the table below.
|
How B2B Businesses Market to Customers |
How B2C Businesses Market to Customers |
|
Targets decision makers, including C-suite executives, managers, and supervisors |
Targets the individual (as they are the sole decision maker) with personalized content |
|
Goes deeper into their customer’s industries, focusing on more specific pain points and solutions with expert-level content |
Uses entertaining and emotional content to entice a purchase |
|
Content targets every stage of the sales funnel (Awareness, Consideration, Decision) but has a greater focus on nurturing |
Content targets every stage of the sales funnel, but because B2C’s funnel is much shorter, content is often more salesy and direct-to-purchase focused |
B2C companies typically spend more on marketing than B2B companies (you can see they also generated more revenue in 2019). A survey done in August 2021 found that B2B products typically spend 9.6% of their budget on marketing and B2B services 9%, while B2C products spend 19.5% and services 17.7%. B2C companies spent almost 10% more of their budgets on marketing.
Note: This breakdown is for marketing budgets in general, not necessarily marketing budgets for SaaS businesses in particular. You can use specific SaaS marketing strategies that may result in a slightly different budget breakdown. Routinely on the internet, you can find SaaS stats claiming you should be using a higher percentage of various metrics. And you can find it here, too! Our SaaS Marketing Playbook states that most SaaS businesses invest 30-40% of their Annual Recurring Revenue (ARR) on marketing.
This general breakdown is something to keep in mind when you’re creating your own SaaS marketing budget, depending on which type of business yours is. You’ll want to keep in mind the typically higher marketing budgets of B2C businesses if that’s what you are.
SaaS Operating Expenses

When it comes to running a business, SaaS or otherwise, there are a lot of expenses you need to worry about, other than just marketing. Since your SaaS marketing budget is a percentage of your overall expenses, you’ll need to know how much your business is spending to determine how much you can allocate to marketing.
SaaS businesses often create a P&L (Profit and Loss) report to understand where money is going in their business. These can get complex, but at a high level, P&L reports include:
- Gross profit margin, which includes Cost of Goods Sold (COGS)
- Your overall OpEx profile, which includes R&D, Sales, Current Marketing spend, HR, IT, Finance, Accounting, and Legal
Here’s an example of what that could look like:
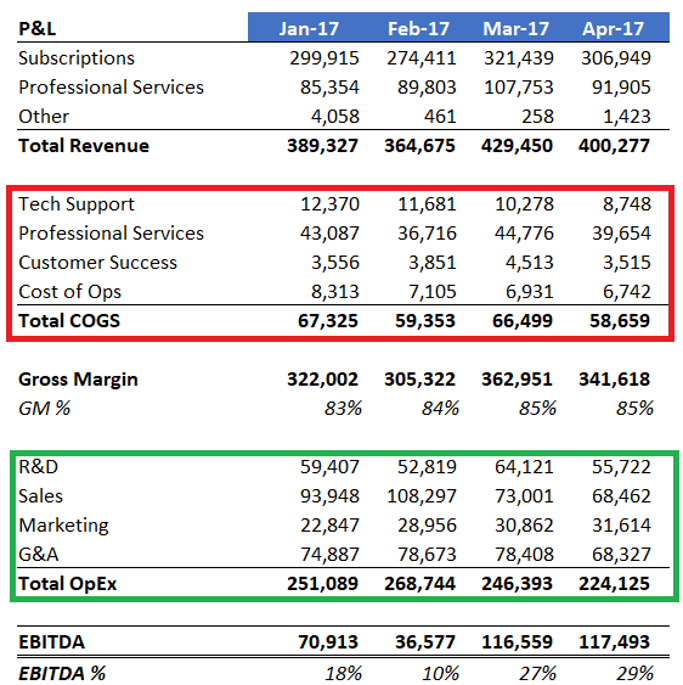
However, with sales and marketing, a total percentage of revenue might not be enough to tell the entire story about the department’s efficiency and productivity and how much you should invest in it.
As explained in the next section, that will require careful consideration of other metrics.
SaaS Expense Ratios
You can use metrics like the SaaS quick ratio, which includes metrics like SaaS magic number and rule of 40 to gain quick insight into your business’s financial health.
The SaaS quick ratio, for instance, is calculated using different Monthly Recurring Revenue (MRR) costs to come up with a single-digit number. The goal is to get four or higher to ensure your company grows sustainably, making at least $4 for every $1 spent.
Another metric you might see thrown around that relates specifically to your SaaS marketing budget is the LTV to CAC ratio, which should be a ratio of 3:1.
Customer Lifetime Value (LTV or CLV) and Customer Acquisition Cost (CAC) are two important marketing metrics that SaaS businesses should be tracking since they give you insight into how much value (money spent) each of your customers has to your business.
SaaS Marketing Budget Standards
Once you have a good understanding of the big-picture financial health of your SaaS business, you can start to look at the efficiency of your sales and marketing spend.
Strategic finance leader Parsa Saljoughian did the heavy lifting, created a ratio that SaaS businesses can use to determine their sales and marketing efficiency, and applied this formula to all public SaaS companies in the last decade.
The ratio is as follows:
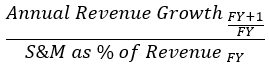
For instance, if your company generated $5M in revenue last year and $3M the year before that, your revenue growth was 60% YOY. Spending $1M on sales and marketing during the $3M year (33% of revenue) would result in a sales efficiency ratio of 1.8 (60% / 33%)
When applied to public SaaS companies, you get the following chart:
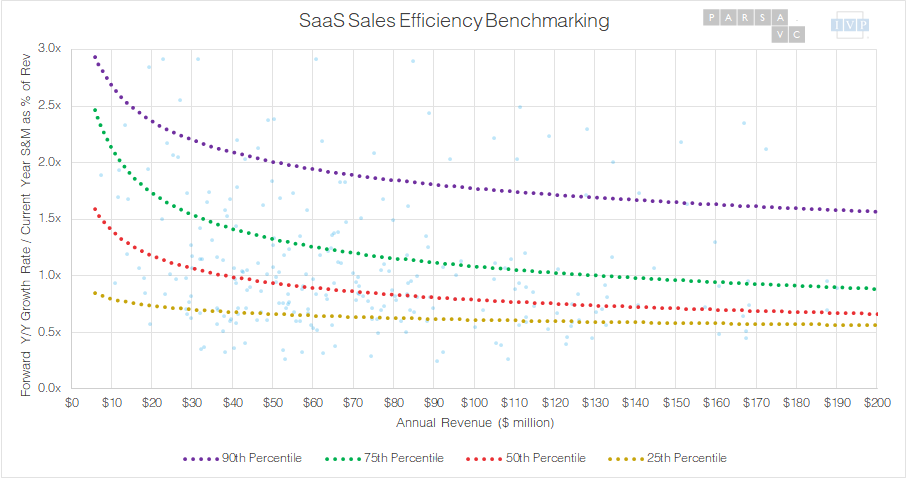
By using the above formula and placing the result on the chart, you can see where your company stacks up against other SaaS companies. This gives you a better understanding of where you sit in the overall SaaS space.
Customer Lifetime Value SaaS
This value essentially calculates how much money a customer is estimated to give to your business throughout their subscription (or lifetime). With CLV, you can know how valuable each customer is to your business over time.
The reason CLV is compared to CAC in the 3:1 ratio we described before is because that metric calculates how much money your business spends to acquire one customer. 3:1 is a good ratio because that way, customers are providing your business with much more monetary value than you’re spending on them, while still allowing for a comparatively robust marketing budget.
You calculate the LTV metric by multiplying the average product/service cost with how frequently it needs to be paid and how long customers are subscribed to your business.
Lifetime Value looks like this: LTV = Average cost X Frequency X Subscription length
To then calculate the CAC, you divide the amount spent on marketing (and sales) by the number of customers you’ve acquired.
Customer Acquisition Cost looks like this: CAC = Marketing spending / Acquired customers
From there, you can calculate the ratio by dividing each number by the lowest number (which is hopefully your CAC).
Here’s an example:
If the average cost of your SaaS product is $150, which is paid monthly (12 times a year), and customers normally last five years, your LTV equation will look like the following:
LTV = 150 X 12 X 5
= $9,000
Pro tip: Make sure the average cost, frequency number, and subscription length match. If customers normally pay annually and the subscription lasts several years, then your frequency number would only be 1 because they’d pay the average cost once a year for several years. In our example, the cost was monthly, so customers paid that price 12 times yearly for five years, on average.
If your average marketing spending in a year is $180,000 and you typically get 60 new customers a year, your CAC equation will look like
CAC = 180,000 / 60
= $3,000
For the ratio we do 9,000 / 3,000 and 3,000 / 3,000 to get 3:1, which is an ideal ratio.
SaaS Benchmarks
There are many other benchmarks you need to keep a tab on how well your business is doing and how much you’re spending on marketing. Depending on your budget set up, this can be a constant balancing act.
|
SaaS Benchmarks |
Description |
Calculation |
|
MRR |
This stands for Monthly Recurring Revenue, which means it’s the revenue your business makes monthly (and what you can reasonably expect it to make every month). Other MRR calculations include:
|
MRR = Number of customers X Average amount a customer pays |
|
ARPU |
This stands for Average Revenue Per User, which means it’s the amount of monthly revenue generated per customer. |
ARPU = MRR / Number of customers |
|
Revenue Churn Rate |
This metric is used to keep tabs on how much money you’re losing monthly as customers unsubscribe from your service |
Revenue Churn Rate = Churn MRR / MRR |
|
ARR |
This stands for Annual Recurring Revenue, which means the amount of money you can expect your company to generate yearly. |
ARR = MRR X 12 |
To learn more about these SaaS benchmarks and metrics (including the LTV and CAC), check out our blog post SaaS Reporting Guide: Cohort Analysis, Sales Metrics, CAC & More.
SaaS Marketing Budget Allocation

Once you’ve established what your SaaS marketing budget is, you’ll need to allocate how those funds should be distributed.
The first decision is how much to spend on inbound vs outbound marketing.
- Inbound marketing develops awareness of your brand and relationships with your target demographic by using online marketing strategies like SEO content, social media posts, social proof like case studies, and more.
- Outbound marketing is more traditional outreach, like cold calls and emails.
With SaaS businesses, you’re trying to drive traffic to your website, so focusing more of your marketing budget on inbound marketing efforts makes sense.
Organic content creation can help establish trust with your target demographic because they’ll come to understand and hopefully even rely on your expertise in your industry. That way, they'll think of you when they need to purchase a service you offer. And once they’re a customer, they’ll be loyal to you.
However, there are a lot of aspects involved in content creation. SEO writing professionals, for instance, focus on helping you develop and implement an effective content creation strategy and writing engaging content.
We highly recommend using content creation (like blog development) as part of your inbound marketing strategy. But, to be effective, you’ll need to calculate how much money you’ll need to get it off the ground and keep it running. And those funds will need to be allocated from your overall SaaS marketing budget.
Once you figure out how much money you have to spend on marketing, it becomes a balancing act of which funds should be allocated where.
Sample SaaS Marketing Budget
Now that we’ve given you some tips on creating a marketing budget and ensuring that it’s sustainable, let’s put it to the test by creating a budget.
We’ll do it using the same numbers as before, with an LTV of $9,000 and a CAC of $3,000.
30-40% of your ARR should be allocated to your marketing budget.
To calculate the ARR, we need the MRR.
With the numbers we used before, MRR would be $150 (the average amount paid monthly) by 300 (60 customers a year for five years (let’s say the company’s been around for five years)).
MRR = 150 X 300
= $45,000
ARR = MRR X 12
= 45,000 X 12
= $540,000
Now, let’s calculate 35% of our ARR for our marketing budget. For that, we’ll need to multiply our ARR by 0.35.
Marketing Budget = 540,000 X 0.35
= $189,000
With this money, you could then allocate how much you need for inbound and outbound marketing purposes, including any new software or employees you’d need.
Conclusion
Calculating a SaaS marketing budget is no easy feat. There are a variety of factors to consider and metrics to balance. However, with a good understanding of those SaaS benchmarks and metrics, you can create a budget to help your business grow without breaking the bank. Just remember to keep an eye on your LTV to CAC ratio, your quick ratio, and how much of your ARR you’re spending.
And if you’re still having trouble understanding your SaaS budget or want to talk more about everything SaaS marketing-related, don’t hesitate to contact us.

Share This Article

2.png)
2.png)