How to Level Up Your Content Strategy in the Parse.ly Dashboard

Content strategy has evolved. Journalists, editors, and marketers need multi-faceted analytics to compete in today’s content landscape. Understanding where your audience is coming from, what content they are engaging with, and what influences conversion is paramount to driving new revenue.
Parse.ly helps you do just that.
Besides democratized content analytics, Parse.ly offers unique features in our dashboard to help you level up your content strategy, including:
- Content conversions
- Video analytics
- Omnichannel tracking
- Multi-year data retention
- Audience segmentation
1. Content conversions
Revenue streams from content have expanded past ad impressions, yet business KPIs continue to be based on “vanity metrics” like simple clicks and pageviews. To derive true value from your content, you need data based on what’s driving conversions—those high-value user actions that move the needle for your business.
Parse.ly’s Content Conversions provides this insight, linking your content directly to those valuable actions and bridging the gap to proving ROI.
With Content Conversions, you can choose from several built-in conversion types, such as:
- Lead capture events
- Newsletter signups
- Purchases
- Affiliate link clicks
- Paid digital subscriptions
Or customize your own based on your organization’s target KPIs.
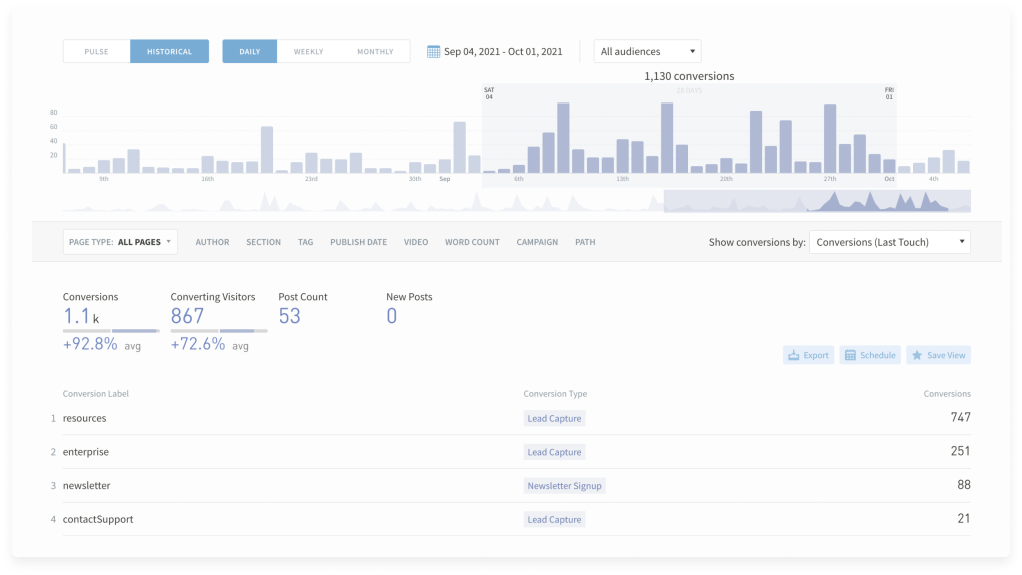
Content Conversions also includes four different attribution models: first touch, linear, last touch, and last post touched. First touch gives insight on the topics or campaigns that led an audience member to your content. Last touch and last post touched credit the content that led to immediate conversion. Linear provides full visibility into the complete journey a user takes over multiple sessions leading up to a conversion.
You can view completed conversions just 30 minutes after they occur, tracking campaign performance in real time. Comparatively, Google Analytics takes 24 to 48 hours to show the same information.
Content Conversions at work
Backstage, a leading American entertainment jobs platform, knows firsthand the power of Content Conversions. They publish an online magazine to create interest and stickiness to their SaaS jobs platform. And they use their SaaS jobs platform to create interest and stickiness back to their online magazine—forming a content driven flywheel.
They needed a way to quickly create, test, measure, and optimize content in this flywheel, while unlocking ways to discover what content was important to their new users across a variety of locations and industries. This data would help them to adapt their content strategy and improve underperforming content.
They use Parse.ly Content Conversions to measure how their content impacts key moments, including:
- When an individual creates a talent profile
- When an individual applies for a job
- When a corporation creates a corporate profile
- When a corporation posts a job
- When an individual or corporation subscribes to their newsletter
This data helps them identify which are the hottest pieces of content that drive those actions. Jobs that get lots of applications get put into the newsletter. Articles that get lots of newsletter subscriptions get advertised in the sidebar of the jobs platform.
What followed was a 20% improvement in conversions, a 25% increase in content-driven revenue, and a 5-10% savings in spending.
“Backstage continues to grow, and conversion tracking has helped us be more efficient. We’ve saved dozens of person-hours a month and seen real results—25% for additive growth from our content marketing activities and objectives.”
—David Grossman, Chief Marketing Officer, Backstage
2. Video analytics
If you’re looking to prioritize video this year, do you know how your current efforts are performing? And most importantly, can you see that performance in context with the rest of your content? How are embedded videos impacting user engagement? Which video topics are resonating with your audience? Which sections of your site are best suited for video content?
Parse.ly’s built-in video analytics give you answers to these questions and provide a complete picture of video performance. Get deep insight into your video marketing efforts, so you can fine-tune your strategies based on how your audience is actually engaging with this content.
Use these two strategies to optimize your video strategy with Parse.ly’s video analytics:
- In real time, filter your top posts to show only those without a video so your team can quickly add a related video to those posts gaining traffic/attention.
- Filter your top posts to show those with a video embedded to quickly identify posts with low engagement that need a new video or different video placement.
Pro tip: If you’re struggling to keep up with the demand for video, check out our complete video toolkit.
3. Omnichannel and syndication tracking
What if you could access Apple News, social media, and blog analytics all in the same dashboard? With Parse.ly, you can.
Apple News is just one of six distributed channels currently supported by Parse.ly. Others include your website, Accelerated Mobile Pages (AMP), Native Android, and Native iOS.
Unlike Google Analytics, where app and browser data are separate, Parse.ly combines these so you can view omnichannel performance cohesively to make informed strategy decisions.
Further segment your Apple News audience to see what articles resonate with subscribers and the time each subscriber spends with each piece of content. Unified and cross-channel raw data warehousing is also available for even deeper analysis.

Slate Magazine, which covers U.S. current affairs, politics, and culture, used these insights to understand news trends and ultimately boost loyalty to their site.
“This is the first time we’ve ever had a unified real-time look at every single major traffic source to Slate.”
Mark Morgioni, Director of Research and Data, Slate
4. Audience segments
Parse.ly’s audience segments help you quickly understand the behavior of specified user groups within your readership and align your content strategy to their specific needs and preferences.
There are multiple ways to segment your audience in the dashboard. Users commonly segment based on geography (geo-segmentation), subscriber type, or member status.
Subscriber and member segments allow the audience to be split as subscriber and non-subscribers, active and expired subscriptions, or users with different levels or types of subscription plans.
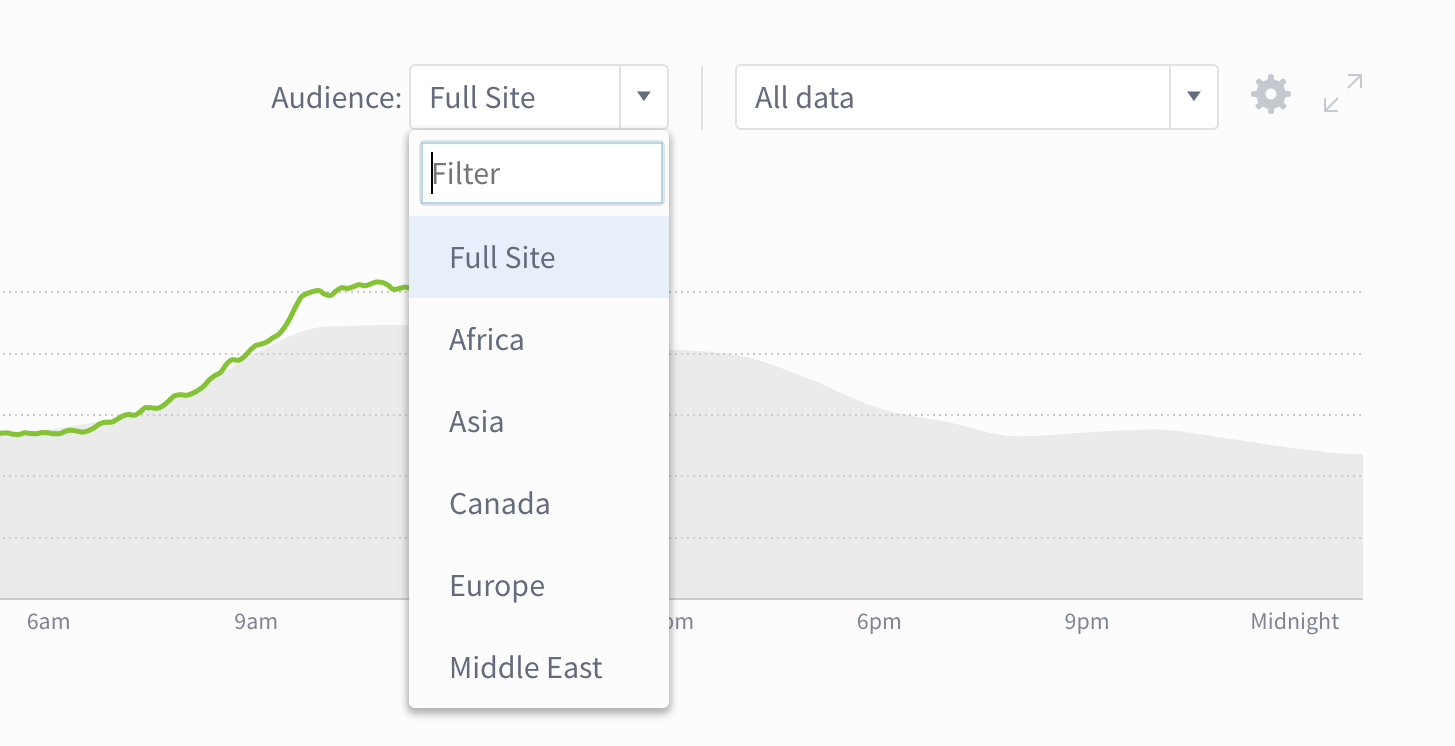
Geo-segmentation offers insight into user behavior for a specified area such as a continent, global region, country, subdivision, or city.
This is how the team at Bloomberg was able to improve their content for their international audiences. They assigned one geo-segment for each of their five market areas—Africa, Asia, Canada, Europe, and the Middle East —and used the data that they received to pitch and promote new stories.
“The ability to break things down by region—especially when cross-referenced against Parse.ly’s range of metric-users, engaged time, social referrals and interactions—is priceless.”
Adam Blenford, Managing Editor of Digital in Europe, Bloomberg
5. Multi-year data retention
From date of collection, Parse.ly typically retains data—pageviews, unique visitors, engaged time, conversions, etc.—for 13 months for analysis and reporting.
However, some publishers and brands need data kept longer, for example, to analyze long-term trends or to compare performance across multiple years. To address this, Parse.ly offers an unlimited data retention option.
This is particularly helpful for publishers with evergreen content, which remains relevant and useful for an extended period. Access to historical data helps publishers analyze how evergreen content performs over time and make informed decisions about optimizing and promoting that content.
For Google Analytics users, data retention is a growing concern due to the forced migration to Google Analytics 4 (GA4). Historical data in GA4 only starts from the point a site is retagged, and as GA4 is an entirely new product with different architecture from Universal Analytics (UA), users cannot import UA historical data into GA4. The upshot: by the time you set up your site with GA4, you’ll likely have less than 12 months of historical data available.
Being able to retain data for extended periods is a valuable capability for publishers who want to understand website performance over time and make better digital strategy decisions based on data-driven insights.
Get more content insights with Parse.ly
Content Conversions, video analytics, omnichannel tracking, multi-year data retention, and audience segments—available in the Parse.ly dashboard—help our customers make smarter, better-informed content strategy decisions, based on true insight into what’s working (and what isn’t).
Ready to start putting these tools to work to understand the performance of your content and optimize it? Get in touch with your account representative or contact us today.