Best Web Analytics Tools For Small Business 2022
Web analytics software helps businesses anticipate the needs of their consumers. Through data collection and analysis, teams can observe real-time user behavior. With that information, you can make your site more engaging and user-friendly. Web analysis tools can be very expensive so we included some of the best web analytics software for small businesses.
What is Web Analytics?
Web analytics is essentially website analysis. Website owners can use web analytics software for data collection and to analyze visitor behavior with their website. The information you find will allow your team to make important conclusions on customer behavior.
Teams will also be able to use their website data for business goals and updating search engine optimization (SEO). By updating SEO, teams can raise their ranking with search engines and be noticed by their target audience.
Analysis tools can also be used for keyword research, but not in an obvious way. The reason a page could have a high bounce rate is the keywords aren’t matching what end-users are actually looking for. That means it can be helpful to experiment. With the metrics you gather, you can find ways to expand your reach on social media as well and pull in more web traffic.
Web analytics can track important metrics that measure your site’s performance. A key metric or key performance indicator (KPIs) can be used to measure your progress with business goals. Key metrics could be the number of visitors on a landing page or the overall retention of site visitors a month.
You can even use website analytics tools for testing website performance and accessibility. Teams can use A/B testing to collect data on their site’s theme and functionality. With that information, you can modernize and improve the user experience with consumers.
The table includes examples of website analytics platform capabilities. You will have key metrics and ways it can improve your site like usability.
| Conversion Rate | Bounce Rate | Retention | Click-Through Rate (CTR) |
| The conversion rate is your total conversion divided by the number of website visitors. Conversion / # of visitors = conversion rate | The bounce rate is the percentage of users who leave after visiting a single page. Single-page sessions / total sessions = bounce rate | Visitor retention metrics are usually presented as a retention report that shows unique visitors who returned at least once. | The number of times your ad is clicked is divided by the number of times your ad is seen (called an impression). Clicks/impressions = CTR |
| Average Time on Single Page | Referrals | Usability | A/B Testing |
| The amount of time all users spend on each web page averaged. | Referral traffic comes from another site that has an outbound link to yours. | Ensuring your website functionality is fast and easy to navigate. | Tests two versions of a web page with users. |
The next section explores web platforms especially suited for a small business.
What Are The Different Web Analytics Tools For Small Businesses?
Web analytics platforms can offer some affordable and even free subscriptions. Most cover important key metrics and many offer more in-depth features like A/B testing and heatmaps. E-commerce and marketing teams will be particularly suited for ones that are focused on the customer journey. If you are interested in seeing the free list of web analytics software see our article here.
Google Analytics
Special Note: Google Analytics free version (aka Universal Analytics) has switched to Google Analytics 4 as of July 1st, 2022. In this section, we’re just talking about Google Analytics and Google Analytics 360. This is because there aren’t too many users of the new version yet and the main difference is Google Analytics 4 is just a faster, better version with updated machine learning and smoother integrations. For more information about Google Analytics 4 go here.
When you do switch over that does mean some setup on your part. The instructions for Google Analytics 4 setup you can find here. There will be a new version of Google Analytics 360 as well but it’s not available right now. Anyone can switch to Google Analytics 4 early before July.
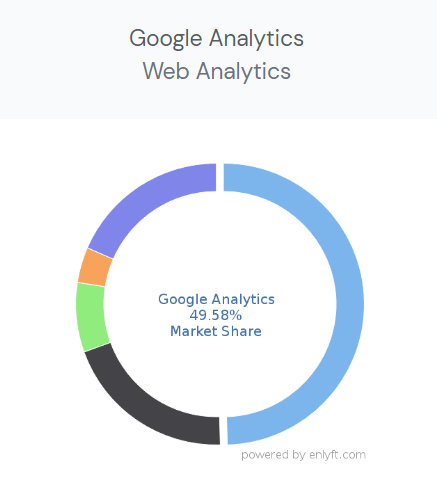
Google Analytics has pretty much taken over and revolutionized web analytics. They are the number one small business choice even for new startups. They are almost the entire web analytics market alone. Google Analytics is reported to make up 49.58% of the market.
This is definitely because they offer great analytics for free. They are so standardized you can find a plethora of articles and tutorials showing you how to use their website analytics tool.
Google Analytics offers analytics that any team of any budget can use. Their free version gives you access to data reporting, attribution, cohort and funnel exploration, and quite a bit more. It also easily integrates with Google Ads and other Google tools. Teams will be able to use the web analytics tool for their mobile apps as well.
| Google Analytics | Free | Google Analytics 360 |
| Cost | $0 | No upfront pricing*There is consistently reported pricing by other sources |
Google Analytics has maybe two big issues. One is they retain website visitor data which can be seen as an ethical problem. The other problem is that the next step up from the free version is Google Analytics 360. The subscription offers advanced analytics, BigQuery Export, and dedicated experts.
There is no upfront pricing for Google Analytics 360. Luckily several articles have reported the same yearly cost of 150,000 for their starting plan. It’s actually surprising but quite a few small companies do use Google Analytics 360. They make between 1 million and 50 million in revenue, with a large concentration of users making 1-10 million.
The majority of small companies aren’t going to want to spend that much money on one software tool. The bright side is Google Analytics can be used with other software. You can peek at our free list of web analytics software as well.
For an introduction to Google Analytics check out the video below.
Crazy Egg
Crazy Egg is a web analytics platform that can offer teams usability testing and recording. It has A/B testing and heatmaps for tracking user behavior.
Crazy Egg is especially small business-friendly because of their range of affordable plans. There is a subscription for every stage of your company, all under $400/mo (except Enterprise). Platforms that are more enterprise based wouldn’t have plans this low.
Crazy Egg’s most important niche is being able to help with usability. Teams can see if there is an issue with navigation. Groups are able to find out if consumers are struggling with the checkout.
Crazy Egg also has marketing tools as well. Confetti is a tool that can be used for monitoring customer-journey metrics, old visitors, referrals, which search engines were used, etc. This information can be important for marketing campaigns and seeing which aids or affiliations are working.
For Crazy Eggs subscriptions are limited by page views per month, snapshots, and recordings. Their plans are only billed annually, not monthly. All subscriptions have unlimited surveys, unlimited a/b tests, and unlimited websites. These flexible features are greatly beneficial to small teams that want to grow fast.
| Crazy Egg | Basic | Standard | Plus | Pro | Enterprise |
| Cost | $29/mo | $49/mo | $99/mo | $249/mo | Custom plan |
For Basic you start with 30,000 pageviews, 25 snapshots, and 100 recordings per month. Teams that are fairly small can do a lot with this volume of web traffic data.
Small teams that receive significantly more visitors a day would want a bigger sample size. Business owners that have a number of unique demographics will also want a wider sample size to observe and test.
Next is the Standard plan offering 75,000 pageviews, 50 snapshots, and 500 recordings each month. This is a lot better for small businesses with more traffic and demographics at still an affordable monthly price.
Teams can still gather valuable data with 75K tracked views. Data analytics, research, or developer teams that are quite small might even have an easier time sorting through less recording and heatmaps.
For Plus you’re allowed access to 150,000 pageviews, 75 snapshots, and 1,000 recordings. More established companies with bigger teams will have plenty of data on user experience to work with. The plan also comes with support from a Crazy Egg expert.
Compared to many web platforms this subscription is super budget-friendly for the analytics features it comes with. It’s not the best plan for new startups with small budgets because of the overwhelming amount of data and the expensive price tag.
With Pro you take a big leap and can access metrics for 500,000 page views, 100 snapshots, and 5,000 recordings a month. This is much more ideal for large teams or multiple teams that need a wealth of information to pull from for all their projects.
You would be able to get a huge amount of diverse input from site visitors and be able to draw conclusions easier. It’s hard to know if you should change where a button is if only one or two struggle to find it but if a 100 in half a million it’s still small but it shows multiple different consumers had the same issue.
Enterprise is the custom subscription option if you need tailor-made metrics. Enterprise also has SAML single sign-on along with onboarding and training.
This plan will most likely be a lot steeper in cost since it is for more “enterprise” level teams. It’s not recommended when you want to save on your budget, especially when they already have so many affordable subscriptions available.
Below is a tutorial showing you how to read a Crazy Egg heatmap.
Mixpanel
Mixpanel is a web analytics platform focused on monitoring customer experience. It answers all your questions through reports and easy-to-use data. Mixpanel’s UI is beginner-friendly and offers the ability to build conversion funnels and cohorts without knowing any SQL.
The subscriptions have the major benefit of no seat limits. Larger teams can really struggle to find plans that are both budget-friendly and allow multiple users.
Mixpanel still has restrictions per plan. They have a limit on the number of tracked users per plan. Teams that are early-stage startups are in luck because they can potentially save one-year of Growth. You can learn if you qualify here.
The Free plan gives teams unlimited data history, core reports, and data monitoring with alerts. You would have access to data for 100K users a month. Most sample sizes in a freemium version are not this much.
The cons of subscription are the lack of advanced analysis metrics such as consumer segmentation. You are also limited with certain metrics like data modeling, exporting, and can only save 5 reports per employee seat. You get barely any admin controls and no compliance options (HIPAA) that other plans do have. Support isn’t available except for the community.
The freemium choice will still be a great budget saver. Their features can certainly help your team go far. Bigger companies that want advanced metrics and support should pass.
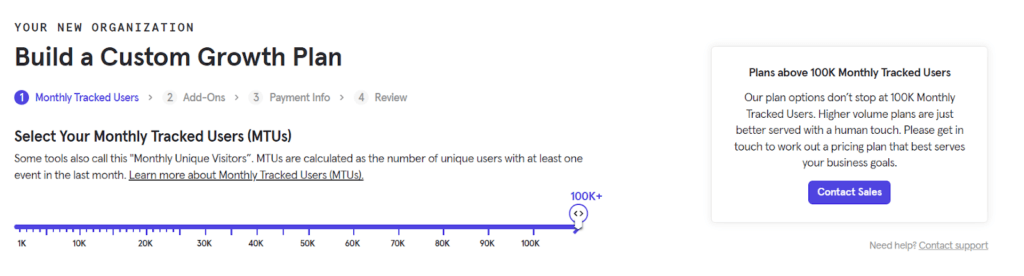
For Growth, monthly tracked visitors can be customized to your preferences. The $25 a month price is only where you start from and are highly likely to end up paying a lot more.
There is a calculator to estimate the cost of Growth for monthly tracked visitors. If you chose more than 100K visitors you have to talk with sales to learn the price.
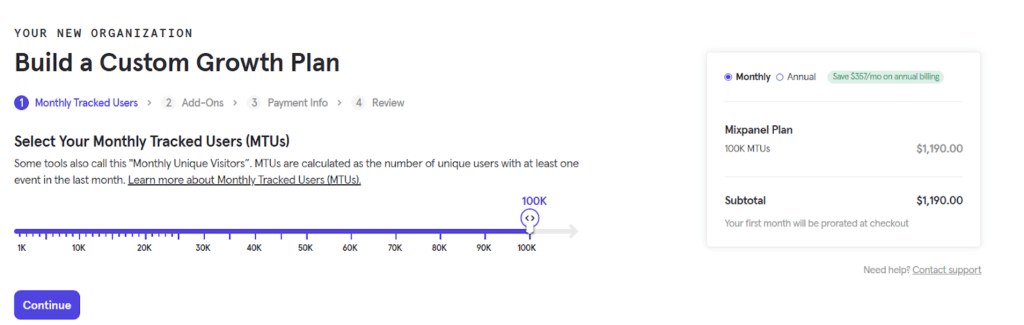
If you put the calculator on 100K exactly, the cost per month is $1,190.00. Ouch.
Now the Free subscription already comes with 100K visitors so why bother buying Growth at over $1000 a month?
Growth has better functionality compared to Free. Growth comes with full data modeling, limitless report saves, and data exporting. Your data is also assured to have HIPAA compliance. You get more admin controls but will not be able to control who can view and query the database.
For support, it’s not a huge leap in communication but you can email during business hours. You don’t get the full advanced analytics but can draw relationships and segment users.
Growth can be a good step up if your budget won’t be badly impacted by the cost. Frugal and flexible teams might consider using Mixpanel’s free tool with other free tools Google Analytics or affordable subscriptions like Crazy Egg.
With the Enterprise subscription, both the plan and pricing are customizable. No calculator is offered so you have to contact sales for any kind of estimate. Enterprise comes with all features. This includes full analytics, admin controls, and support. Teams will also be able to get add-ons such as live chat support.
Enterprise is best for larger companies. Smaller companies would be better off with Free and Growth, or more platforms that offer better cost savings.
To see a demo of how to use Mixpanel see the video below.
Matomo
Matomo is one of the few open-source web analytics platforms. They offer small teams real control over their data all while saving money.
The only issues are setup and maintenance. You need a tech-savvy individual to install the free version on your own servers and continue to handle operations and troubleshoot any issues that can arise.
Matomo has their On-Premise (downloadable version) hosted on your server or their Cloud version they host. The download is free but the cloud version software is a paid subscription.
| Matomo | On-Premise | Cloud |
| Cost | Free to Download | No upfront pricing until free trial ends |
For the On-Premise software download, you have unlimited websites, users, visitor segmentation, and raw data retention. You can save anything you want like report data because you are the one storing it. You can import data and export data because it’s your data. The software allows especially easy import from Google Analytics.
The open-source version’s main issue is a lack of complex features. The add-ons require a paid subscription (for just the add-ons, you are not buying the entire cloud version). The more advanced features you could add-on include site media, A/B testing, heatmaps, funnels, and cohorts. They range from $89 to $229 a year.
The open-source version is certainly worthwhile if you want to use other free tools that come with those advanced features like Mixpanel or affordable tools like Crazy Egg.
Motomo’s Cloud subscription does not offer any upfront pricing. You have to wait until your free trial is over after 21 days. Cloud comes with support and the majority of add-ons that cost extra if you were using the On-Premise software.
The problem with Motomo’s Cloud software is it has a lot more restrictions than the On-Premise choice. You’re only allotted 30 websites and users. Teams can create up to 100 segments, 150 goals, and have 24 months of raw data retention. This was all limitless in the On-Premise version because you are in full control of storage because it’s your server and your data.
You are choosing between special features and limitations. If you have a tech-savvy team and have other software for A/B testing and funnels then the downloadable version is ideal.
If your team does not have the technical skills then the Cloud subscription will be significantly easier to operate. Nothing stops you from choosing both and allowing your different teams access to the metrics they need for projects and campaigns.
See the video below for an introduction to Matomo.
Smartlook
Smartlook offers metric and data customization focused on user behavior. This means you get the most insight through recorded sessions and heatmaps. They are mainly used by small teams, with 73% of customers classified as small businesses.
| Smartlook | Free | Startup | Business | Ultimate |
| Cost | $0/monthly | $39/monthly | $111/monthly | Custom Plan |
The Free subscription allows 1,500 tracked sessions, 1 month of data retention, and 3 heatmaps. They also include the metrics on 2 events, and let you build 1 funnel per month.
The plan is functional but very bare-bones. You won’t have access to any customer support, integrations, or advanced features. You would use this plan if you were just starting out and were worried about budgeting. It would also be more useful to pair with another free option like Google Analytics or Motomo’s On-Premise version.
For the Startup plan, you get 5,000 recorded sessions with the option to upgrade to 25,000 (for $129/mo). You also get 4 track events and 10 heat maps that you can upgrade to 100 (you need to fully sign up to see that fee).
It has the same amount of data retention and funnels as in Free and doesn’t allow integrations either. You are able to use some advanced features like visitor journey tracking and being able to share recordings and heatmaps. It also offers live chat support.
This is a good step up for a small team that wants more options. It’s not well suited for small businesses with high traffic volume and has numerous projects and plans for growth. Startup is more the lower end of a small business similar to its name—it’s better for startups.
The Business plan offers quite a few more features and options for upgrades. You can track 15,000 sessions and can upgrade to 200K (for $609/mo). It comes with 3 months of data retention, 12 tracked events, 4 funnels, and 30 heatmaps. You can also upgrade all those features but you won’t be able to see those fees unless you actually sign up.
Business offers about the same amount of advanced features as Startup but you can buy add-ons like developer tools, and premium integrations (with other web analytics tools). You won’t be able to add on more support features or enterprise features like custom paperwork and sampling.
When it comes to Ultimate you can customize all the main features like sessions, data retention, heatmaps, etc. You can add on premium integrations and enterprise features as well as access the majority of advanced features.
This plan is more suited to high-performing small businesses that make around 1-10 million in revenue. You would go with a more affordable option, especially if you don’t need extensive metrics.
Below is a run-through of how Smartlook works and a peek at their UI.
Hotjar
Hotjar is an analytics platform that focuses on user behavior. Its metrics have a strong focus on product growth and marketing strategy. They mainly collect data with heatmaps and user sessions similar to Crazy Egg and Smartlook.
All plans allow for unlimited team members.
| Hotjar | Basic | Plus | Business | Scale |
| Cost | $0/forever | $31/annually, $39/monthly | $79/annually, $99/monthly | Custom Plan |
For Basic you are limited to 35 daily sessions and 1,050 sessions a month. You also have access to unlimited heatmaps, 1-year data storage, and almost all dashboard features excluding segmentation. Teams can also create up to 3 surveys a month to collect user feedback.
You can even export heatmaps in the free version which is rare since most analytics tools limit exporting. There aren’t too many advanced features like special filters and integrations. This is still a pretty strong freemium plan for a small team especially if you were using it in tandem with another free tool like Google Analytics.
With Plus, you can have up to 100 daily sessions. You will also be able to filter and segment heatmaps data and unlimited surveys. You won’t have integrations or advanced features like customizations on surveys.
This plan is great if you want to collect data from sessions, heatmaps, and surveys. The metrics are great for a small team but the plan has no integrations. This means you can’t integrate with software platforms like HubSpot, Slack, and Optimizely. This isn’t the plan if you can’t handle limited functionality for growth and analysis.
The Business option allows nearly all features and starts at 500 daily sessions with the choice to customize up to 250K. With Business, you can even more filtering features such as filtering by referral or rage clicks (when users repeatedly click a non-functioning button).
It has customization features for surveys and allows all possible integrations. You won’t get a customer service manager for support or have a single sign-on (SSO) login.
This plan is a great deal for small businesses that want a plethora of features and metrics. If you are just starting out the costs and analytics would be too much.
When it comes to the Scale plan, the price is customizable and you can access all features. It’s very similar to Business with a few differences. Daily sessions are unlimited, you will have more support, and SSO.
If you don’t need more recorded sessions then Scale isn’t worth the step up, especially since the Business plan is super stacked. If your company does have enough visitors to require that much data collection then go for it but remember you can customize the number of daily sessions for Business.
Below is a product tour of Hotjar.
Which Web Analytics Product Is The Best?
The table in this section contrasts the main differences and highlights between software. between each platform.
| Software comparisons | Google Analytics | Crazy Egg | Mixpanel |
| Motomo | Motomo is free and open-source so you have more control and ownership of data collected. Google Analytics is free but not open source and you don’t have full ownership of your data. Google keeps all data on your consumers. | Crazy Egg has no free options. They offer heatmaps and A/B testing for deeper insight into users while Motomo’s open-source version does not have those impressive features. Motomo allows users to add on features like A/B testing and the cloud version already comes with special features. | Mixpanel has a free option like Motomo but it has less privacy options whereas with Motomo’s on-premise version you control the privacy. Mixpanel has more plan options with strong features like data modeling. Motomo offers add-ons and the cloud version has strong features like Mixpanel. |
| Smartlook | Smartlook has a free version along with several different price ranges for subscriptions. Google has their very robust free option but their 360 suite is very expensive. Smartlook has good marketing analytics but their features are very limited. | Crazy Egg has no free plans like Smartlook. Crazy Egg does have powerful observational analytics features whereas Smartlook limits their features like heatmaps for each plan. Crazy Egg has unlimited surveys, websites, and A/B tests. | Smartlook and Mixpanel both have free versions but Mixpanel’s freemium version offers more. Mixpanel’s other plans may look cheap but get expensive fast while Smartlook has variations in their subscriptions. |
| Hotjar | Hotjar is more focused on behavior analytics than Google Analytics. Both Google Analytics and Hotjar have a free plan but their offerings aren’t too comparable. Hotjar is better for visual data whereas Google Analytics is best for reports and cohorts. | Hotjar has unlimited heat maps while Crazy Egg has unlimited A/B tests. They both offer the same type of data and both have varied plans. Hotjar has cheaper plans in comparison but Crazy Egg has more features overall. | Hotjar has a more stacked freemium than Mixpanel, but Mixpael offers more reporting while Hotjar mainly offers observational data. |
For more web analytics platforms see the section below.
More Resources
If you want to see more website analysis tools we have a couple of different lists of software available. We offer related software under the categories of web analytics, digital analytics, conversion rate optimization, and eCommerce analytics.
We also recommend these articles for those that want to know more about web analytics. HubSpot’s blog has an awesome beginner introduction to web analytics and TechTarget is perfect for more in-depth learning. Clean.io’s blog goes into some major eCommerce benefits.
For those that have used any of the platforms discussed here please leave a review to help other buyers make informed decisions.
Was this helpful?

Looking for your next web analytics software? Click here to read REAL reviews from users like you!