Web Analytics Pricing 2022
Web analytics is the realistic way virtual platforms can read the minds of their website visitors. Through data collection and analytics, you can learn from user behavior. Are they leaving too fast? Are they struggling to find your CTAs? You can figure out what needs to be met and how to do it with a web analytics platform. Let’s go into some very popular tools and their different offerings so you can find the best web analytics tool for you.
What is Web Analytics?
Web analytics is essentially website analysis. You use software for data collection and to analyze user interactions with your website. This means you can get a sneak peek inside real-time customer behavior.
You can use that website data for meeting business goals and updating your site’s search engine optimization (SEO). With polished SEO you can make your website more visible to search engines and, as a result, your target audience. With the metrics you gather, you can also find ways to expand your reach on social media and pull in more web traffic.
Web analytics can track important metrics that measure your performance. Key metrics or performance indicators (KPIs) are what you are able to statistically measure based on your business goals. Key metrics can include things like the number of visitors to your landing page or the bounce rate.
Web analytics tools can also help you with A/B testing and accessibility/usability for your site. You can simultaneously track performance and make predictions on how to improve your virtual platform’s functionality.
In the table below are examples of some of the things a website analytics platform can do. It includes key metrics and other areas of analysis tools that can optimize your site.
| Conversion Rate | Bounce Rate | Retention | Click-Through Rate (CTR) |
| The conversion rate is your total conversion divided by the number of website visitors. Conversions / # of visitors = conversion rate | The bounce rate is the percentage of users who leave after visiting a single page. Single-page sessions / total sessions = bounce rate | Visitor retention metrics are usually presented as a retention report that shows unique visitors who returned at least once. | The number of times your ad is clicked divided by the number of times your ad is seen (called an impression). Clicks/impressions = CTR |
| Average Time on Single Page | Referrals | Usability | A/B Testing |
| The average of time all users spend on each web page. | Referral traffic comes from another site that has an outbound link to yours. | Ensuring your website functionality is fast and easy to navigate. | Tests two versions of a web page with users. |
Not all web analytics tools offer the same powerful features. It will take time to find the best one for your business. In the next section we discuss some of the most popular web analytics platforms.
How much do Web Analytics Tools cost?
A web analytics tool can range from free to well over $300 a month. There are outliers as well, such as Google Analytics. The free version of this Google platform is highly popular and widely used, but the 360 plan costs over $100,000 a year – making the paid plan viable only for very large enterprises. Many platforms also won’t offer upfront pricing, but there are still plenty that do.
When choosing the best one for your team, it’s important to consider whether you just need basic metrics or more powerful features like A/B testing and heatmaps.
Google Analytics
Special Note: Google Analytics free version (aka Universal Analytics) is switching to Google Analytics 4 on July 1st, 2022. In this section, we’re just talking about Google Analytics and Google Analytics 360. This is because there aren’t too many users of the new version yet and the main difference is Google Analytics 4 is just a faster, better version with updated machine learning and smoother integrations. For more information about Google Analytics 4 go here.
When you do switch over that does mean some setup on your part. The instructions for Google Analytics 4 setup you can find here. There will be a new version of Google Analytics 360 as well but it’s not available right now. Anyone can switch to Google Analytics 4 early before July.
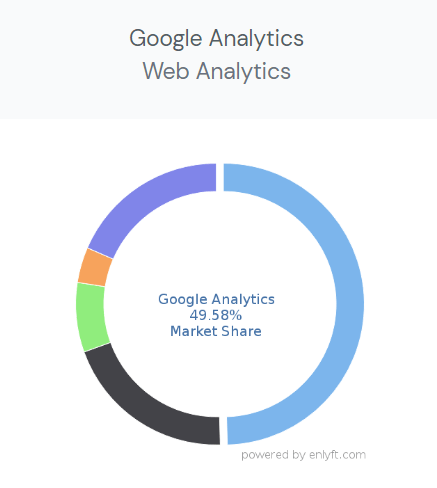
Google Analytics makes up literally half the entire web analytics market. We’re not exaggerating, they’re reported to have about 49.58% of market share. They are an absolute standard in most companies. Most business and tech blogs even offer resources about how to use Google Analytics.
The Google Analytics free plan is so easy to access, all Gmail accounts are able to set up an account. They have awesome analytics that any team of any budget can use. With the free version you have real-time data reporting, attribution, funnel exploration, and easy integration with Google Ads. You can even use them with your platform’s mobile apps.
| Google Analytics | Free | Google Analytics 360 |
| Cost | $0 | No upfront pricing*There is consistently reported pricing by other sources |
The fact that Google Analytics dominates the market is a double-edged sword. One issue is that the overwhelming reliance on Google Analytics can be especially limiting and problematic. Many who have used Google Analytics may want to find some alternatives but that’s hard when they are the most universal tool.
More problematic is that they keep the data they get from your website visitors and use it for various needs and purposes that aren’t entirely transparent. This can feel ethically compromising for some companies.
Another issue many have with Google Analytics, as we’ve mentioned, is that the next subscription up is Google Analytics 360. It comes with advanced analytics, BigQuery Export, and dedicated experts.
Google Analytics 360 does not have upfront pricing but multiple sources report the same yearly cost of $150,000 for their starting plan. The majority of enterprises that use Google Analytics 360 make between 1 million and 50 million in revenue. Smaller companies can be dwarfed in comparison. This high cost for small businesses is especially unnecessary when there are other platforms with more affordable plans.
For a quick overview of Google Analytics metrics see the beginner introduction below.
Adobe Analytics
Adobe Analytics offers web analytics software as part of their experience cloud. The analytics solution does not have any upfront pricing.
| Adobe Analytics from Adobe Experience Cloud |
| No upfront pricing |
Their web analytics tool can be used for intricate segmentation and predictive analytics. The tool goes beyond the metrics for page views and also encompases metrics for web traffic sources, site content, and engagement.
For data collection and real-time reporting they use machine learning and artificial intelligence. The main features of their analytics software are advanced segmentation with automated insights, traffic flow analysis with visualizations, and ad hoc analysis for customizable data tables.
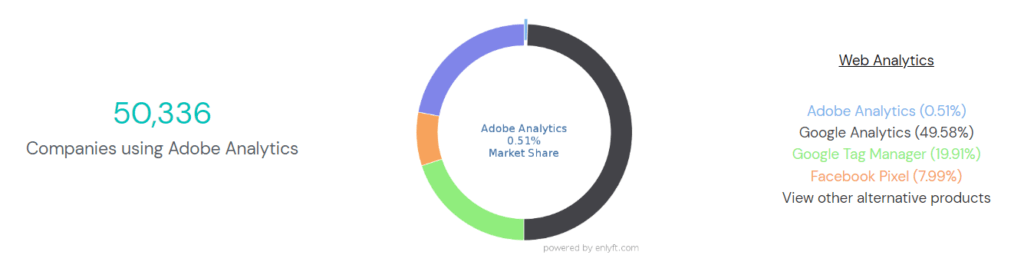
In comparison to Google Analytics they are only .51% of the market share. This doesn’t mean they have less quality by any means. One of the main reasons Google Analytics is so popular is because it’s free. Despite having a cost, Adobe Analytics is still used by over 50,000 companies and is one of Google Analytics’ most well-known competitors.
It becomes a challenge to figure out whether a software is your best fit when you can’t learn much about it. This is where reviews can shed some light, most importantly when it comes to customer experience. You can see reviews of the analytics product here.
The exact price of Adobe Analytics isn’t mentioned, but it’s been described as “not very budget-friendly.” Users have been overall satisfied with the features. The most common issue mentioned is the UI and the learning curve. Training on the software isn’t very user-friendly.
Some companies have said it’s “not as easily adopted as Google analytics.” You can view a direct comparison of Google Analytics and Adobe Analytics here. In terms of trScore they’re neck and neck, with Google Analytics at 8.6/10 while Adobe Analytics attained an 8.4/10 score.
For usability, online training, and implementation, Google Analytics does score higher with nothing below an 8. One colorblind user did note that the UI was quite bad for their accessibility. That same user still gave Adobe Analytics a 10/10 rating. This is because when it comes to features, users are happy with the complex analytics Adobe offers.
Google Analytics can easily meet the needs of startups, small businesses, and larger enterprises. Adobe Analytics on the other hand is best suited for large companies over small. This is because of the cost and the advanced features. Customer segmentation alone is ideal for major brands that need to monitor an extensive online platform, launch marketing campaigns, and build custom data projects.
For a peek into what using Adobe Analytics is like see the tutorial below. It covers their customer journey analytics.
KISSmetrics
KISSmetrics is a web analytics solution that is customer experience-focused. Like Adobe Analytics, they go past regular page view metrics like bounce rate and time on page.
The data collection is centered on the customer journey and provides behavioral insights that can flesh out each type of person using your site. This makes offering the best user experience for all your customers significantly easier because you personalize it for their needs.
You can even see cohorts for the unique visitors that spend the most money on your site. From there you can create profiles for the highest spending demographics and develop campaigns for that target audience. Teams can even tailor the web platform and social media to engage their ideal customers.
KISSmetrics offers upfront pricing for both SaaS and eCommerce use cases. The subscriptions have the same titles and prices and are almost identical, excluding small differences.
We are going to focus on the eCommerce plans and features. All plans are billed annually, not monthly. Each subscription has limits on the number of user seats, domains, populations and unique site visitors you can track.
| KISSmetrics eCommerce Plans | Silver | Gold | Platinum |
| Cost | $299/month | $499/month | Custom plan |
The Silver tier comes with 3 user seats, 1 domain, 10 different population cohorts, and up to 10K tracked users. The tracked users are for building profiles around real people who frequent your site. It even lets you search for specific site visitors so you can learn more about your customers faster.
The plan also has a number of reports with enlightening insights. These include activity, funnels, and paths. The visitor activity reports show customer trends. The funnel reports show conversion rates and checkout funnels, and the paths report breaks down the paths by channel and campaign.
Silver has up to 12-month data retention but doesn’t allow data exporting. In terms of support, you can only use email and there are no onboarding resources.
The Silver subscription is packed with useful analytics for small and medium teams. On the flip side, the larger your online presence is the less the plan can offer you. Web platforms that have more than 3 team members, 1 domain, and incredibly high volume traffic would be too limited.
For the Gold plan it jumps to up to 25K tracked visitors, 10 seats, 3 domains, and 20 different populations. This is definitely better for small businesses with a bigger audience across multiple websites.
The subscription even has the added benefit of reports for A/B testing, revenue, and cohorts. This gives you deeper knowledge about your customer base. You can then personalize your site with the testing data and see how it affects returning customer percentages.
This plan is definitely better for bigger teams that are also working on marketing campaigns and improving website design. It also comes with 24 months of data retention and data export options (the data export options have custom pricing so there is an undisclosed cost).
For support, you get email and chat and options to buy onboarding resources for your team (the onboarding costs are also custom).
When it comes to Platinum, everything is customizable including the price. It comes with all the same features in Silver and Gold but with a couple bonus features.
They offer power and SQL reporting and have more advanced support options. The power report allows you to see metrics segmented into tables and the SQL reports let you checkout cart metrics like abandonment rates. For support you have a dedicated account manager that can offer consistent and reliable guidance if you have issues.
This definitely is the recommended option for much larger companies with vastly different demographics that all visit at different times of the month. The complex customer base would need more attention and care to identify the types of customers and their needs.
This plan is best for those who want to be able to track all the different populations and unique spenders, while developing personalized campaigns to meet all the dynamic trends. It’s also best for companies that have strategy teams that can focus on special data like cart abandonment.
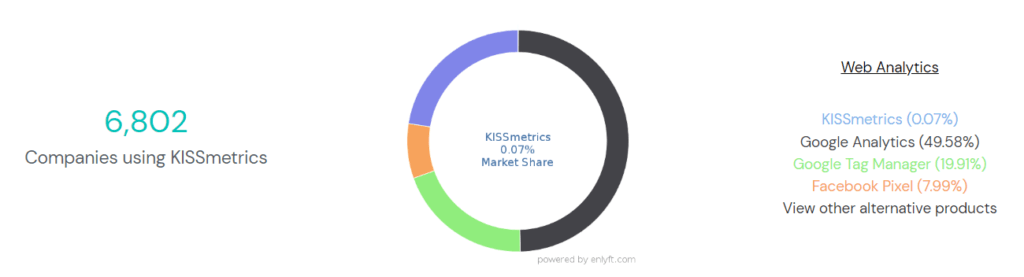
KISSmetrics’ overall reach as a web analytics product is only .07%, which is over 6,000 companies. Companies that are their top users, make as low as 500K in revenue to 5M in revenue a month.
They are less popular than Google Analytics but they certainly offer more complex data and reporting. KISSmetrics actually has their own comparison between them and Google Analytics that you can view here.
Their main point is Google Analytics customer data is anonymous to you and it’s not tracked across devices. This can be particularly frustrating because Google Analytics does have access to the real person data but what you receive is anonymous. For KISSmetrics, customer data is tracked to individuals persons across devices for a holistic perspective of your consumer base.
KISSmetrics is a great web analytics platform that is designed for developing the best customer experience to increase conversions. They are similar to Adobe Analytics because they are both focused on the customer journey. They also offer more information and pricing compared to Adobe Analytics.
If you want to see a comparison between Adobe Analytics, Google Analytics, and KISSmetrics you can go here. The comparison is based on user-provided data. You will see that Google Analytics does dominate in most categories but KISSmetrics ranked better than Adobe Analytics and Google Analytics for support and in-person training experience.
For a look at how to use KISSmetrics see the demo video below.
Crazy Egg
Crazy Egg is a website analytics platform specifically designed for A/B testing and heatmaps. You would use a platform like this to track user behavior and use the collected metrics to figure out their needs.
This is like the golden key for usability and web accessibility. You can find out if people are struggling with your navigation. You can also figure out why shoppers are having issues at checkout. You can essentially read their minds–or get as close to it as you can.
They also have their tracking tool Confetti for monitoring metrics like new and old visitors, referrals, search engines etc. These metrics aren’t as focused on customer profiles but they can show the journey that brought them to you.
This can give you valuable insights like whether most of your users come from Google, Yahoo, Bing or if it’s an even split. Then you can tailor your SEO to all applicable search engines.
Crazy Egg offers several affordable options. They are limited by the amount of pageviews tracked per month, snapshots, and recordings. All plans are billed annually, not monthly. Each subscription offers unlimited surveys, unlimited a/b tests, and unlimited websites.
| Crazy Egg | Basic | Standard | Plus | Pro | Enterprise |
| Cost | $29/mo | $49/mo | $99/mo | $249/mo | Custom plan |
The Basic options come with 30,000 pageviews, 25 snapshots, and 100 recordings per month. This is great for small teams with a manageable volume of web traffic. If you have a high volume of web traffic this is still a good sample size.
This plan isn’t ideal if you get 100,000 visitors a day. In that case you’d want a bigger test group. Businesses that have pretty diverse demographics will also want a wider sample size to observe and test.
For the Standard plan you get up to 75,000 pageviews, 50 snapshots, and 500 recordings a month. This is better for medium-sized companies and strong analytics and dev teams. With a sample size like this you can sift through reports and pinpoint many areas to improve.
Even if you did have pretty frequent and consistent web-flow you could still conserve time by using a smaller size so you don’t get overwhelmed with too much data. This can be especially helpful if the teams working with the data aren’t actually that large.
With Plus you jump pretty high and get 150,000 pageviews, 75 snapshots, 1,000 recordings. This is a great step up and can provide a large business with a plethora of data and testing. You also get priority support from Crazy Egg’s experts.
This is a pretty affordable step up for web platforms with a huge customer base that’s always growing. It’s not a good idea for startups and much smaller companies because of all the data you need to work with and the higher cost.
The Pro option is a great step up with 500,000 page views, 100 snapshots, and 5,000 recordings a month. If you have a large, dedicated team and an even more dedicated customer base then this needs your consideration.
With a sample size this large, you can gain super-diverse metrics on your users and make valuable changes to fit their needs. Teams that only have 500K or less visitors a month might find this to be overkill, especially with the cost.
Enterprise is a custom-made subscription tailored to your team. You choose what you need and experts help calculate the cost. It also comes with SAML single sign-on for added protection as well as onboarding and training.
Crazy Egg isn’t really comparable to Google Analytics or other web analytics solutions. They are mainly designed for observation and testing. You would use them if you have a strong strategy and dev team that implements and works on the testing for your site.
The video below is a tutorial on how to use and interpret Crazy Egg metrics.
Mixpanel
Mixpanel is a web analytics platform with features for monitoring user behavior. It provides you with data to help increase interaction and long-term retention. It’s not an A/B testing tool with heatmaps like Crazy Egg. It uses reports and simplified data to answer questions for you. The UI is designed to be beginner-friendly and help you create cohorts and funnels without SQL.
When it comes to subscriptions there are no seat limits. This is great news for larger teams interested in any of their affordable options. They also limit the number of tracked users per plan. If you are an early stage startup you might qualify for a free version of Growth for one year. You can find out more here.
| Mixpanel | Free | Growth | Enterprise |
| Cost | $0 | Starting at $25/mo | Contact Sales |
The Free tier starts you out with unlimited data history, core reports, and data monitoring with alerts. They collect data for 100K users a month. This is a pretty high sample size for a freemium version. The Basic plan for Crazy Egg only tracked 30K page views (not individual users).
The main limitation of this subscription is no advanced analysis like segmentation. They also limit your access with data modeling, exporting, and allow only 5 saved reports per team member. There are limited admin controls and no compliance options (HIPAA), or support aside from access to the community.
The Free plan is great for low budgets with a lot of data and information requirements. Metrics wise, it’s functional but not in-depth. This is not your best choice if you are a bigger company and need more complex metrics for projects, marketing, and to make necessary changes to your site.
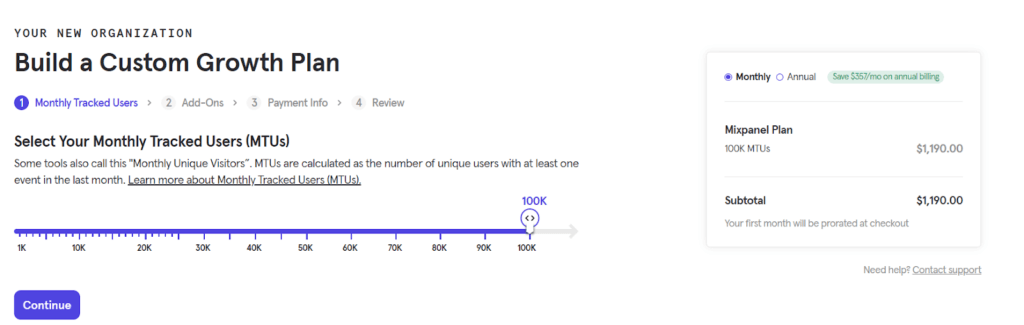
With Growth, you get the option to customize the number of monthly tracked visitors for your subscription. This means that even though $25 a month is the starting price, you could end up paying much more.
The tricky part is if you want capacity for over 100K visitors you need to contact sales.
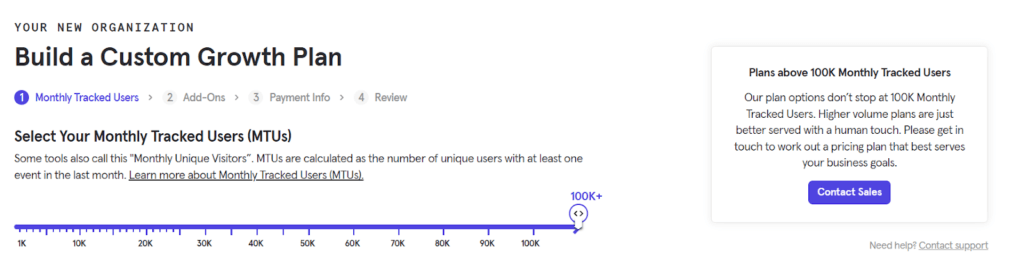
If you want up to 100K, you pay $1,190.00 a month.
The Free plan already has 100K built in so does not seem at all worth it when it comes to visitor numbers. The Growth plan does come with more features than Free so you can consider that as the main benefit. Growth has data modeling, no limits on saved reports, and data exporting. It also has extra protection with data including HIPAA compliance.
They have some admin controls but cannot limit viewing and querying. They do have email access for support during business hours. The Growth tier does not come with full advanced analytics but you can draw relationships and segment users. You just can’t experiment with the data or signal actions to track.
Growth offers quite a few awesome features even though the pricing can potentially get very high. The question you need to consider is do you need limited metrics collected from 100K users or do you need extensive metrics for 100K or less? If your budget can easily handle it then Growth is a good step up. If your company isn’t ready to spend an extra thousand or more a month then being frugal makes more sense. You can also always work with another free tool to fill in gaps.
When it comes to Enterprise, you can customize the plan and pricing. You can’t get a sneak peak into the estimate like in Growth; you have to contact sales. Enterprise has all features including full analytics, admin controls, and support. You also have the ability to include add-ons like live chat support.
Enterprise is mainly recommended for larger companies that need to track a big enough sample size for their high volume of monthly visitors. You can’t see the price but expect the end cost to be steeper.
For an overview of what it’s like to use Mixpanel see the demo below.
Matomo
Matomo is an open-source web analytics platform. You can use the On-Premise (downloadable version) that you set up with a server by yourself or you can use the Cloud version that they host. The download is free, the cloud version is a paid subscription.
| Matomo | On-Premise | Cloud |
| Cost | Free to Download | No upfront pricing until free trial ends |
The On-Premise choice allows unlimited websites, users, visitor segmentation, and raw data retention. You can save all report data and import data from Google Analytics.
The main drawbacks to the open-source version is that add-ons do cost an extra fee and require a subscription (just for the add-ons, you are not buying the entire cloud version). These additional features include metrics for site media, A/B testing, heatmaps, funnels, and cohorts. Features like those are pretty important and range from $89 to $229 a year.
This means that the open-source version doesn’t come stacked but it’s certainly worth it if you plan to use other tools like Google Analytics with it. You don’t have to worry about data retention or exporting because you own all your data. There may not be a plethora of features but you do have a lot of control.
For Motomo’s Cloud subscription you don’t get to see the cost until the free trial is over after 21 days. The plan comes with support and most of the special add-ons you would need to pay extra for with the open-source version.
The unfortunate part is it has more limits than the On-Premise choice. You can only have 30 websites and users. You can only create 100 segments, 150 goals, and have 24 months of raw data retention. These were all unlimited in On-Premise because you are the one storing the data.
When it comes down to it, you need to choose between special features and limitations. If you want full control and you have a tech-savvy team then the downloadable version is best. Teams with few technical skills that don’t want their own server will find the Cloud subscription much easier. You could also get both and have special features while not having to worry about data limits because you store all the info yourself.
Below is a quick introduction to Matomo so you can see the UI and how it’s used.
More Resources
If you want to see more website analysis tools we have a couple of different lists of software available. We offer related software under the categories of web analytics, digital analytics, conversion rate optimization, and eCommerce analytics.
We also recommend these articles for those that want to know more about web analytics. HubSpot’s blog has an awesome beginner introduction to web analytics and TechTarget is perfect for more in-depth learning. Clean.io’s blog goes into some major eCommerce benefits.
For those that have used any of the platforms discussed here please leave a review to help other buyers make informed decisions.
Was this helpful?

Looking for your next web analytics software? Click here to read REAL reviews from users like you!