
Have you ever thought about the amount of time that exists between one year to another?
Yes, the correct and smart-alecky answer is to say, “well, in fact, there are exactly 365 days between one year and another.” That’s all well and good and, of course, quite obvious. But the amount of stuff that occurs between each year is remarkable. Think about how different 2021 has been compared to 2020. Sure there are plenty of similarities, but the two years, truly, are vastly different.
How we behaved in the first half of last year versus this past Spring could even be described as polar opposites. With this in mind, we wanted to take a look into how consumption patterns have evolved.
Reviewing the H1 2021 Consumption Behaviors of IT Buyers
Recently, we studied the consumption trends of IT buyers from the first half of 2021—essentially, folks who are specifically working in IT roles. (Naturally, if you’re interested in some of the larger consumption trends, our 2021 State of B2B Content Consumption and Demand Report is a terrific resource. We’re also beginning to work on the 2022 version of that, so look forward to that sometime in early Q1.)
To do this properly, we analyzed our data as we normally would and then asked another industry leader to join us in discussing our findings. Along with myself and our Chief Strategy Officer, David Fortino, we were pleased to be joined by Tim Hayden, CEO of Brain+Trust Partners to ponder these behaviors, insights, and discoveries.
Analyzing The “What”
Before we get into some of the more personal identifying factors of these registrations, let’s start by examining some of the top-level traits of our findings.
Total Registrations
NetLine sees a ton of registration requests from the IT job area audience. Regardless of what or when we review information, this group is our largest audience by a wide margin. During the first half of 2021 this group represented 27% of all requests. While this audience’s consumption was largely even YOY, 2021 did see a very minor dip from 2020. And there’s a good reason for that.

“I think the one thing that’s interesting,” David Fortino said, “if we compared this [data] to 2020, that volume was a little bit greater due to the fact that there was a scrambling of sorts, as you can imagine due to COVID.”
Although IT audiences were always our largest audience segment in terms of content consumption, they were never put under the pressure that they were at that moment where every organization had to go fully digital. “A lot of organizations just clearly weren’t prepared to do so. “I think clearly, IT teams have settled into a groove now, and have understood what it takes to run an organization from that perspective,” David said. “So, their behavior, I suppose, from the content consumption side of things has kind of fallen back into the levels that we would historically have seen.”
Digitization is something that people across the organization are acutely aware of now. And with that, they are ever more curious and interested in what it’s going to take to accelerate the performance of whatever their job task may be.
Registrations by Topic
This segment of the analysis is a very interesting one. At the top of the list, we see Linux and cybersecurity and security in general, with data at the bottom. During our conversation, Tim Hayden mentioned the digitization of the world and its total impact on businesses across the board.
“I think there’s a number of trend lines that are parallel here,” Tim said. “There’s what we’ve already started to scratch the surface on with the pandemic and the acceleration of digital transformation projects of digitization initiatives.” Tim believes the other attraction to Linux comes down to the current aversion to big-box tech.
“I think people see Linux as an open standards platform where there is a tremendous amount of sharing of information on how to do things,” Tim said. “I think that is why we’re seeing [Linux] at the top of the list more than anything else is it’s an alternative to a lot of the off-the-shelf big tech that has been the object of most spend by both IT professionals and I think people across the marketing and customer experience communication suite who have in the last five to 10 years are spending as much on IT as somebody in IT is.”
David completely agreed with Tim’s assessment and continued with comments around some of the other topics on the list, specifically cybersecurity and data. “With employees going fully digitized and outside of the actual physical office environment, there was a whole new resurgence around what securing your actual data structure looked, like your data centers and so on,” David said. “And that wasn’t just about external threats, it was just simply about data leakage, compliance and so on, wherein the office, all of that was tightly controlled.”
Analyzing The “Who”
Now that we’ve reviewed the top level, let’s dig into the stuff that makes this study so intriguing: The more personal variables that begin to tell us “who” this audience is.
Registrations by Org Size
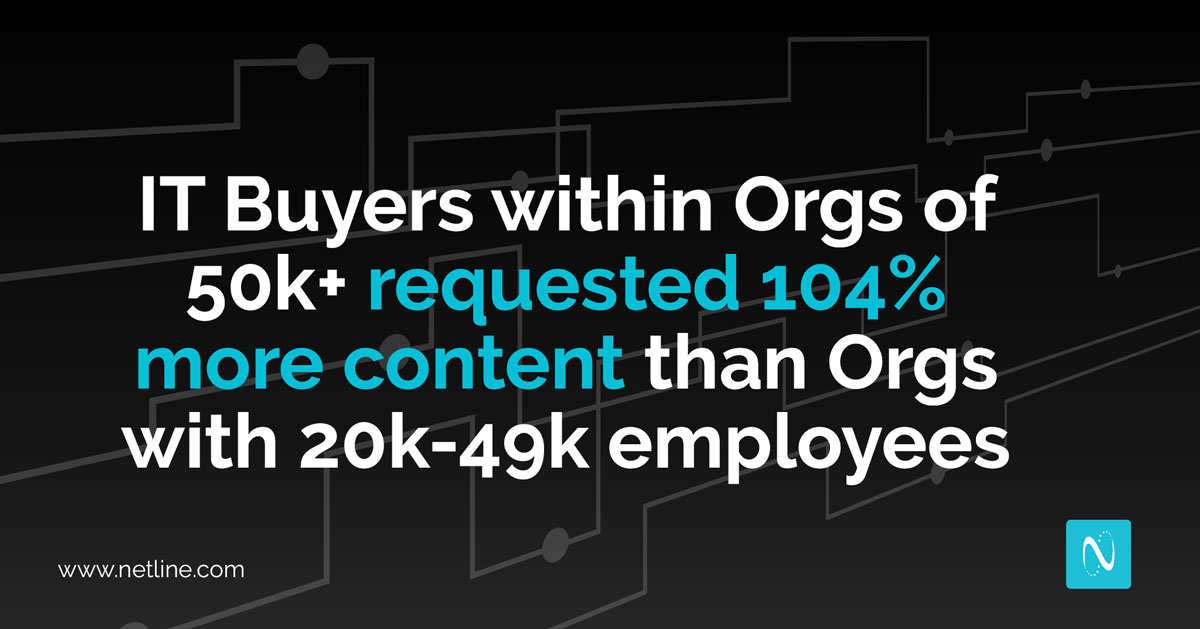
NetLine categorizes organizational sizes in 14 unique groupings, going from one to four employees and ending with the largest at 50K+. Considering the interest businesses have in reaching major corporations, let’s dig into the habits of the 50K+ audience.
IT Buyers working within organizations of 50K+ employees represented more than 10% of all consumption behavior. Compared to their most closely-related brethren, organizations of 50k+ requested 104% more content than did professionals from organizations employing between 20K and 49,999 people. Considering the players at the top of the food chain (Amazon, Walmart, Apple, etc.), there’s a lot to be intrigued by. Tim has worked extensively with some of the companies in those realms, so we asked him if there was anything from an IT standpoint that these businesses are specifically in the market for in the content world.
Dave mentioned this as well, but the distribution of the workforce, especially in larger companies, are the ones that have had to all of a sudden go from organizational development, HR policies to health policies and health protocols,” Tim said. “And with that, you’ve got the distributed workforce—they’re working remotely and they’re doing so on their own devices. That creates challenges with their own devices on their own home networks.”
Tim further highlighted that this kind of workforce distribution creates challenges for IT teams that are supporting specific business units under a tremendous amount of pressure when it comes to security. “I think business continuity for the people that are on the front lines of the business, whether that’s customer experience and customer or tech support, or if it’s something in the sales of the marketing function, [is very important].”
Registrations by Job Level
Everyone is always interested in reaching the most influential people in an organization. From the CEOs to SVPs and VPs, there’s nothing Marketers love more than trying to engage the people at the top. However, regardless of which industry we’re analyzing or which job area we’re looking at, Individual Contributors are always the largest representatives of all consumption.
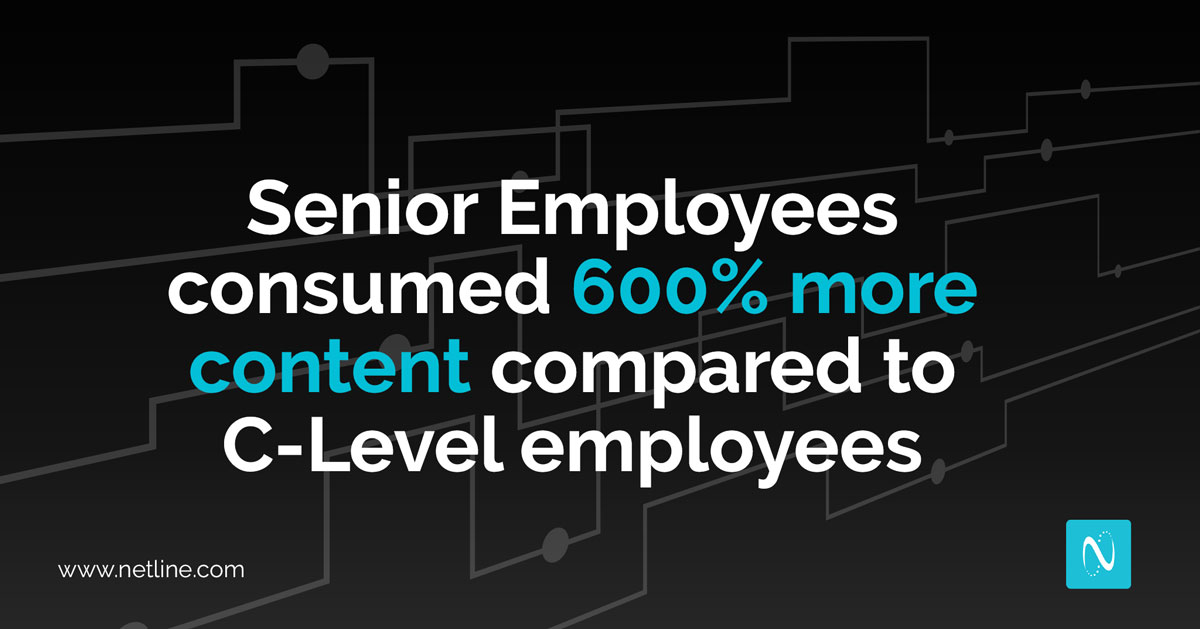
As we detailed in the 2021 Consumption Report, we saw a slight dip in overall C-level consumption. The folks who picked up that slack, however, were Senior Employees and Senior VPs. These pros consumed 600% more content compared to their C-level leadership.
“Although [C-Level consumption] fluctuates a bit YOY,” David said, “one commonality is that the C-Suite itself generally consumes in 10% to 12% of all content across our platform. So, putting that another way, 86% to 88% of content is not being consumed by the C-Suite. That, it then introduces that challenge, right? Where you’ve got Marketers with this preconceived notion that we need to enter the C-Suite, we need to be influencing these folks. Well, it turns out that they’re just simply not interested in engaging with your content, nor are they generally going to respond to your emails, especially marketing emails or phone calls.”
The main takeaway here is that regardless of market trends, influencing the influencers of the C-Suite is integral to driving customer penetration. “Whether you’re talking about digital innovation and rearchitecting a relationship with an organization, or you’re simply just trying to start first with a dialogue at a very painless entry point, trying to go through the C-Suite,” David said. “Unless it’s another C-Suite person forging that dialogue, it’s generally not going to happen.”
Registrations by Job Function
Here is where we end up seeing some of the differences between 2021 and the chaos that was the first half of 2020. IT systems management professionals consumed nearly 40% less content YOY. My theory is that because IT systems were put to their paces in the first half of 2020, these folks finally got a chance to take a breath.
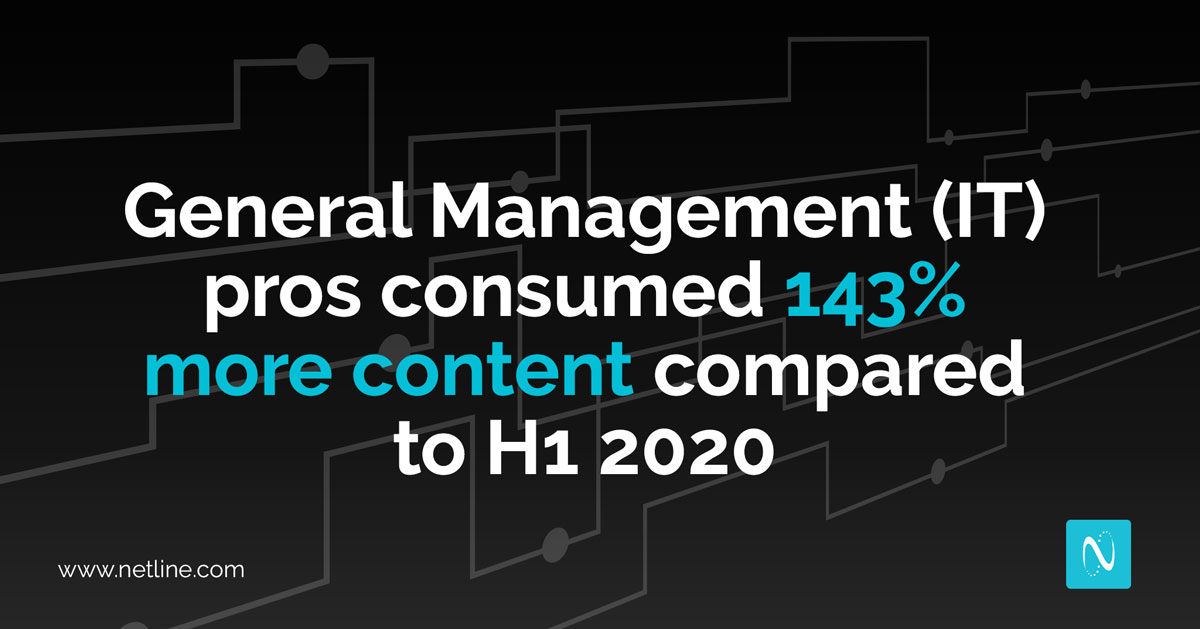
Comparatively, their counterparts in IT general management are now the ones who are now trying to figure out how to keep up with everything that has now been added to their plate. This effort to keep up lead to a nearly 143% rise in overall consumption from this group. As David shared, he sees this as a sign that businesses are now back in growth mode.
“People are planning for the future and it’s no longer about holding down the fort, right?” David said. “We’ve held the fort or we’ve lost the fort at this point. Business is always about the continuance in the future of wherever you’re going. Whether it’s fully distributed hybrid, you name it, but we are still charging ahead. And now, we’re getting back into research projects. We’re starting to understand where we need to spend allocation, R&D, and so on.”
Registrations by Sub-Industry
One of the most interesting insights we pulled from this report comes from direct real-world behaviors and how it is conveyed in content consumption.
What we observed last year during the initial COVID outbreak was that everything (from research collection to information distribution) was quite centralized and came from the top down. The federal government was the one dictating how new information was shared and how recommendations were shared. In 2021, as things have settled down and resembled a more normal atmosphere, that top-down dispersal has been left behind. As the collective dust has settled, decisions are being made by local and state governments. This is why consumption numbers have flipped.
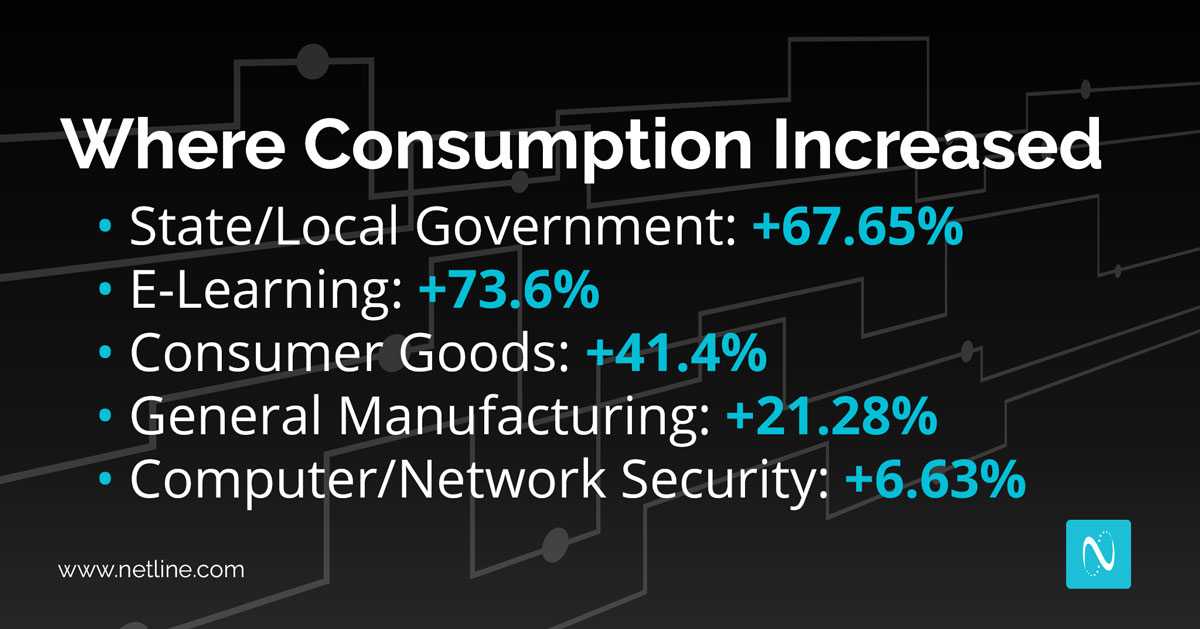
Here are some of the other highlights from this portion of the analysis:
- Consumption from the Consumer Goods audience was up
- Knowing that people have purchased so much in the last two years (it’s one of the reasons why we’re seeing all the different backlogs of goods in our shipping ports), it’s no surprise CPG brands have been digging into additional content—all of which ties directly into the increase in content consumption from General Manufacturing businesses.
- Knowing that people have purchased so much in the last two years (it’s one of the reasons why we’re seeing all the different backlogs of goods in our shipping ports), it’s no surprise CPG brands have been digging into additional content—all of which ties directly into the increase in content consumption from General Manufacturing businesses.
-
- Wine & Spirits Industry decreased
- One of the sub-industries David was most intrigued by was the decline of content consumption within the wine and spirits industry. “I’d love to read a little bit more into that,” David said, “but I believe alcohol consumption is still at record levels across the US still due to most post-pandemic experiences, yet content consumption has flatlined.” (As a note, we wrote a little bit about this in a guest post on the Marketing Insider Group blog last Holiday season. It’s well worth the read if you’re curious about last year’s incredible consumption behaviors from the Wine & Spirits industry.)
- One of the sub-industries David was most intrigued by was the decline of content consumption within the wine and spirits industry. “I’d love to read a little bit more into that,” David said, “but I believe alcohol consumption is still at record levels across the US still due to most post-pandemic experiences, yet content consumption has flatlined.” (As a note, we wrote a little bit about this in a guest post on the Marketing Insider Group blog last Holiday season. It’s well worth the read if you’re curious about last year’s incredible consumption behaviors from the Wine & Spirits industry.)
-
- The world of Agriculture
-
- Tim, however, was most intrigued by the world of agriculture. “What’s fascinating is that agriculture is one of those industries that we’ve been watching at Brain+Trust for several years,” Tim said. “It’s one of the first places that robots have really started to take over so much of the value chain of what happens in the field, what happens in the processing and packaging of produce. But again, from a general content consumption standpoint, especially that which would be IT related or directional in terms of how-to, cheat sheets, white papers, those kinds of things, the best guess that I could give you for both general agriculture and wine and spirits is that there was a whole lot of aggregation and centralization of the channels over the last two years, right?”
“It was more folks that were going to home delivery services, that were doing curbside pickup at the grocery store. And with that, folks are limiting their discovery to a menu, if you think about that real quick. They’re not being influenced throughout the week and building a shopping list the way they were before. I’m not saying that people don’t do that anymore, but they do less of it because they realize they need to go to the grocery store, and rather than being able to walk at a leisurely pace for an hour in the store and fill your basket with the things that are on your list and the things that are impulse, now, you’re more direct with it.”
- Tim, however, was most intrigued by the world of agriculture. “What’s fascinating is that agriculture is one of those industries that we’ve been watching at Brain+Trust for several years,” Tim said. “It’s one of the first places that robots have really started to take over so much of the value chain of what happens in the field, what happens in the processing and packaging of produce. But again, from a general content consumption standpoint, especially that which would be IT related or directional in terms of how-to, cheat sheets, white papers, those kinds of things, the best guess that I could give you for both general agriculture and wine and spirits is that there was a whole lot of aggregation and centralization of the channels over the last two years, right?”
Analyze Your Own Industry and Looking to 2022
Our special thanks to Tim Hayden of Brain+Trust Partners for his time and expertise.
The nuggets we extracted from the consumption behaviors of the IT Job Area audience during the first half of 2021 were enough for an entire report on it’s own. Considering there are more than 300 individual industries represented on NetLine’s platform, this likely means there’s a whole heck more data waiting to be unearthed that we simply cannot get to. Fortunately, Audience Explorer can, and given its unmatched power, you’ll be able to make incredible decisions for your business based on real-time, first-party consumption data.
Beyond that, we’ll be back for another round of breakdown in the coming months with the debut of our 2022 State of B2B Content Consumption and Demand Report for Marketers. There will be updates to all our historical tracking along with some of the latest insights we’ve uncovered from the last 12 months. We’re looking forward to bringing you that and more in the new year.