
Brandpoint’s distribution reports have been top of the industry for years, but we are always looking for ways to make our clients’ experience better.
We are excited to announce the launch of a brand-new distribution report model that has many new features to make readability and navigation more seamless than ever. Data from your brand’s distribution is a story we are excited to share, and this visual, immersive reporting experience should make it easier than ever to share your story.
Highlighting KPIs
You probably chose Brandpoint for a number of reasons, one of those being our guaranteed results. KPIs are everything when it comes to showing the success of a distribution campaign, so we made sure that your placement numbers, ROI and audience totals are front and center in big, bold font.
We also added a brand-new metric into our reporting: you can now capture what percentage of your placements retain your brand mentions. Brand awareness is huge in a distribution campaign, so we wanted to add another metric that represents your campaign holistically.
Get Out the Supersized, Interactive Map
We had a map to show placement locations before, but we upped the scale — big time. Our new XXL map is interactive, allowing you to zoom in and out, focus on individual states, regions or even on one specific placement.
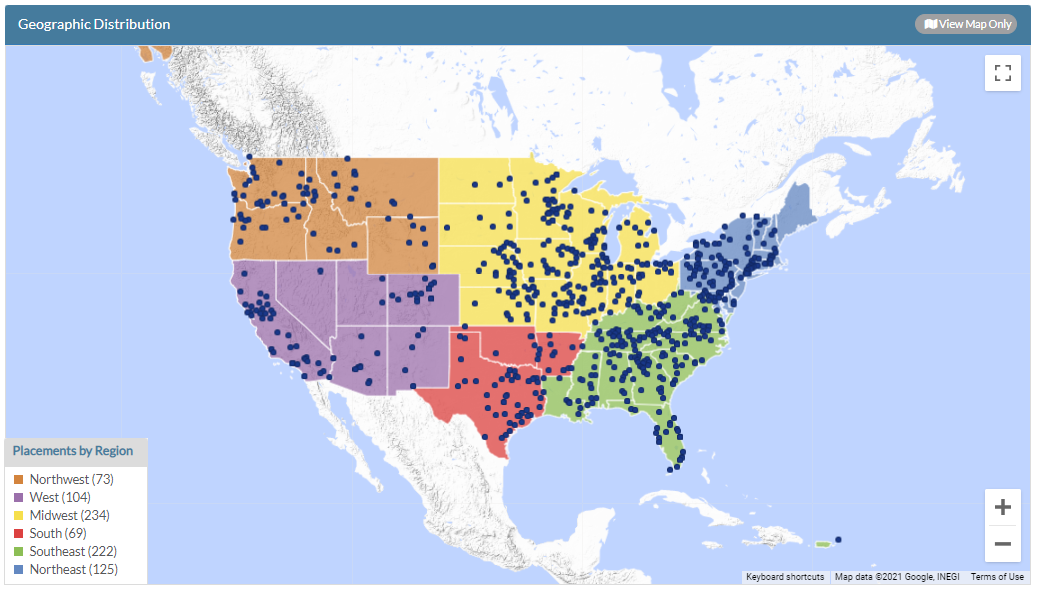
You can now hover over individual placements to see more information like the publication name, audience size and placement date. All of this gives you a more complete look at your success story. You can also click directly through to the placement online to easily view your story as it appears on publisher sites.
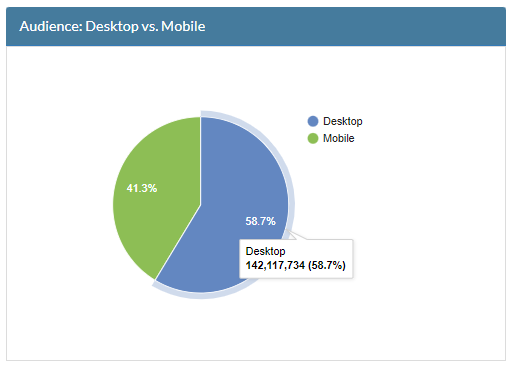
Telling Your Success Story Through Visuals
Arguably the best part of the new report is how visual and interactive it is, making it easy to share and explain results. We added a pie chart that breaks down audience metrics further by splitting site visitors into two categories: desktop and mobile.
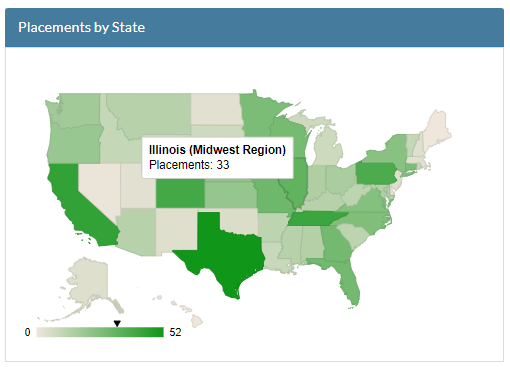
You can also hover over any state on the U.S. placement map to see how many placements you received there. It makes it easier to visualize where your content lives. Every online placement in your report will also include the media outlet’s logo, making it simple to identify the outlet and share it with others.
Our Premium Promotion Content All in One Report
Previously, our Guaranteed Traffic, Guaranteed Engagement, Guaranteed Section Front and Social Promotion campaign metrics lived in a separate report from the standard distribution. Now, everything is located in the same report, making it easy to see the impact and results of your campaign in one spot. These premium campaign metrics will still update after your promotion campaign has run its course, but now those metrics will load into the same spot as the rest of your campaign results rather than getting sent to you later in a separate report.
More on Guaranteed Traffic, Guaranteed Engagement, Guaranteed Section Front and Social Promotion
Our standard Guaranteed Media Placement options are great for distributing content and gaining brand awareness, but if you want to target specific audiences, locations and demographics, and measure metrics like engaged views and click-through rates, our Guaranteed Traffic, Guaranteed Engagement and Guaranteed Section Front services might be the right choice for you.
These premium offerings allow you to promote your content to targeted audiences on the publisher site. You can link your content to your article on the publisher site or to your brand’s landing page.
You can also choose our Social Promotion option, where the publisher site will post your content to their social media platform, giving you implied credibility because readers will see your content on news sites’ social media accounts.
Brandpoint offers measurements like impressions, average time spent on the article, engaged views and CTR rate. And the best part? All of this data that we gather from your campaign will live in this one new report where you can easily navigate and share your brand’s distribution story.
In a time where controlled media is hard to come by, this is a great way to gain brand awareness and drive traffic to either your company’s site or to your live article. And with more measurements than ever before, you can’t go wrong with a Brandpoint distribution campaign.
Easier to Read, Easier to Use
There’s a lot to love about our new reports and we are so excited to launch them this week. These reports are just another reason to choose Brandpoint for your distribution needs. Reach out for more information on starting a distribution campaign with us today.