3 Ways Generative AI Will Help Marketers Connect With Customers
3 min read


Fill in cell. Add row. Update column. New tab. Cross eyes. Rinse, repeat — 10 times a day. Sound familiar? I’ve seen countless businesses (including enterprise companies) compile — and try to analyze — sales data in spreadsheets like this. Sure, spreadsheets are useful for small projects, but they can be cumbersome when dealing with complex sales data.
Sales dashboards to the rescue.
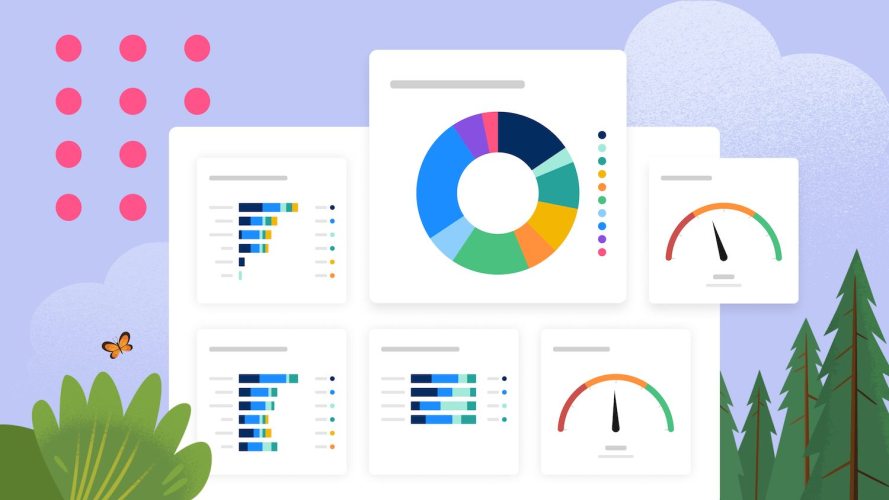
The right dashboards can automatically pull in, organize, and display your data in clear and useful ways, segmenting critical metrics by role with data updated in real-time so everyone can see the latest information. But not all dashboards are created equal. Below are a few specific types that I recommend to get a clear look at sales performance at every level — rep to sales org.
Hit your targets with data-driven selling guidance built directly into your CRM.


A sales dashboard is a visual representation — typically in graph or chart form — of sales metrics. Located within a company’s CRM or sales analytics software, it groups together related metrics for an “at a glance” look at progress toward sales goals. When used regularly, a dashboard can reveal where sales teams are performing well and where they need to improve.
In most cases, sales dashboards are created by sales managers, sales leaders, and sales operations teams, though reps can create dashboards to track their own accounts. The most versatile CRMs allow teams to share dashboards with others on the sales team and across the business for maximum visibility.
One dashboard I see a lot: A sales manager creates a team pipeline dashboard that includes the total number of leads generated by reps in a given quarter, the total number of leads in each pipeline stage, and the team’s conversion rate (percentage of leads that complete a purchase). With this information, the manager can forecast sales for the quarter and identify opportunities for coaching.
How you build a sales dashboard depends on the analytics platform you’re using, but there are a few common steps: Determine the goals and metrics you want to track, find a tool that allows you to track them, sync your sales data with the new tool, and build out the dashboards for your team.


The dashboards that give you the clearest picture of sales and business health are simple, visible across the sales org, and supported by real-time data. Here are the seven I use the most:
Who it’s for: Sales managers and executives
KPIs to include: Total team revenue, total deal amount in pipe, average quota attainment percentage, forecast accuracy (Can also include: Total new leads, employee satisfaction and turnover rate, calls booked by quarter/year, average team deal amount)
When to use: Daily or weekly
Why it’s important: Think of the state of sales dashboard as a command center. It provides a snapshot of all key metrics that affect team-wide sales targets. By knowing these, you can see signs that overarching sales strategy should be revisited, territories should be re-evaluated, or enablement efforts should be shored up.
Who’s it for: Sales managers and executives
KPIs to include: Team win rate, average deal amount, average sales cycle length, total pipeline value
When to use: Weekly
Why it’s important: Think of this dashboard as a weather report for your sales team. Based on the latest sales data, it can determine whether or not you’re likely to hit your overarching sales goals and coach up your reps against any potential storms. I recommend checking it weekly to spot any problems, like low lead volume or unusually long sales cycles, that might keep you from hitting your topline sales goals.
Who it’s for: Sales managers
KPIs to include: Conversion rate, total revenue generated, quota attainment percentage, activity engagement, opportunities in pipeline, customer retention rate, potential risks and neglected accounts (Can also include: Leads generated, opportunities in pipeline, average deal amount, sales cycle length, and activity metrics like calls made or emails sent)
When to use: Daily or weekly
Why it’s important: Rep performance is most accurately measured by three key metrics: conversion rate, total revenue generated, and quota attainment percentage. When you combine these on a dashboard and view them relative to previous months, quarters, or other reps, you can see whether a rep is underperforming, performing as expected, or excelling. The other metrics noted here, like leads generated and average deal amount, can be early warning signs of neglected deals and that key performance metrics will be off. When these are below benchmark, it’s a good time to dig into calls and processes to find coaching opportunities.
Who it’s for: Sales reps and managers
KPIs to include: Number of new leads, new pipeline generated, quota attainment percentage — all by rep (Can also include: Activities logged and service level agreement compliance rate)
When to use: Quarterly
Why it’s important: Most reps I’ve worked with are competitive. They’re motivated to beat their teammates by winning more or bigger deals. By displaying your reps’ performance for the whole sales team to see, you encourage them to push for the top of the leaderboard. Encourage a little healthy competition by offering added incentives for those who hit the top of the leaderboard by quarter’s end. An added plus for managers: This dashboard reveals which reps might need extra coaching.

3 min read

6 min read
Who it’s for: Sales managers and executives
KPIs to include: Win rate or loss rate, win/loss trends over time, churn rate
When to use: Quarterly
Why it’s important: When setting up this dashboard, make sure you add filters for industry, business size, or other dimensions so you can see where your products/services are resonating and where they’re falling flat. With this info, you can take a close look at your sales strategy and adjust product positioning for your target market.
Who it’s for: Sales reps and lead generation teams
KPIs to include: New outbound leads (from prospecting), new inbound leads (from marketing or advertising efforts), win rate by lead type
When to use: Weekly
Why it’s important: With a closer look at the source of the leads you’re bringing in and whether or not they’re converting, you can see the effectiveness of your prospecting and marketing efforts. Concentrate on the channels that bring you highly qualified leads that are likely to close and drop the leads that never make it through the pipeline.
Who’s it for: Sales managers, sales reps, and marketing teams
KPIs to include: Total pipeline value, pipeline growth rate (quarter over quarter), conversion rate (Can also include: Pipeline velocity, or how quickly a lead makes it through the pipeline, and target vs. actual pipeline)
When to use: Weekly
Why it’s important: For every business, a pipeline value-to-sales ratio is critical for hitting targets. The typical standard is typically 3:1, but this ratio changes depending on your industry and need. Whatever it is, this dashboard helps you keep an eye on your team’s pipeline to ensure you have enough deal dollars in the works to hit your sales targets. For instance, if you’re aiming for $2 million in revenue, you’d probably want to see a $6 million pipeline. In short, if your pipeline value is low, you’re unlikely to hit targets, so it’s probably time to start ramping up prospecting.
Setting up dashboards is just the beginning. Once you have these dashboards in place, it’s crucial to review and update them every quarter to ensure their relevance. This regular maintenance allows you to get the most out of your tools, ensuring that your sales reps, managers, and leaders continuously receive the insights they need to succeed and close deals faster. But don’t worry, it’s a heck of a lot easier than viewing those metrics in sheet after sheet of rows and columns.
We’re building the largest and most successful community of sales professionals, so you can learn, connect, and grow.


Get the latest articles in your inbox.