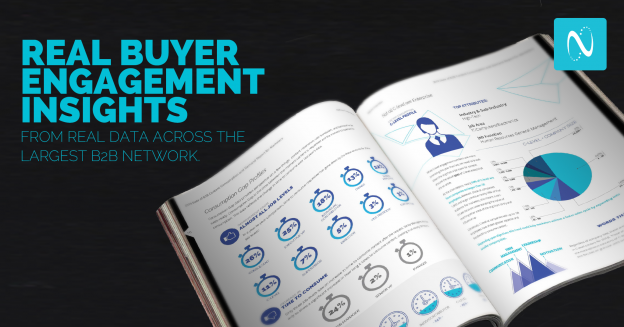
Every year, we spend weeks scanning a year’s worth of data from millions of downloads across our network. While that sounds like a lot of number-crunching for the B2B marketer, we did all the work making it digestible and useful. This data reveals one-of-a-kind insights year over year about how professionals are engaging with content throughout the buyer’s journey.
Just when you think you’ll be sharing updates on the same ‘ol trends, poof, the script has flipped, and we start pontificating about why people do things. The output of that combo is the 2019 State of B2B Content Consumption and Demand Report. If you’re just too antsy to navigate 17 pages of thoughtfully curated insights, check out the rest of the blog instead. I won’t even be upset. (*little upset, but I get it*)
How much data we talkin’?
When you’re the type of company that sits atop a treasure trove of first party data, do you hoard it and jump around in it like Scrooge McDuck or do you share the wealth and help B2B marketers win? We’re talking 4 million downloads across the globe and 300+ industries. Breaking it down further, there are filters like company size, job area, industry, sub-industry and so on, creating a myriad of combinations that reveal trends. There’s also the content itself; see what’s trending in titles and content types that were consumed by in-market professionals actively consuming content that aims to solve a problem or answer a question.
The Report follows the general structure of analyzing data “By the People”, “By the Company” and “By the Industry”. Each section is just a slice of the most important insights that emerged from the data and offers useful takeaways marketers can put to use right away. No squinting at charts and going, “Ok, what?” You actually get distilled, useful info from all of this first-party data.
And, while we love the value of polling marketers on what they’re up to, this isn’t one of those reports. It’s all based upon NetLine’s unique position in the martech space as the largest B2B buyer engagement platform, via content-centric lead generation.
Remember this?

By the People
Quality over quantity reigns supreme when looking at the consumption data by job level. An interesting and unusual shift has occurred when comparing to prior year’s data. Users are faster to consume content they’ve requested, but are taking longer to return for more:
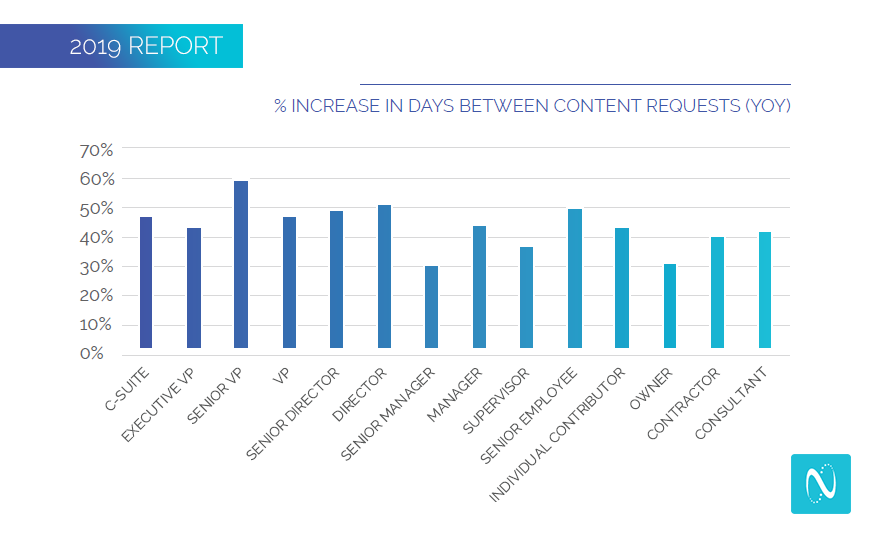
This chart depicts the increase in time between content requests. Aligned with the significant improvement in Consumption Gap (time that passes before consuming requested content), we’re left with the conclusion that users are becoming more discerning and savvier about what they request and how they dedicate their time to consuming that content.
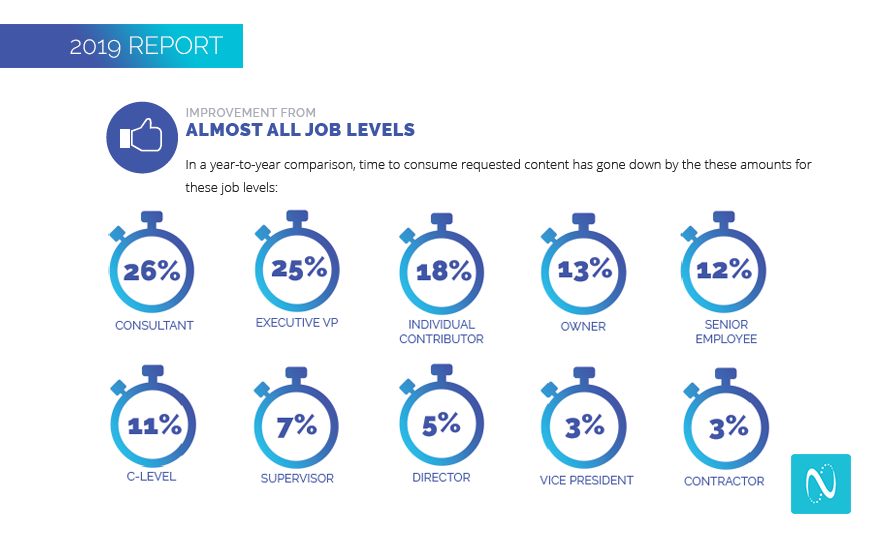
Meanwhile, marketers are more calculated with how they target their campaigns through more concise filters, and creating titles, graphics, and overall content that speaks to buyers in a way that resonates. Accelerating that window between engagement and consumption can have significant impact on sales follow-up and nurture tracks. Check out the job levels that showed an improvement in Consumption Gap:
So, marketers basically nailed it this year with how they approach buyer engagement. While it might seem discouraging that users are taking longer to come back for more, marketers and sales orgs benefit from less repetition to achieve a marketing qualified lead. That’s ideal!
Before we jump on our soapbox about the benefits of CPL vs. CPM marketing channels, let’s dive into the next section…
By the Company
Trends confirm there is no single leader for most targeted company size. Rather, a mix of either large enterprise orgs or SMBs led the march. From one end of the spectrum to the other, both Enterprise and SMB audiences show high engagement with content consumption; making things more interesting, marketers’ expectations of company size, company revenue overlap at the mid-market level.
Unsurprisingly, employee size and revenue boast a positive correlation, showing that targeting expectations align with larger company = more revenue.
Putting the information in the report to practical use, marketers can align their expectations with their objectives for better filtering. In combination with the knowledge of the breakdown by people and industry, dots begin to connect on how to reach your desired target. For example, reaching a highly-engaged C-suite exec is ideal but do company size and company revenue reflect the type of buyer you want to reach? [Pause for “hmmm”, thinking face.]
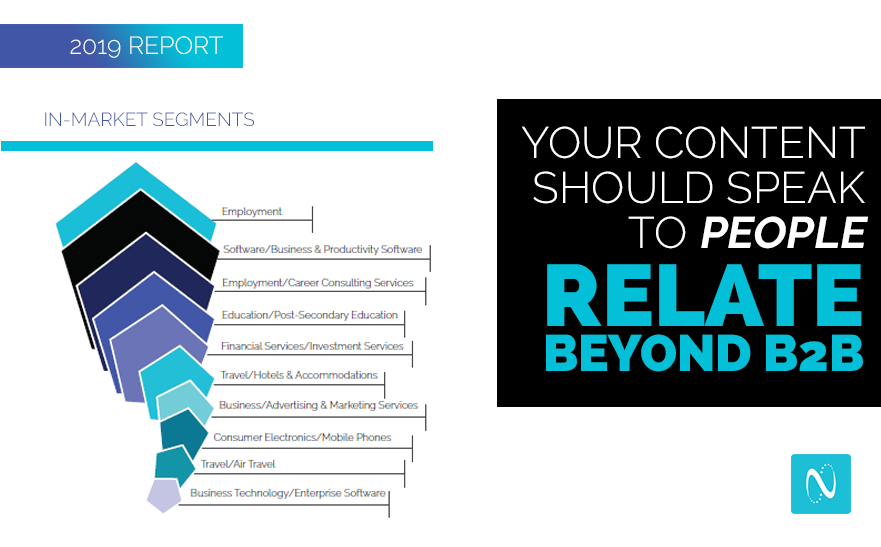
By the Industry
In addition to a breakdown of the top industries (which you can find in the report), we did some analysis of job areas versus sub-industry to help marketers with profiles and content creation. Understanding what users “look like” in greater detail can provide a more realistic view of how professionals align with filters and what their roles involve.
Taking a deeper dive into sub-industry filters helps marketers build more concise targeting strategies, leveraging content that speaks directly to potential buyers. Personalization has been a massive push for content marketing strategies and this insight promotes building more a more humanized approach.
Humanizing the data
In the midst of first-party buyer engagement activity on this scale, the report doesn’t let marketers forget a crucial component: humanizing the data matters. Real-world decisions are made from people who have interests outside of technical and business-related topics. Enhancing content resonance comes from incorporating lifestyle factors into your content strategy. Coming back to the stand-out statistic proving professionals want quality over quantity, marketers can maximize engagement by developing content that is both informative and enjoyable.
A holistic view of buyer-engagement activity
Throughout the report, the data brings forth a recurring fact that should not be carelessly tossed aside. Raising a hand for content is inherently more indicative of engagement and intent, while revealing the user’s stage in the buyer’s journey. The solution for assessing readiness to buy and improving conversion is found by applying the data-backed insights and action steps to your content marketing and lead gen strategy. While every company has unique objectives and goals, a holistic view of buyer-engagement activity at this scale builds a foundation for success.
If you got it, flaunt it. Right?
That’s how we feel about our stacks-on-stacks of data. This in-depth research transformed into actionable takeaways is the only way to do right by the monumental insight we have into buyer-engagement activity across all job levels, company sizes and industries.
Year-to-year, the surprising analytics and trends uncovered from our network, the largest B2B buyer engagement platform, help marketers build a data-centric approach to content marketing and lead generation. The “hacks” and “must-haves” of last year may no longer be relevant in the ever-evolving digital marketing world. From content creation to campaign execution, data can and should be your reliable confidant.
Gain a competitive advantage with our 2019 State of B2B Content Consumption and Demand Report. If you’re a no-nonsense, data-minded marketer with a fearless determination to navigate the complicated content consumption ecosystem and drive lead gen success, look no further. Let this first-party data lend a strong helping hand in building and optimizing your strategy.
The 2019 report is yours for free, check it out.