
.jpg?width=60&height=60&name=%D7%A6%D7%99%D7%9C%D7%95%D7%9D%20%D7%A9%D7%99-%D7%9C%D7%99%20%D7%A2%D7%95%D7%96%D7%99%D7%90%D7%9C%20(91%20of%20295).jpg)
LinkedIn's lead conversion rates are three times higher than other major ad platforms, so with over 800 million members comprised mostly of professionals and business decision makers – running B2B campaigns on LinkedIn should technically be a guaranteed lead-bonanza. Right?
Well, maybe.
The smarter way to get the most out of your efforts on this remarkable platform, is by A/B testing LinkedIn ads.
A/B testing LinkedIn ads is exactly the kind of hack that can take your marketing efforts to the next level, and it’s actually a lot easier than you think to get the hang of it.
Eynat Furer, Marketing Envy
The first step in every A/B test should be to determine its goal, and decide how to measure its performance and what will constitute ‘success’.
Common factors that indicate whether a campaign is successful include:
- Volume of leads and Cost per Lead (CPL) where the idea is to achieve a higher number of leads (both general and quality leads),
- Proportion of MQLs/SQLs higher number of content downloads per MQLs and SQLs, optimal cost per lead/MQL, etc.
- For video campaigns – a success indicator might be how much of the video was watched (what percentage of viewers watched the whole ad versus only partial views)
- For an ad that includes a lead-gen form – the better the completion or signup rate, the more successful it is.
Budgeting for your test
It’s always good practice for every marketing team to have a PPC campaign budget for ongoing campaigns and a dedicated budget for testing. We recommend that about 20% of the total budget is allocated to testing new channels, geographies and tools, but this allocation may vary based on business priorities. (You can read more about how to plan your B2B marketing budget like a CMO pro, here).
Four steps to creating effective A/B tests for your LinkedIn ads
1. The key to a successful A/B test is to change just a single variable for each test.
Choose one ad to be the ‘A’ ad. This will be both your primary ad and the ‘control group’, so it should be one that’s worked reasonably well for you in the past. This can be either because it displays the messaging that has traditionally resonated best, or because it includes keywords that have been proven to be most effective in the past.
2. Next, decide which variable to test:
- Target audience – Although this sounds self-explanatory, there are various identifiers for members of your audience that might yield different results. For example, you can target them by job function, or skill, or some sort of demographic, etc. – all of which might influence your ad’s conversion rate.
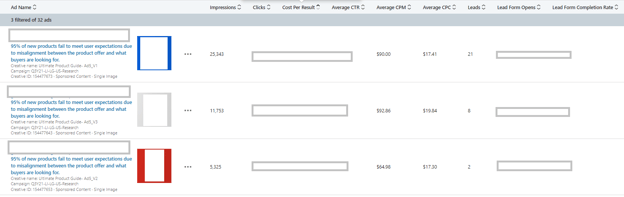
- Images – Users tend to scan visuals first, followed by the introductory text, then the headline and finally the CTA. Traditionally, changes in the graphics – such as using different images, image sizes or colors – have the biggest effect on the way your audience interacts (or doesn’t interact) with your ad.
Example #1: We ran tests using three ads with identical text and graphics, but with a different background color on each ad. Blue was the clear winner, generating 21 leads at $108.62 per lead. White came in second with eight leads at $136.42 per lead, and red was the loser, generating only three leads at $173.02 each.
We then ran additional A/B tests only using only the ad with the blue background, to see if we could optimize it even further.
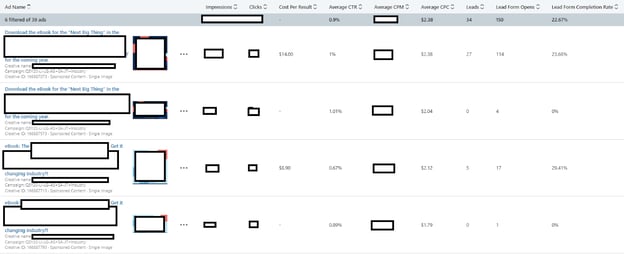
- Ad size – Different size ads may produce different results
Example #2: We wanted to A/B test an ad for an ebook targeted at the beverage industry, so we created two sets of ads, with each set comprised of two ad sizes – one rectangular and the other square. In both cases, the square came out on top:
- The first set of ads generated 27 leads at $14 per lead for the square, versus no leads and very few clicks for the rectangle.
- The second set of ads generated 5 leads at $8.90 per lead for the square, versus no leads for the rectangle.
The obvious conclusion (other than “it’s hip to be square!”) was that the first set of ads outperformed the second set.
- Text – Experiment with different text in the image, headlines, or CTA, but always be mindful of the target audience and the sort of language they’re most likely to respond to.
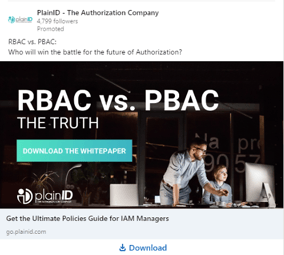
Example #3: Different CTAs, for example, can have a huge effect on response rate, like in the two ads we experimented with below, one with the CTA “Download” and the other “Sign up”.

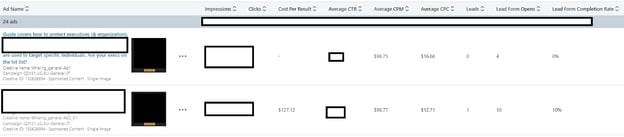
Example #4: In an A/B test for another ad, we kept the same creative but changed the text. Again, there was a clear favorite, with ad ‘A’ producing no leads but at a CPC of $16.66, and ad ‘B’ producing one lead at a CPC of $12.71. When doing an A/B test you would aim for a high statistical significance in your difference before drawing concrete conclusions.
- Other variables to test: Other elements to A/B test might be a video versus a static image, or if your ad includes a form, you could test different versions to see which performs best.
3. Decide on a budget and duration for the A/B test.
Keep in mind that a minimum sample size is required for the test to be effective. The ideal is 50k users, but B2B ads usually don’t get anywhere near that, so smaller samples are used.With a smaller than ideal sample size, deciphering the results is as much an art as it is a science, but experienced PPC managers can generally evaluate them and decide whether they’re significant enough to be able to make a call one way or the other.
4. Analyze the A/B test results and run with the best-performing option to maximize your ROAS.
A successful test should produce statistically significant differences between the two options (our rule of thumb is at least a 20% difference in campaign performance).Presuming that your test has generated some clear differences, the final step is to examine how each ad performed – including cost per click, conversion rates, CTR and which ad generally did a better job of accomplishing its original goal – and then make additional changes based on the results, integrating what you’ve learned.
The value of running ongoing A/B tests for your LinkedIn ads is that with constant optimization, eventually you’ll hit a ‘sweet spot’ for certain ad types that clearly perform fantastically for your business and your target audience. If you’re going to spend money running LinkedIn ads at all, thenusing ad formats and variables that have been demonstrably effective for you based on A/B tests, is the smartest and most cost-effective way to drive as much value out of them as possible.
Not all B2B marketers have the time to run their PPC campaigns themselves. When that happens, savvy marketers will often outsource their ad management to a PPC agency for startups. Get in touch with Marketing Envy for LinkedIn marketing wisdom and guidance, or to explore how we can help your business with PPC lead generation.
PS: If you found this helpful, I'd really appreciate it if you can click here to share it on Twitter - besides helping my ego, it's just fun to get notifications 😉

.jpg?width=112&height=112&name=%D7%A6%D7%99%D7%9C%D7%95%D7%9D%20%D7%A9%D7%99-%D7%9C%D7%99%20%D7%A2%D7%95%D7%96%D7%99%D7%90%D7%9C%20(91%20of%20295).jpg)