Meta-Analysis in Online Controlled Experiments: An Unbiased Look at the Power and Limitations of This Scientific Method

How useful is meta-analysis in A/B testing and other online experiments?
Is it helpful for leveraging past learning to improve your hypothesis generation? Or is meta-analysis just a lazy excuse to simply rely on “proven patterns” instead of building on situation-specific data to innovate within your business through experience?
This is a hot debate topic. Some are for it, and some are heavily against it. But how can you benefit from both viewpoints and bring tangible value to your experimentation program?
That’s what this post is about. In it, you’ll
- Understand what meta-analysis actually is
- See examples of meta-analysis in action
- Discover why meta-analysis as a concept must be treated with caution (and respect), and
- Learn how experimentation teams can do meta-analysis the right way
And with a bonus: You’ll also see two well-known conversion rate optimization experts discuss this from opposite ends.
Let’s get into it.
What is Meta-Analysis?
Meta-analysis uses statistics to make a decision from analyzing multiple experiment results. It comes from the scientific world, where researchers pool together results from medical studies addressing the same issue and use statistical analysis to judge if an effect is really present and how significant it is.
In online controlled experiments, where we have A/B testing, multivariate testing, and split testing for decision making and finding top-performing ways to drive business goals, we’ve borrowed meta-analysis to leverage what we’ve already learned from previous tests to inform future tests.
Let’s see different examples in the wild.
Examples of Meta-Analysis in Online Controlled Experiments
Here are 3 examples of meta-analysis in A/B testing, how it was used, and what was found in each effort:
- An empirical meta-analysis of e-commerce A/B testing strategies by Alex P. Miller and Kartik Hosanagar
This A/B testing meta-analysis was published in March 2020. The analysts studied tests specifically from the e-commerce industry, with data they collected from a SaaS A/B testing platform. It consisted of 2,732 A/B tests conducted by 252 US-based e-commerce companies across 7 industries in a 3-year span.
They analyzed these tests to provide a robust analysis of how tests are positioned at various stages of the e-commerce conversion funnel.
What they found was:
- When compared to other experiment types, the tests on price promotions and those positioned on category pages are associated with the largest effect sizes.
- Evidence that consumers’ response to different promotions depends on where those promotions are positioned within the e-commerce site.
- While promos regarding product prices are most effective early in the conversion funnel, shipping-related promos are most effective late in the conversion funnel (on product pages and checkouts).
Let’s look at another example and what the researchers found…
- What works in e-commerce — A meta-analysis of 6,700 experiments by Will Browne and Mike Swarbrick Jones
With data from 6,700 large e-commerce experiments mostly in the retail and travel sectors, Browne and Jones researched the effect of 29 different types of changes and estimated their cumulative impact on revenue. It was published in June 2017.
As the paper title suggests, the goal was to explore what works in e-commerce by running a large meta-analysis. That’s how they could arrive at this powerful summary: that changes to the site’s appearance had a far more negligible impact on revenue than changes grounded in behavioral psychology.
The revenue per visitor (RPV) metric is used to measure this impact. So, in their results, a +10% lift from an experiment means the RPV rose by 10% in that experiment.
Here are some other findings from the analysis:
- The best performers (by category) were:
- Scarcity (stock pointers, for example, “Only 3 left”): +2.9%
- Social proof (informing users of others’ behavior): +2.3%
- Urgency (countdown timers): +1.5%
- Abandonment recovery (messaging users to keep them on the site): +1.1%
- Product recommendations (upsells, cross-sells, etc): +0.4%
- But cosmetic changes to the UI such as the ones below weren’t effective:
- Color (changing the color of webpage elements): +0.0%
- Buttons (modifying website buttons): -0.2%
- Calls to action (changing the text): -0.3%
- 90% of experiments had less than 1.2% effect on revenue, positive or negative
- Little evidence that A/B tests lead to double-digit increases in revenue commonly featured in case studies.
Now wait. Before you take these meta-analysis results as gospel, you need to know that meta-analysis of online experiments has limitations. We’ll get into this later.
- Meta-analysis of 115 A/B tests on GoodUI.org by Georgi Georgiev
In June 2018, online experimentation expert and author of “Statistical Methods in Online A/B Testing”, Georgi Georgiev, analyzed 115 publicly available A/B tests on GoodUI.org.
GoodUI.org publishes a collection of experimentation results, including newly discovered UI patterns and what experimentation-driven companies like Amazon, Netflix, and Google are learning from their tests.
Georgi’s goal was to collate and analyze this data to reveal the average outcomes of the tests and contribute ideas about better statistical practices when designing and conducting a meta-analysis of A/B tests.
He started by pruning the initial data set and doing some statistical adjustments. These included removing:
- Tests with imbalances between the number of users sent to experience the control vs those sent to experience the challenger, and
- Compromised tests (spotted by their unrealistically low statistical power).
He analyzed the remaining 85 tests and found that the average percentage lift was 3.77% and the median lift was 3.92%. Looking at the distribution below, you’ll see that 58% of the tests (that’s the majority) had an observed effect (lift %) between -3% and +10%.
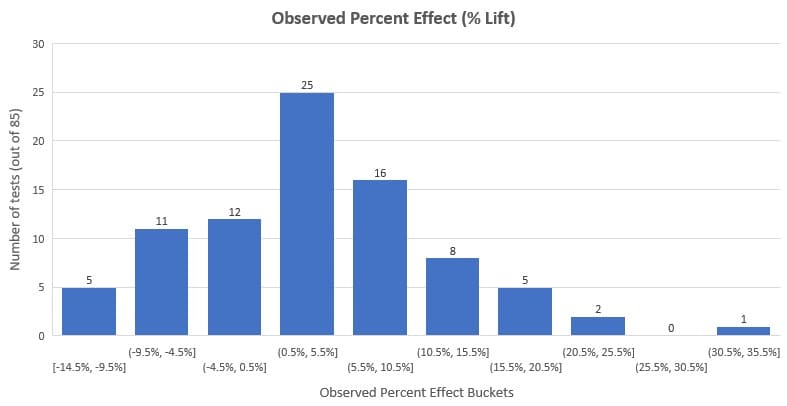
It’s important to note that this represents this data set and not all A/B testing that’s ever been done. Plus, we have to account for publication bias (one of the drawbacks of meta-analysis we’ll discuss later).
However, this meta-analysis is helpful to conversion rate optimizers and other optimization stakeholders to have a sense of what the external benchmarks are in A/B testing.
Interested in Conducting Your Own A/B Testing Meta-Analysis?
You get access to the same data set Georgi used. It’s publicly available on GoodUI.org — a repository of distilled results from A/B tests conducted across platforms, industries, and for different core problems.
There are other collections of A/B testing results like this (you can even create yours by pulling in data from numerous A/B testing examples and case studies ) but GoodUI is unique. You get additional statistical information about the test that is otherwise impossible to difficult to get if you’re surfing and collecting case studies.
A few more things make GoodUI unique:
- It doesn’t discriminate on the basis of experiment results. It includes winning, inconclusive, flat, and negative tests to combat publication bias in meta-analysis, which is a real problem, as stated in “Meta-analysis, funnel plots and sensitivity analysis” by John Copas and Jian Qing Shi.
Publication bias is a preference for publishing small studies if their results are ‘significant’ over studies with negative or inconclusive results. You cannot correct this without making untestable assumptions.
- GoodUI goes a step further. Often meta-analysis results lie buried in research papers. They hardly ever make their way to practical application, especially for experimentation teams that aren’t extremely mature.
With the GoodUI patterns, it is possible for curious optimizers to dig into the observed percentage change, statistical significance calculations, and confidence intervals. They can also use GoodUI’s assessment of how strong the result is, with possible values of “Insignificant”, “Possible”, “Significant” and “Strong”, going in both directions for each conversion pattern. You could say that it “democratizes” insights from meta-analyses of A/B tests.
- However, there is an issue here. Experimenters who might not be aware of the issues plaguing meta-analysis—heterogeneity and publication bias—plus the fact that meta-analysis results depend on the quality of the meta-analysis itself, may veer into the territory of blindly copying the patterns.
Rather, they should conduct their own research and run their A/B tests. Failure to do so has of late (rightly) been cause for concern in the CRO space.
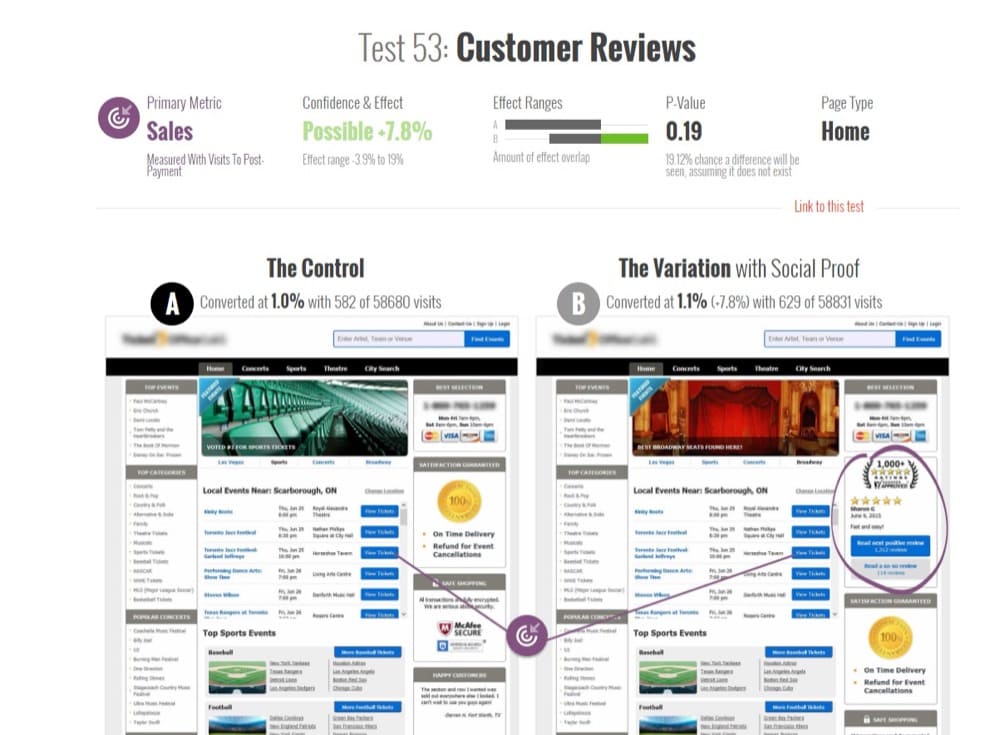
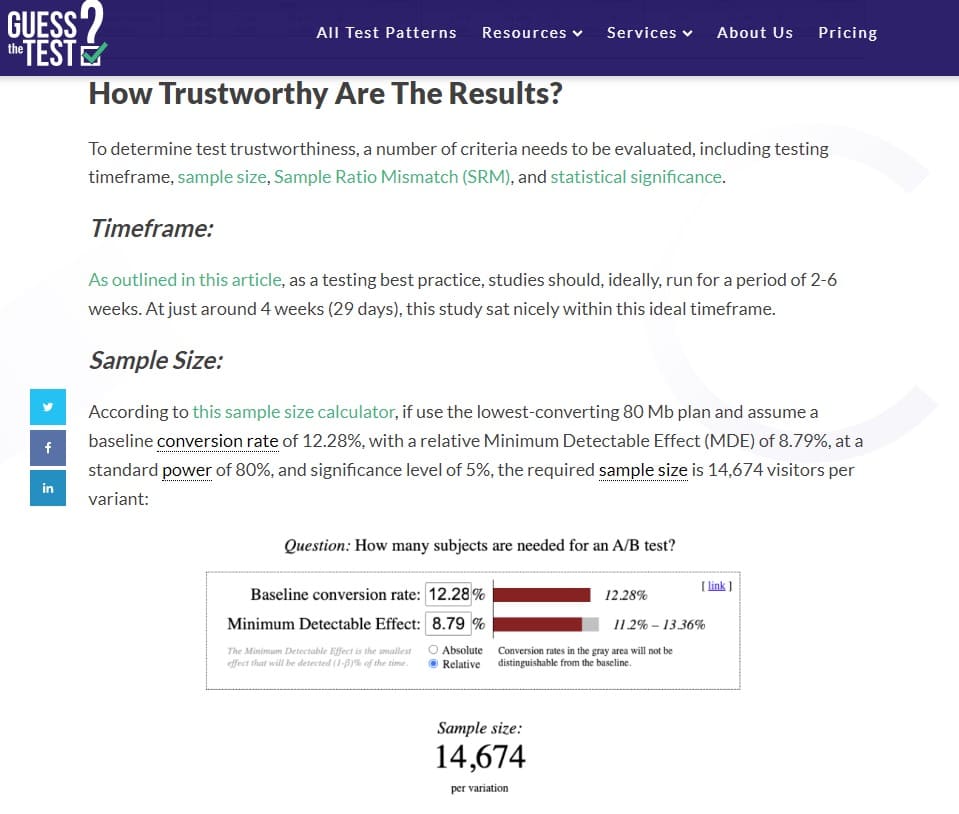
Another A/B testing case study resource that you can dig into for a similar depth of details on some tests like GoodUI is GuessTheTest.
DISCLAIMER: We are not penning this blog with the intent of panning or lauding meta-analysis & conversion patterns. We are merely going to present the pros and cons, as discussed by experts in the CRO field. The idea is to present meta-analysis as a tool so that you can use it at your own discretion.
Meta-Analysis – Yes or No
An intelligent mind looks for patterns. That’s how you shorten the path from problem to solution the next time you are presented with a similar problem.
These patterns lead you to an answer in record time. That’s why we’re inclined to believe that we can take what we’ve learned from experiments, aggregate them, and deduce a pattern.
But is that advisable for experimentation teams to do?
What are the arguments for and against meta-analysis in online controlled experiments? Can you find a middle ground that gets the best of both worlds?
We asked two of the most vocal voices in the realm of experimentation with (respectfully) diverse viewpoints about their take on meta-analysis.
Jonny Longden and Jakub Linowski are voices you can trust.


Meta-Analysis — Tread with Caution?
In the discussion above, Jonny pointed at two potential issues with using meta-analysis data in online testing that demand CRO practitioners tread with caution.
- Issue #1: Using a result without testing it
“If it worked for that company, it should work for us too”. This might turn out to be erroneous thinking because there are nuances around testing that don’t make it to the snippet of the results you’re reviewing.
Several tests might demonstrate a no-brainer solution, but that’s only a probability that it might work slightly better than other solutions and not a definitive answer that it’ll work on your website.
- Issue #2: You can’t classify tests so easily
As mentioned in #1, those results aren’t showing the full, nuanced story behind the tests. You don’t see why the tests were run, where they came from, what prior issues existed on the website, etc.
You only see that it was a test on the call to action on the product page, for example. But the meta-analysis databases will sort these into specific patterns, even though they don’t neatly fall into those patterns.
What does this mean for you, an A/B testing meta-analysis database user, or a CRO researcher putting together your own meta-analysis database to extract learnings?
It doesn’t mean meta-analysis is off limits, but you should be careful when using it. What kind of caution should you take?
Don’t Compromise Test Rigor and the Pursuit of Innovation
Recall that meta-analysis is a statistical idea from the medical community where experiments are heavily controlled to ensure repeatability in the finding.
The environment and other factors surrounding the observation are repeated across several experiments but that’s not the same with online experiments. Meta-analysis of online experiments pulls their data together regardless of these differences.
One website is radically and utterly different from another website because it’s got a very different audience and very different things going on. Even if it seems relatively similar, even if it’s the same product, then it’s still completely and utterly different in millions and millions of ways, so you just cannot control for it.
Jonny Longden
Among other limitations, this affects the quality of what we are allowed to call true meta-analysis.
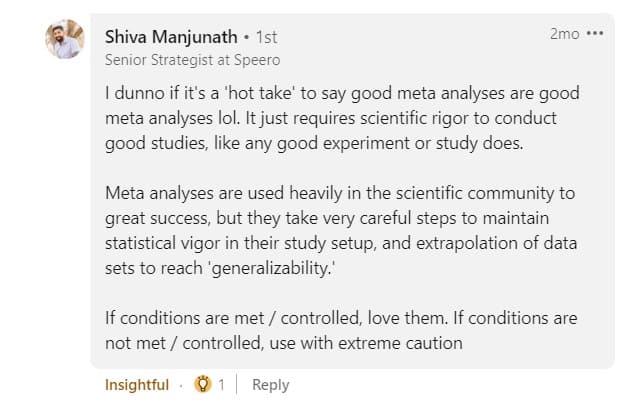
So, where you’re not assured of the level of statistical vigor that went into the tests and meta-analysis of the tests, you can only use with extreme caution, as Shiva Manjunath advises.
The goal of meta-analysis should not be to copy competitors. The jump from leveraging meta-analysis to straight-up copying pushes the boundaries of credibility. There are nuances to the intent behind “copying”, so it’s hardly a black-and-white situation.
The comments on Deborah’s post above were varied. It’s okay to copy to a certain extent, but to overdo it is dangerous:

As Jakub agrees, we have to be cautious about copying, especially when it comes to validating the patterns we’ve observed with experiments.

However, what we should stand guard against is commoditizing experimentation. That is, using the patterns and insights from meta-analysis as best practices to replace research in experimentation, instead of complimenting what situation-specific data has to say.
So, start with understanding the problem you want to solve and pinpoint the kind of intervention that’s most likely to succeed. That’s where meta-analysis of legacy experimentation data best supports a unique optimization strategy.
Meta-Analysis — Greasing the Experimentation Flywheel?
The experimentation flywheel has a way of recycling momentum. When you’re experimenting for the first time, you need a lot of inertia to set things in motion.
The idea with the experimentation flywheel is to capitalize on that momentum to run more tests and go round again, getting better and better, running more and more tests.
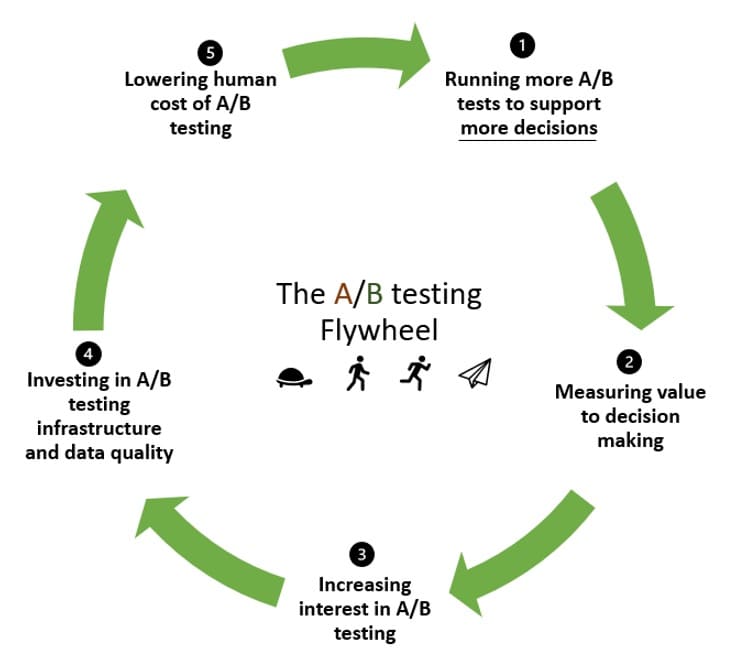
And that’s where meta-analysis can help. In the flywheel:
- You run tests to hopefully validate your hypotheses (and maybe reject some in the process).
- Measure the value they added to decision-making.
- Encourage more interest and buy-in for A/B testing.
- Invest in A/B testing infrastructure and in improving the quality of your data.
- Lower the human cost of A/B testing so that the next step takes off with less effort than the previous round.
But as a data-driven organization, you don’t stop there as you recognize the power of A/B testing. Instead, you want to build on your initial experimentation investment to validate or reject more hypotheses.
If that initial insight or knowledge isn’t there to start, the inertia to get your flywheel in motion will be too great. Sharing this knowledge (democratizing the A/B testing data) inspires and enables others to take on an experimentation approach by lowering the knowledge barrier.
This brings us to point #1 of how meta-analysis greases the experimentation flywheel:
- Meta-analysis might cut down the time to hypothesizing ideas.
You can take what you’ve learned, insights and all, from previous tests to generate new hypotheses easily. This increases the number of tests you run and is an excellent way to accelerate the A/B testing flywheel.
We spend less time redoing what has already established patterns and more time carving out fresh paths based on what we’ve learned in previous experiments.
- Meta-analysis can lead to better prediction rates with past data.
Another way past experimentation-driven learning can get the experimentation flywheel spinning faster is when it’s combined with present data to inform new hypotheses.
This potentially improves how the observed impact in an A/B test spills over into the future.
Deploying an A/B test is no guarantee of seeing the outcome you desire since the false discovery rate (FDR) for tests at 95% significance is between 18% and 25%. And only 70% of the examined tests that led to this conclusion had adequate power.
The false discovery rate is the fraction of significant A/B testing results that are actually null effects. Not to be mistaken for false positive or type I error.
- Finally, meta-analysis might be a way to build confidence in test results that are essentially inconclusive.
Confidence levels help you trust that your test results aren’t due to sheer chance. If you don’t have enough of it, you might be inclined to tag that test “inconclusive” but don’t be in such a hurry.
Why? Statistically, you can accumulate insignificant p-values to get a significant result. See the post below:
Meta-analysis has two major benefits: 1) It improves the accuracy of effect estimates, and 2) it increases the generalizability of the findings.
Source: The good, the bad and the ugly: meta-analyses by Madelon van Wely
Given that a meta analysis adjusts and corrects both the effect size and significance levels, one could use such higher standard results the same way one uses any other experiment(s), including:
1) to make power calculations/sample size estimations for their own experiments (using real data instead of subjective guesses)
2) to make the exploit-experiment decision. In cases where someone feels that additional confidence is needed, they may decide to run additional experiments of their own. In cases where someone finds the evidence from the meta-analysis strong enough, they might simply take action sooner without running additional experiments.
Jakub Linowski
With all the ways meta-analysis can aid your experimentation program gain more momentum, it’s important to keep in mind that it suffers from some well-known limitations.
If You Choose to Conduct (and Use) Meta-Analysis – Keep the Following in Mind
Yes, combining the results of experiments via meta-analytical methods can improve statistical precision but that doesn’t remove fundamental problems with the initial data set, such as…
Poor Quality Of Experiments Included In The Analysis
If the experiments that are included in the meta-analysis were poorly set up and contain statistical errors, no matter how accurate the meta-analyst is, they’ll get invalid results.
Maybe there was an unequal allocation of sample size in the A/B tests, the power or sample size was insufficient, or there was evidence of peeking — whatever the case may be, those results are flawed.
What you can do to bypass this limitation is to choose your test results carefully. Eliminate questionable results from your data set. You can also recalculate statistical significance and confidence intervals for the tests you’ve chosen to include, and use the new values in your meta-analysis.
Heterogeneity
This is combining test results that shouldn’t be put in the same bucket in the first place. For example, when the methodology used to conduct the tests differs (Bayesian vs Frequentist statistical analysis, A/B testing platform-specific differences, etc.).
This is a common limitation of meta-analysis where the analyst, knowingly or unknowingly, ignores key differences between studies.
You can look at the raw quantitative data to combat heterogeneity. It’s better than combining just the summary of the test results. That means recomputing the results of each A/B test, assuming you have access to the data.
Publication Bias
Also known as the ‘file drawer problem’, this is the most infamous problem with meta-analysis. When conducting a meta-analysis on publicly available data, you’re limited to pooling those results that made it to publication.
What about the ones that didn’t make it? Publications usually favor results that are statistically significant and where there’s a significant treatment effect. When this data isn’t represented in the meta-analysis, results only portray what was published.
You can spot publication bias with funnel plots and corresponding statistics.
So, where do you go to find A/B tests that didn’t make it to case studies or A/B testing meta-analysis databases? A/B testing platforms are in the best position to provide data on tests regardless of results. That’s where examples 1 and 2 in this article are fortunate.