
As a company data provider, we (obviously) have quite a bit of data about companies. This data can be used for any number of things, but more often than not, it's used to identify the companies that are the most lucrative for a business and find companies similar to them at scale. For the sake of this article, we decided to do something different with that data—we decided to analyze it and see what trends we could uncover.
So, let's start at what could be seen as the beginning: How many companies are there in Finland? Already here, we run into a little pickle. According to Statistics Finland, there are around 560,000 companies, yet our database contains 1,267,132 Business IDs, nearly 2.5x as many companies. What’s going on?
The reason is quite straightforward: We measure differently. For example, the Statistics Finland data set does not include subsidiaries of foreign companies, but in our database, as long as they have a Finnish Business ID, subsidiaries of foreign companies will be included. If you’d like to know more about how Statistics Finland determines their data set, please check out their website.
This is important because the fact that there are many different numbers and statistics floating around out there means that they can’t all be right, right? Not necessarily. When it comes to statistics, it’s important to read the fine print.
In this article, we’ll be diving into Finland’s business landscape. Expect to learn what the biggest companies by revenue are, the most common industries (both according to the Standard Industrial Classification and our proprietary classification), the most used technologies, and much more.
The biggest companies in Finland
This almost feels like a formality since it’s unlikely that there’ll be any major surprises for the companies with the highest revenues—they are likely to be some of the most recognizable brands in the country, after all.
- Fortum — €112.4B
- Nokia — €22.2B
- Neste — €15.1B
- Kesko — €11.3B
- Sampo — €10.6B
Important disclaimer: These numbers take the company’s international operations into account.
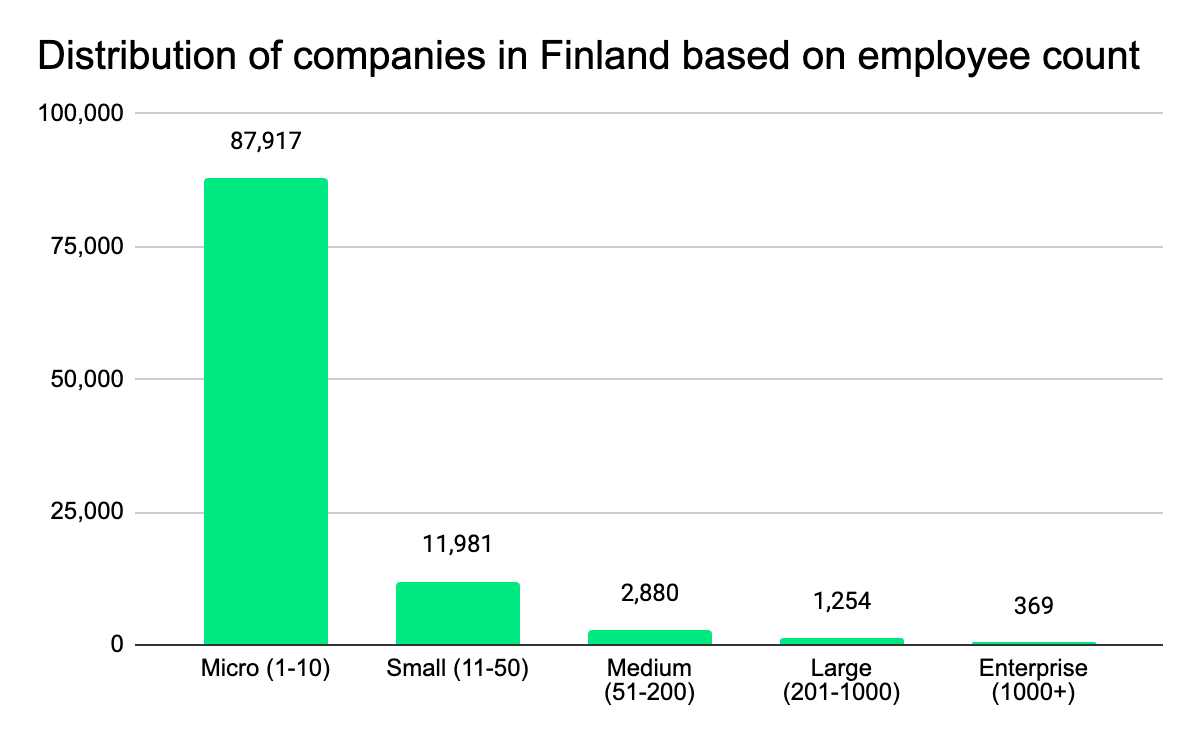
Distribution of companies in Finland based on employee count
Unsurprisingly, the five biggest companies in Finland would be considered “enterprise” companies, which we define as any company with over 1,000 employees. But how many enterprise companies are there in Finland? According to our definition, there are 369, which means enterprise companies only account for 0.35% of all the companies that have employees.
Most companies that have employees in Finland are “micro” companies, which we define as between 1 and 10 employees. There are 87,917 “micro” companies in Finland, and they account for 84.21% of all companies that have employees.
If you’re eagle-eyed, you might have noticed a discrepancy: We said there were 1,267,132 businesses in Finland earlier, so how can 87,917 “micro” companies account for the majority of companies in Finland?
Well, the graph below shows the distribution of companies that have employees in Finland based on employee count—and most companies in Finland don’t have any employees. Most companies in Finland are sole proprietorships, meaning they don’t get included in the graph.
B2B vs. B2C
It might not surprise you to hear that the majority of companies in Finland are business-to-customer (B2C) companies, accounting for 63% of companies. This means that 37% of the companies in Finland are business-to-business (B2B).
Note: This analysis was made possible by analyzing companies’ websites, so if a company does not have a website, it won’t have been considered. This means that, in actuality, the exact split may be different if one, for example, assumes that B2C companies are more likely to have websites than B2B companies.
Most common industries - Standard Industrial Classification (SIC)
Besides knowing the size of a company, it can be important to know what that company actually does—which is where industry comes into play.
When a company is created in Finland, the person establishing the company has to choose an SIC code that encompasses the company’s business activities, and some SIC codes are more frequently picked than others. Here are the top 10 most commonly chosen SIC codes:
- Forestry and logging — 249,070
- Real estate activities — 148,366
- Crop and animal production, hunting and related service activities — 84,296
- Retail trade, except of motor vehicles and motorcycles — 45,515
- Activities of membership organisations — 43,864
- Other personal service activities — 43,221
- Specialised construction activities — 40,561
- Construction of buildings — 37,544
- Human health activities — 36,785
- Activities of head offices; management consultancy activities — 33,287
Note: The number indicates the number of companies that have chosen that SIC code.
Most common industries - Vainu Custom Industries (VCI)
If the traditional industry codes aren’t your cup of tea, we’ve also categorized Finnish companies based on our proprietary industry classification taxonomy, Vainu Custom Industries. Long story short, this machine-learning model analyzes companies’ websites to predict which of our 900 segments they are operating within. In Finland, the ten most common VCI tags are:
- Information Technology — 64,855
- Software — 51,775
- Service Industry — 39,376
- Real Estate — 32,791
- Manufacturing — 25,579
- Health Care — 25,051
- Consulting — 24,933
- Internet — 22,040
- E-Commerce — 20,397
- Non-Profit — 18,160
Note: The number indicates the number of companies associated with that VCI code. Unlike SIC codes, a company can (and likely will) have multiple industry tags.
The cities in Finland with the most companies
The last of the “Big Three” firmographic data points is location. For this, we analyzed our Finnish company dataset to find which cities in Finland had the largest number of companies. Here are the top 10 cities:
- Helsinki — 112,417
- Espoo — 40,883
- Tampere — 28,071
- Vantaa — 27,957
- Turku — 23,534
- Oulu — 17,155
- Lahti — 11,419
- Jyväskylä — 11,299
- Kuopio —9,073
- Pori — 8,628
Note: The number indicates the number of companies operating in that city.
The most commonly used technologies by Finnish companies
Although firmographics often form the backbone of most company segmentations, there is more to a company than its size, industry, and location. There are, for example, the technologies that it uses! Our database contains over 14,000 web technologies, but for this demonstration, we’ll settle for showing the 10 most commonly used technologies by Finnish companies:
- WordPress — 109,619
- Google Analytics — 97,358
- Google Tag Manager — 92,889
- Outlook — 91,305
- Youtube Embed — 81,065
- Google Maps — 51,921
- Recaptcha — 41,178
- Facebook Pixel — 15,505
- Cloudflare — 14,134
- Cookiebot — 14,714
Note: The number indicates the number of companies using those web technologies. This information was found by analyzing companies’ websites. We have excluded technologies such as social media share buttons and the things that almost everyone has, like Underscore.js or TLS v1.1.
The most visited Finnish websites
While we’re already talking about web stuff, let’s talk about even more website stuff—such as the most visited websites in our Finnish database.
- iltalehti.fi — 1,421
- elisa.fi — 2,982
- yle.fi — 3,457
- helsinki.fi — 4,960
- foreca.fi — 5,539
- hs.fi — 5,691
- is.fi — 6,299
- mtvuutiset.fi — 7,727
- veikkaus.fi — 7,804
- tori.fi — 7,982
Note: These numbers indicate the website's ranking in popularity on a global scale. For example, iltalehti.fi is the 1,421st most visited website in the world.
Website keywords
This last one is a fun one: What are some interesting (from a prospecting perspective) words that are mentioned often on Finnish websites? If you are, for example, looking for companies that have written ESG on their website, you’ll be happy to hear that it’s mentioned on 5,587 Finnish websites.
- varasto — 46,370
- aukioloajat — 28,393
- työhyvinvointi — 8,435
- työharjoittelu — 6,769
- ESG — 5,587
- aurinkopaneeli — 5,398
- avainlippu — 3,421
- vastuullisuusraportti — 3,408
- vastuullisuusohjelma — 1,104
- kokeile ilmaiseksi — 261
Note: These numbers are the number of company websites that include that specific keyword.
Want to get to know Finnish companies better yourself?
Hopefully, you found that analysis of Finnish companies interesting. There are (obviously) lots of different types of companies in Finland, and it can be difficult to sort through all of them to find the “right” ones if you don’t know what to look for or you don’t have a way to find the companies you’re looking for at scale. Vainu’s company data can help you with (at least) one of those things, so if you’re interested in prospecting better, consider signing up for a free trial.