

Everything Your Saas Business Needs To Know About Customer Experience Metrics
Measuring customer experiences for SaaS companies is essential if you want your organization to succeed. When you track your CX (customer experience), you get valuable information on what your customers do when interacting with your product.
Are they satisfied with it? Do they keep coming back? How often do they use your product? These are just some of the questions you need answers on to understand your customer experience.
Not only is it good for your customers, but it’s good for business as well. According to HBR, getting a new customer is between 5X-25X more expensive than retaining your current customer. And your existing customers want a great experience when they use your products.
To provide them with a great user experience, you will need to start measuring customer experience to get that valuable data and make data-based decisions. In this article, we will cover the following 12 best customer experience metrics:
- Customer Satisfaction Score (CSAT)
- Net Promoter Score (NPS)
- The Customer Health Index (CHI)
- Upsell & Renewal Rate
- Customer Effort Score (CES)
- Customer Retention Cost (CRC)
- Customer Lifetime Value (LTV)
- MRR Churn Rate
- Average Revenue per Account (ARPA)
- Daily and Monthly Active Users (DAU/MAU)
- First Contact Resolution
- Average Time to Resolution
- Qualitative Feedback
Why is Measuring Customer Experience Necessary for SaaS Companies?
The best way to convince you that you need to measure customer experience is to look at data:
- According to Watermark Consulting, companies that are CX leaders outperform their competition by 3X.
- According to Gartner, most marketers (81%) will compete solely based on customer experience differences
- PwC stated that customers would pay 16% more for premium service if it provides a better customer experience.
- And CMS Wire reported that over 66% of customer loyalty is caused by great customer experience.
These are just a couple of stats, but plenty more are there that confirm how important customer experience is. So if you want to leave your competition behind, lower the churn rate of your customers, create a great customer journey, and increase customer satisfaction, you should pay attention to customer experience and start measuring it.
But that’s easier said than done. When you get into customer experience metrics, you might get completely lost in all of it since there are too many of them. That’s why we will cover the best customer experience metrics, explain why they’re good, and provide the pros and cons of using them. With that, you will have an easier task of deciding which CX metrics you will use to measure customer experience for your Saas business.
12 Best Customer Experience Metrics
In this section, we will go over the best customer experience metrics and help you understand which ones you should use in your business:
Customer Satisfaction Score (CSAT)
CSAT is an acronym for customer satisfaction score. CSAT provides results on a scale from 1-100%. When you give your customers a CSAT survey, you will receive direct feedback from your customers since they will talk about how they feel about your product, brand, and services in the survey.
You have an excellent customer experience if you receive 80% or more on your CSAT score. The formula that you use to calculate CSAT is the following:
CSAT (%) = Total Response Scores Given / Total Possible Response Scores X 100
Even though CSAT is simple to create and use, you will have some trouble discerning the scores. The customers grade you on a Likert scale from 1-5 (example: very unsatisfied, not satisfied, neutral, satisfied, very satisfied). Also, your CSAT only asks about the customer’s last interaction with the business so the results can be skewed.
Net Promoter Score (NPS)
NPS is an acronym for Net Promoter Score.
NPS is quite a simple survey— it only has one or two questions. The first one asks your customer the following:
“How likely are you to recommend our product/service/brand/company to others?”
The customers grade this answer on a scale from 1-10.
The other question simply asks, “Why is that?” and can be added to receive some qualitative feedback.
With NPS, your customers are divided into three groups, depending on their answers:
- 0-6— Detractors. These customers aren’t satisfied with your service or product and won’t recommend it to others.
- 7-8— Neutrals. These customers are lukewarm about your product— they tend to use it and it’s okay for them for now, but they’re not loyal to the brand.
- 9-10— Promoters. These customers are your brand ambassadors and they love your product.
You calculate NPS with the following formula:
NPS = % Of Promoters – % Of Detractors
An excellent NPS score goes over 70, but anything in the 30-70 range is still deemed quite good.
The Customer Health Index (CHI)
Sometimes, NPS can provide you with a really great score, but the customer can still close their account. With that in mind, we will look at the customer health index (CHI). CHI gives you an overall view of the relationship you have with your customer and it sorts them into three categories:
- Good health
- Average health
- Poor health
Customer health index considers the entire relationship your customer had with you— from the stranger/visitor stage all the way to the moment when they renewed or upgraded your product to a higher tier.
CHI divides the entire lifecycle of the customer into 10 steps and assigns 3 key performance indicators (KPIs) for each step. CHI then measures all those metrics in real-time on a 1-100 scale to determine the relationship’s health.
Upsell & Renewal Rate
Upsell rate is a percentage number that is determined by the purchases your customers make above the initial product purchase.
The upsell rate can be calculated with the following formula:
Upsell rate (%) = # Of Customers Upsold / # Of Customers Who Had The Potential To Buy An Upsell In That Timeframe
The renewal or retention rate is the percentage of customers who decided to extend your company’s relationship by buying another cycle of your product or service.
A renewal rate of 80% is quite good, even though most businesses aim for it to be 100% (not to lose any customers). The renewal rate can be calculated with the following formula:
Renewal rate (%) = # Of Customers Who Renewed Their Contracts / # Of Customers Who Have The Potential To Renew Their Contracts X 100
Customer Effort Score (CES)
CES is the acronym for Customer Effort Score and it’s a metric that measures how easily customers can interact/use your products and services. With CES, you can measure how much effort your customers need to start using your product or service.
The easier it is to use your product, the higher your CES score and the more satisfied your customers will be. CES usually has a 1-5 or a 1-7 Likert scale.
You can calculate Customer Effort Score by using the following formula:
Customer Effort Score = # Total Sum Of Responses / Number of responses
Customer Retention Cost (CRC)
With the Customer Retention Cost or CRC, you are calculating how much does it take you, as a company, to keep/retain your current customers.
You can use the following formula to calculate your retention cost:
CRC = # Total Retention Costs / # The Number Of Customers Retained
Customer retention cost is business-specific since you will need to calculate the cost of all operations needed to retain your customers. For some businesses, that could include the cost of training, customer support teams, customer marketing, etc.
Customer Lifetime Value (LTV)
Customer Lifetime Value (LTV or CLV as you will find it somewhere) helps businesses by determining how much revenue they will receive from one customer in a span of their lasting relationship.
The simplest way to calculate lifetime value would be the following:
LTV = The Average Order Total X Average Number Of Purchases in 1 Year X Average Retention Rate In Year
Improving the LTV of your customers can provide you with great ROI and some of the things you could do to improve it are:
- Provide an easy onboarding process
- Creating a loyalty program
- Being there for your customers by enabling 24/7 customer support
- Investing in customer experience overall
MRR Churn Rate
MRR churn rate is the rate by which your business loses revenue on a monthly basis. The number can be presented as absolute or in a percentage. The churn rate can be calculated by using the following formula:
MRR churn rate = The Sum Of All Cancelled Contracts In That Month / Your MRR At The Beginning Of The Month X100%
Tracking the MRR churn rate can be essential for your business for multiple reasons. First of all, you should be aiming for a zero churn rate and then you should work on improving your customer experience so that the churn rate becomes even lower.

Daily and Monthly Active Users (DAU/MAU)
The DAU/MAU is an acronym for the daily and monthly active users of your product, service, or application.
This can help you determine if your customers are returning to use your product or app. For example, your customers’ activity can be anything from logging on to their account or viewing a product, all the way to making an (additional) purchase or completing their tasks.
You can use the following formula to calculate DAU/MAU:
DAU = Total # Of Active Users In 1 Day
MAU = Total # Of Unique Users In 1 MonthDAU/MAU ratio = Total # Of Daily Active Users / Total # Of Monthly Unique Users x 100%
First Contact Resolution (FCR)
First contact resolution or first call resolution, as you will find it somewhere, is a metric that measures the ability of employees in the call center to resolve the customer’s problem on the first contact or call.
It’s also used to measure the ability to resolve first contacts via chats, calls, and emails.
With a high first contact resolution, your customers will have their problems sorted out on the call with the first person instead of jumping through endless hoops of calls, repeating the same lines over again to different people. This will improve your customer experience vastly.
A good first call resolution rate would be 70-75%.
You can calculate the first call resolution rate with the following formula:
FCR = # Of Customer Problems Resolved On The First Contact / Total # Of Unique Customers Who Called About A Problem
You should connect this customer experience metric with the following one.
Average Time to Resolution (ART)
Average time to resolution or mean time to resolution is the average amount of time it takes for your customer support rep to handle a customer’s problem.
Your customer support reps usually talk to multiple customers simultaneously, so they must choose the fastest route to solving the customer’s problem to focus on the following customer.
You should measure ART along with FCR because you don’t want your customer support agents just to have short calls— you want them to solve their problems…in the least amount of time.
You can use the following formula to calculate Average time to resolution:
ART = Total Duration Of Resolved Conversations / # Of Customer Conversations
The average benchmark for ART is up to 9 minutes.
Qualitative Feedback
And the last customer experience metric, but not the least, is qualitative feedback.
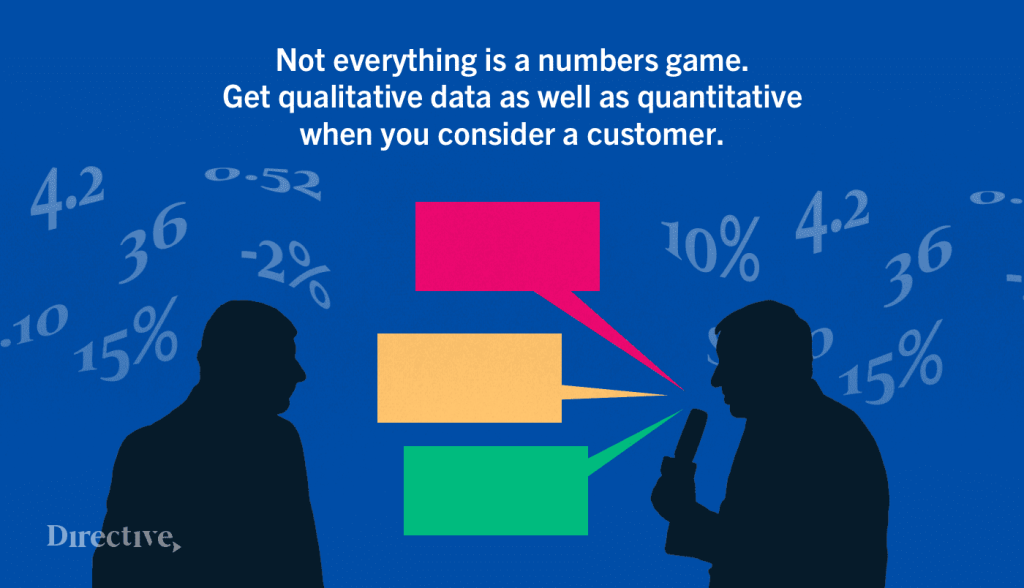
You should always give your customers the opportunity to provide you feedback and asking for qualitative feedback is an excellent way to do it. With qualitative feedback, you’re asking your customers open-end questions where they can write a lot of information that can help you out with determining:
- What’s great and should be continued
- What’s lacking and should be started
- What’s not so good and should be stopped
Maybe you won’t get quite a lot of information with qualitative feedback because it takes more effort, but the information you receive will be precious. So don’t forget to leave an open communication channel that goes directly to your customers.
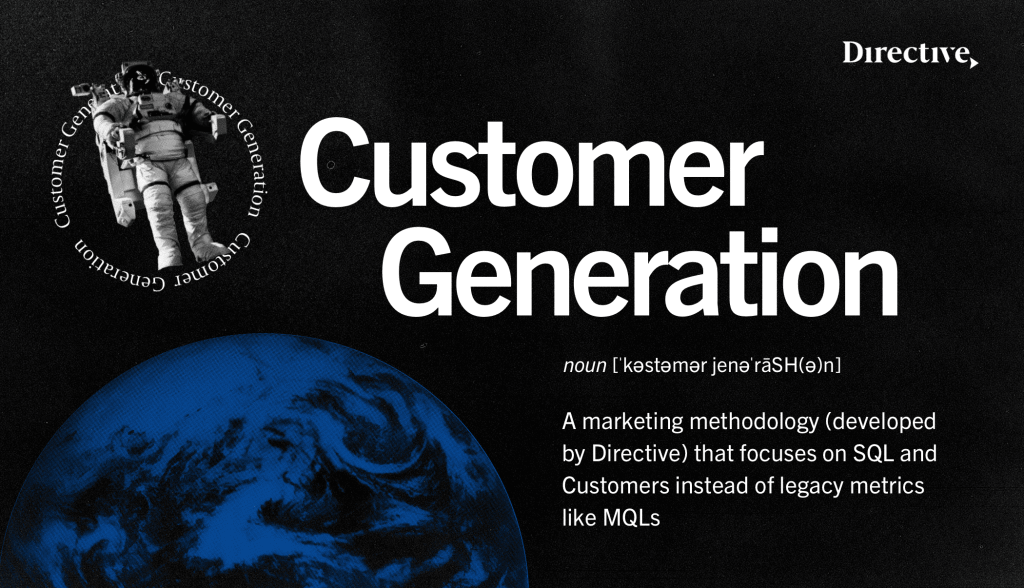
Why You Should Use The Customer Generation Methodology to Improve Your Customer Experience
There are three reasons why you should use Directive’s customer-generation methodology to improve your customer experience:
- Customer-first. Our methodology always starts with the customer. We need to understand the customers’ pain points and problems that they face in specific situations. Your product isn’t for everyone, but our methodology enables us to find the people who are the right match for your product.
- SQLs instead of MQLs. We focus on Sales Qualified Leads instead of Marketing Qualified Leads. Because sales/revenue is what will push the needle and improve your company’s bottom line.
- Data-driven decision-making. Everything we do is backed up by feedback and data. So measuring customer experience is the foundation of our customer-led approach because biases would rule the world without data.
Conclusion
Measuring customer experience is essential for Saas companies to stay competitive in the market. We have seen the data that indicates that more and more companies will start investing in customer experience because that will become one of the biggest differentiators in the market.
With that, we introduced the most important CX metrics that you should track when it comes to your customers. If you want more information about aligning your current pain points and goals and creating a strategy that’s specifically suited for your market, you should book an intro call with one of our agents.


