The stat they all used? Customer lifetime value , or CLV, which is a measure of how much your customers contribute to your bottom line over time.

Knowing which customer segments have higher CLVs allows you to better target leads who are like them, meaning you’re focusing your time and money on the people who will maximize your ROI, and you can feel comfortable with your cost per acquisition. Later in the customer lifecycle, knowing this information allows you to tailor the experience to meet the likes and interests of your best customers, increasing retention and referral rates.
Your CLV data can and should inform your entire CRM strategy. This one stat can be the impetus behind improving customer relationships throughout the customer lifecycle and accelerating your growth.
Calculating CLV requires comprehensive data
Despite the critical importance of this number to a business’s revenue growth, many businesses simply aren’t using it effectively. According to research by Criteo, of the 92% of organizations that are trying to measure CLV, an overwhelming majority, 66%, believe that their organization could be doing this better.
The reason? Disjointed data. Calculating CLV is difficult, if not impossible, if your customer data is spread out across multiple systems, such as your payment processor, your CRM-only tool, and your referral tracking system. The malalignment between how each system stores and measures information makes it extremely challenging to reconcile the data in a way that enables companies to draw accurate conclusions.
Without the ability to measure this crucial metric, many businesses also find it difficult to improve CLV, which consequently has a negative effect on their entire business growth strategy.
With an all-in-one CRM such as Ontraport that houses all of your customer data in one place, you can always confidently get an accurate view of your CLV. You can also easily see in real-time how CLV is affected by changes to your marketing campaigns, customer service processes, sales systems or any other factor in your business as you test new things.
How to calculate CLV
With Ontraport, you not only have access to all the data you need to calculate your CLV, but you also can generate a lifetime value report that does the math for you within your campaigns, with one click.
Before we delve into how you can use that report, it’s important to understand all the factors that go into the formula. This will also be useful if you’re still using other single-point tools and don’t yet have all your data inside one platform.
Step 1: Divide your customers into relevant segments
You can calculate CLV as an aggregate number for all of your customers, which will provide some interesting insights you can use to improve your business. But calculating it that way won’t help you identify who in the group are your best buyers. To do that, you’ll need to divide all your existing customers into segments based on relevant differences, then calculate the CLV of each segment one by one to see which group is the most valuable so you can focus your efforts on them.
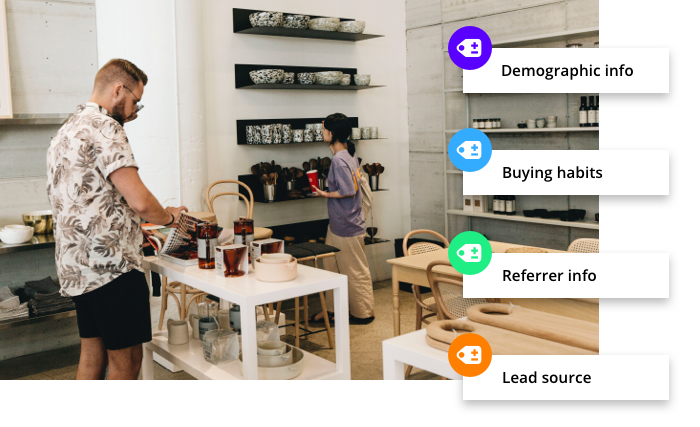
How do you identify your buyer segments in a way that will allow you to compare them? You can divide your segments using the following types of information about your existing customers:
1. Demographic information
You can divide your segments according to demographic factors such as age, gender, or physical location to look for relevant differences.
Although there might be significant differences based on only one factor (for example, perhaps customers between the age of 30-40 have a 50% higher CLV than any other group, regardless of gender or physical location), the best way to narrow your focus is to combine a number of factors to develop a picture of your ideal buyer based on many different data points. For example, you might discover that a customer segment with the highest overall CLV is a 30-40 year old male who lives within 50 miles of Los Angeles.
2. Buying habits
In addition to demographic information that you have about your existing customers, you also have access to lots of behavioral data that you can use to identify profitable customer segments. For example, you can use the customer information in your database to learn about each customer’s purchasing frequency, purchase amounts and preferred product types.
Although your instinct may be to search for customers who have high order values or frequency, it’s important to look at the whole picture. A customer with a high frequency and a low order value might not be as valuable as someone with a lower frequency but a much higher order value. You are looking for the golden combination of factors, so you’d be wise to calculate the full CLV of several different customer segments with distinct buying habits and pair these insights with demographic information.
3. Referrer information
If you’re running a partner or affiliate program, or if you’re tracking referral information for new customers (i.e., by asking them, “How did you hear about us?”), you can investigate differences in CLV between customers who came from different referral sources.
Since referred customers tend to spend more and stick around longer, this is definitely worth looking into. You may just find that customers referred by one or two particular sources have a significantly higher CLV, and this will allow you to focus on your relationship with that referrer to encourage him or her to keep it up, while also identifying and encouraging similar customers to become referrers as well.
4. Lead source
In the same way that you calculate the CLV for all customers who share the same referrer, you can calculate the CLV for all customers with the same lead source. Lead sources might include Facebook ads, a Google search or an event that you attended. Basically, a lead source is the channel where your relationship with a customer or lead first began.
By comparing the CLV for different lead sources, you can more easily track which parts of your marketing are really working, and you can get clear about the exact ROI of each marketing channel.
Step 2: Calculating your CLV variables
Use the information below to find the variables you’ll need to calculate each segment’s CLV.
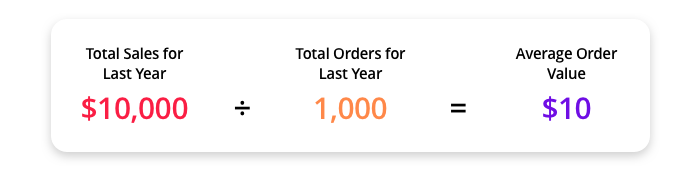
1. Average order value
The first number you need is found by taking the total value of sales made to a single segment and dividing it by the total number of orders placed by that segment. This will give you the average order value for a unique segment. It is important to note that one customer could buy several times in a period and each of those purchases would be considered an order when calculating average order value.
Use this formula to calculate your average order value:
Total Sales for Last Year ÷ Total Orders for Last Year = Average Order Value
$________________ ÷ ________________ = $________________
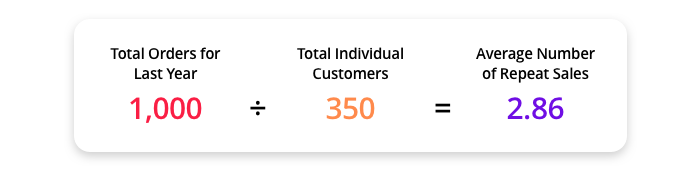
2. Average number of repeat sales
The next number you need to identify is the average number of repeat sales, determined over a set period of time — whatever makes sense for you (but it must be the same time period you used to calculate average order value). This number is simply the total number of cumulative orders made by all customers divided by the total number of unique customers. This determines how often the average customer purchases from your business in a set period of time.
Total Orders ÷ Total Individual Customers = Average Number of Repeat Sales
________________ ÷ ________________ = ________________
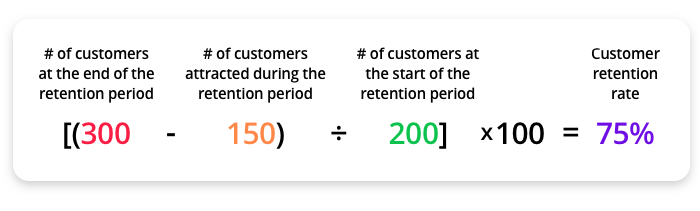
3. Customer retention rate
The average customer lifetime is the length of time that someone remains a customer. In order to calculate your customer retention rate, you need to know the number of customers at the end of the period, the number of new customers attracted during that period, and the number of customers at the start of the period. The equation looks like this:
[(# of Customers at the End of the Retention Period – # of Customers Attracted During the Retention Period) ÷ # of Customers at the Start of the Retention Period] X 100 = Customer Retention Rate
[( ________________ – ________________ ) ÷ ________________ ] x 100 = ________________%
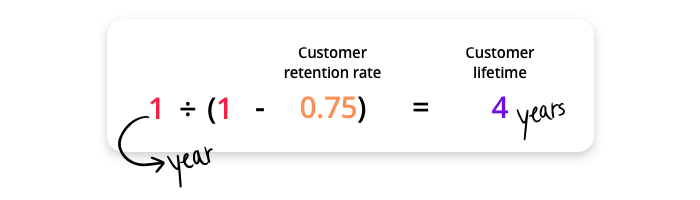
4. Customer lifetime
The customer lifetime is the average length of time customers across a particular segment will continue doing business with you. In order to calculate the customer lifetime for a particular segment, you need to know the customer retention rate for each segment. Once you have that, subtract the value of the customer retention rate from one. Then, divide one by that number to get your customer lifetime value.
1 ÷ (1 – Customer Retention Rate) = Customer Lifetime
1 ÷ (1 – ________________ ) = ________________
Step 3: Putting it all together
Once you have calculated all four of these figures for a segment, it’s time to put it all together to quantify that segment’s lifetime value. Here’s how you’ll do it:
A. Average Order Value
x
B. Average Number of Repeat Sales
x
C. Customer Lifetime
=
Total Average Customer Lifetime Value
(A)________________ x (B)________________ x (C)________________ = $________________

That final number represents the lifetime value of one segment. By comparing this number among multiple segments, you can understand which of your customers are truly the most valuable.
Once you have this number, there are a few additional items you’ll want to factor in per customer.
1. Referral profit per customer
When customers refer new customers to you, their CLV increases. To calculate referral profit per customer, first determine how many referrals you earn per customer served. Say that out of every five customers within your CLV segment, one of them refers a new customer who buys product X for $100. Your referral rate is 20%, so that means that, on average, each new customer brings in a referral profit of $20.
Referrals Earned ÷ Customers Served = Referral Rate
________________ ÷ ________________ = ________________
Referral Rate x Cost of Product = Referral Profit per Customer
________________ x $________________ = ________________


If your affiliate program includes payments to referrers, you’ll need to subtract the affiliate costs you pay from the referral profit per customer. To do this, multiply the cost of your product by your commission rate and referral rate.
As an example, say that you pay 10% commissions to anyone who refers someone to buy product X for $100. Your total referral cost is $10 per customer (since it takes you five customers to earn one referral), your referral cost is $2 per customer.
Cost of product X Commission Rate X Referral Rate
$________________ x ________________ x ________________
= Referral Cost per Customer
= $________________

Once you know referral profits and costs on a per-customer basis, use these numbers to adjust your final CLV:
Total Average CLV + Referral Profit per Customer – Referral Cost per Customer = Adjusted CLV
$________________ + $_______________ – $________________ = $________________

2. Acquisition cost per customer
Since some customers cost more to attract than others, it’s important to know how their acquisition cost stacks up with their CLV. In fact, once you figure out the acquisition cost per channel, you can adjust your overall CLV equation to reflect it.
To do this, you need to figure out how much it costs you to attract one customer on a specific channel. Starting with your total spend on that channel during a set timeframe, divide by the total number of new customers brought in via that channel during that timeframe to find your cost per conversion.
Total Spend ÷ New Customers = Cost per Conversion
_______________ ÷ _______________ = _______________

Your cost per conversion tells you how much it costs you to attract a new customer, so subtract this cost from your CLV to figure out how much each customer is worth to you after the cost of advertising.
3. Hard costs per customer
In addition to what it costs to attract a new customer, you must also factor in the cost of serving that customer for a true calculation of their lifetime value. This is especially important if it costs more to service some customers than others, so identifying customer segments that use up more of your time and resources can allow your business to become more profitable.
Your hard costs calculation will differ depending on your business model, but there are two main types of costs: fixed and variable. Fixed costs remain the same no matter how many customers you serve. This might include costs such as your office rent, internet bill, insurance, etc. It’s not necessary to count fixed costs in your CLV calculation because they don’t change depending on how many or what type of customers you have.
Variable costs are what you want to pay attention to when it comes to CLV. Variable costs change depending on your business’s volume. They increase if you serve more customers and decrease if you serve fewer. A good example of a variable cost might be packaging for a physical product or perhaps labor costs for your customer service team’s wages.
Sometimes variable costs increase proportionally for each additional unit sold (as in the packaging example, assuming all packaging costs the same per unit regardless of quantity purchased). However, some variable costs are not proportionally linked to units of product sold. For example, your customer service costs: Some customers will require less assistance than others. What you are looking for is any relevant difference in cost between segments, so to find this number you’ll need to know the total cost of serving all customers within your segment (over the same fixed time period you used for all your other CLV calculations) and the total number of customers served. Then, divide using this formula:
Total Cost of Customers in Segment ÷ Total # of Customers in Segment = Cost Per Customer

Then, subtract this number from your CLV to find the final adjusted CLV taking cost per customer into consideration.
When you calculate this number for your various segments, you might be surprised to discover that one customer segment requires far more of your time and resources. After factoring that into the CLV calculation, you might even find that the segment you believed to be the most valuable in terms of revenue is actually less valuable in terms of profit, since they are far more expensive to serve.
Lifetime value reports in your CRM software
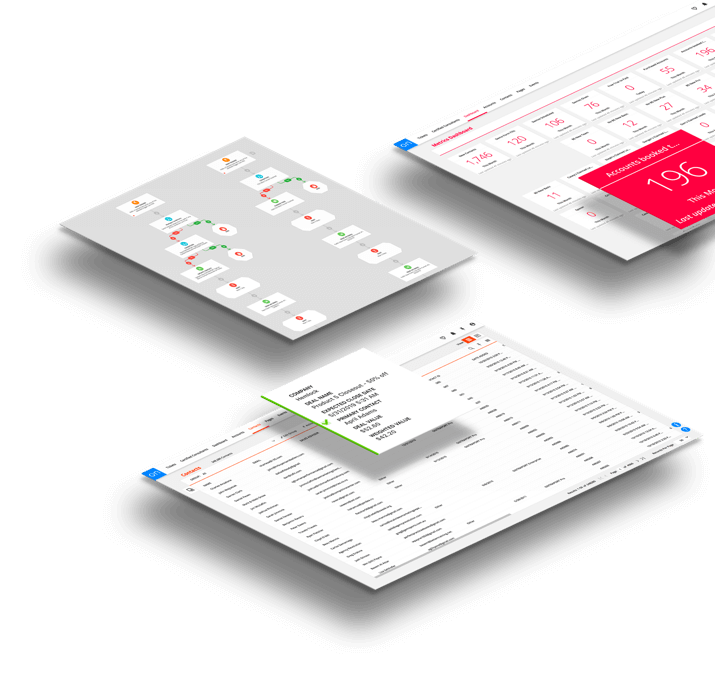
While all of the calculations above are important for understanding every factor involved in CLV, with some CRM platforms such as Ontraport, you can quickly have your CLV calculated for you within any of your campaigns.
Lifetime value report within a campaign
In Ontraport, the lifetime value report — available from the dropdown while viewing a campaign map in Performance Mode — shows the total and average amount spent by the contacts who hit any element on the map. This includes money that they’ve spent on any product throughout their entire relationship with your brand since they entered your database.

This report is very useful for tracking changes in lifetime value throughout campaigns. You can tell which elements have an effect on your lifetime value by seeing how lifetime value changes as contacts move through your funnels.
With the tracking capabilities in platforms such as Ontraport, you can also take this data steps further to compare how the lifetime value changes for different segments of your audience. For example, you can filter your report by lead source to compare the lifetime value of leads from Facebook to leads from LinkedIn. Understanding lifetime value on a channel-by-channel basis is incredibly valuable when making decisions about which channels to increase your spending on and which channels to cut back on.
Creating a lifetime value reporting map
Because most businesses use multiple campaign maps rather than one map for their entire business, you can create “reporting maps” that serve solely to capture data from each of your maps in one place.
These maps will be comprised of trigger, goal or wait elements only — no actions — and are designed to provide a top-down picture of your data.
In its simplest form, a reporting map might have just the triggers from your other maps and an “end” element after each one. You’ll set the trigger settings to “Any Contact in Account” for “Who can activate this trigger?” Any contact who activates the trigger will add to that trigger’s stats on that campaign and be part of the number of contacts displayed on the end element. Clicking the number on the end element creates a group of the contacts who are there. In the case of CLV, running the lifetime value report on this map would tell you the CLV of contacts based on which trigger they came into your campaigns from and the total CLV from all of them.
This is just one example of a reporting map that will aggregate information across campaigns; you can tailor a reporting map based on the way your campaigns are set up or based on which information is most important to you.
Using CLV to inform your strategy
It’s common for businesses that have only just calculated their CLV to find that a segment that they have been neglecting is actually worth more to their company than other segments in the long run. By paying attention to the specific customer segments that are most likely to have a high value, businesses that segment their customer base and determine the unique CLV of each segment can dramatically increase the bottom line of their company over time.
Here are a few simple ways that you can use your CLV calculation to grow your business faster:
1. Save money on marketing
Knowing your CLV gives you a reliable frame of reference to know how much to invest in marketing. For example, if you know that on average a new customer is worth $100 to your business over the long term, it’s probably a safe bet to spend $20 acquiring that person. However, a $20 cost per acquisition does not make sense if your average CLV is only $15.
You can also divide this up according to marketing channels. For example, if it costs you $20 to acquire a customer on Facebook, but Facebook customers end up spending $200 on average, that’s a great sign. You would know with certainty that scaling your Facebook ad investment was the right decision.
2. Tailor your business to focus on your most valuable buyers
Once you know exactly how much each customer segment is worth to your business, you can make changes to your business that improve the customer experience specifically for those people.
For example, let’s say that you are a business coach who has found that, although you’ve coached restaurant owners, hair salon owners, and many other types of business owners, your most valuable customer segment is a gym or fitness studio owner. You can shift your brand and even your product to primarily benefit gym and fitness studio owners. Instead of having a membership site about general small business growth, you could use most of the content you already have but focus on gym and fitness studio growth. You’d attract more people who are similar to your most valuable customers and retain them for longer.
You can also use CLV to more confidently determine the right product and customer journey improvements to make. For example, say that your CLV calculations revealed that Segment A is worth three times as much to your business as Segment B. Segment A would benefit in a major way from an improvement to your customer service processes, whereas Segment B would benefit more from a change to your product’s core functionality. You only have the money to do one or the other, so which one do you choose? CLV makes the decision obvious.
3. Reduce costs
When you know which customer segments have a lower CLV (especially because of a high service cost or high acquisition cost), you can cut back or eliminate any marketing efforts or product/service options targeted toward them. You will stop taking on low-value, high-effort customers and save unnecessary costs.
Of course, you should never intentionally withhold service from anyone, even customers who have a net negative CLV (if they happen to buy from you anyway). Provide a top-notch experience no matter what, because if their experience is negative they can do damage to your brand by leaving negative reviews or warning people to stay away. Even if a customer is not in your most valuable segment, there is still a chance that they could refer their friend who is.

4. Earn more referrals
Since customers with high CLV are more likely to become referrers, by narrowing in on your highest CLV group, you will be able to multiply your growth because the people they refer are also likely to have a high CLV. Your growth will only accelerate as long as you continue to provide excellent service to that group.