How to Present Shopify Metrics in an A/B Testing Report to Provide Clear Value

Creating a stellar Shopify A/B test report has two main facets—choosing the right metrics and knowing how to present them.
Your choice of metrics impacts the output of the test and defines the focus of the entire optimization program.

P.S. Don’t pick too many metrics. Use the Goldilocks rule: not too many and not too few. Too many and you’ll find a “winner” in every experiment. Too few and you’ll lose potential learning and possibly impact other key metrics negatively.
And when it comes to presenting these metrics in your Shopify report, think comprehensive but streamlined. Marry visuals with numbers so key changes and the trends or patterns of metrics leading up to the change are highlighted.
Without a report that presents meaningful findings to leadership, it can be hard to get buy-in for more experimentation or prove the ROI of A/B testing.
Perhaps your learning was all the risks you avoided by not rolling out bad ideas or insights you gained when you lost a variation but a segment showed promise or a metric moved in an unexpected way. And now you need to understand why that happened through an experiment and prove causation.
Bottom line: Create a report that’s easy to interpret and help the experimentation team convey the value of the efforts—actual wins, learning, and insights—to stakeholders with clarity.
Top Shopify Metrics To Track in A/B Tests And What They Mean
While the A/B testing metrics you should track depend on your hypothesis, here are some metrics from Shopify that you should consider keeping tabs on
- Total orders: The number of orders placed
- Total sales: The total amount is categorized by the sales channel
Formula: Gross sales – discounts – refunds + shipping + taxes
- Top landing pages: Shows the page where customers start a session.
- Average order value: The average value of all orders (minus gift cards) divided by the total number of orders.
- Online Store Conversion Rate: The percentage of sessions that resulted in an order
- Added to cart: The number and percentage of sessions in which customers added at least one item to their cart.
Formula: ((Sessions with cart item viewed) / (total sessions))*100 - Reached checkout: The number and percentage of sessions in which shoppers added at least one item to their cart, reached the checkout and performed an action.
- Sessions converted: The number and percentage of sessions in which shoppers added at least one item to their cart, reached the checkout and then made a purchase.
- Added to cart: The number and percentage of sessions in which customers added at least one item to their cart.
- Abandoned-cart rate: The percentage of carts that customers abandon before they reach checkout.
Formula: (1 – (Number of completed purchases / Number of initiated sales))*100
- Bounce Rate: The percentage of single-engagement sessions
Formula: Total one-page sessions / Total entrance visits
You can also track new customers, returning customers, referral channel (SEO, social media, direct, or email) and sales by location.
Note: The metrics you can track on the Shopify professional reports depend on the Shopify plan you’re subscribed to—higher plans offer more analytics and reports. The Shopify Plus plan also allows you to create custom reports beyond the normal marketing reports and sales reports you’d get.
We asked over 50 Shopify optimizers through HARO about the metrics they prefer to track and a few clear favorites emerged:
- Conversion Rate (CR)
- Click Through Rate (CTR)
- Conversion Value
- Time on Page
- Bounce Rate
- Scroll Depth
- Engagement on specific pages – like the catalog/category page
- Site Navigation Depth
- Page Views
- Element Views
- Add-to-Cart
- Net Purchases
- Time-to-Checkout
- AOV
- NPS (Post Purchase)
- Average Revenue per Visitor
- Abandoned Cart Rate
- Net Profit
The reality is, when it comes to tracking metrics, there is no one-size-fits-all answer. The most important metric to track will vary depending on your specific goals and objectives.
For some Shopify stores, it may look like this:
Some of my favorite goals to track on Shopify stores are
- Drive click-through on ads.
- Increase sales of specific products.
- Improve navigation of the main page.
Jessica Kats, E-commerce and retail expert at Soxy
Shopify Analytics: The 3 Metrics You Should Pay Extra Attention to
At Convert, we ask Shopify store owners to pay extra attention to 3 metrics:
- Conversion Rate (CR) – At the risk of stating the obvious, your conversion rate can be a good indicator of the success or failure of your experimentation. Ultimately, you want more sales and increased revenue. But this may not be the best metric if you’re not trying to measure how your actions impact people taking an action on your site.
Read on to find out which metric is the most important!
BTW, try this free conversion rate calculator.
- Average Order Value (AOV): While the AOV isn’t the most complete metric, you should still consider monitoring it. It is an indication of profitability across different segments—a broad metric that quantifies how much people buy from various categories.
When using it as your primary eCommerce metric, make sure:- The AOV is monitored across SKUs
- You track orders from distributors and bulk orders because it can throw AOV off
- AOV doesn’t indicate profit because it doesn’t subtract the cost of goods sold which is a significant expense.
- Average Revenue Per Visitor (ARPV): Unlike AOV which has orders as its randomization unit making it tricky to test properly, ARPV uses visitors as the randomization unit which is practical.
ARPV is the most important metric to track because it consists of both CR and AOV.
And Alex Birkett, Co-Founder of Omniscient Digital, agrees:
Your experiment objective is wildly important to both your experiment design and what you actually end up learning from your experiment.
In too many companies, the simple proportion metric of “conversion rate” is the universal experiment objective. This is fine if you want to learn if your intervention increases the proportion of people taking an action, such as buying *anything* on your website, but if that’s not what you’re trying to learn or if that’s not the needle you’re trying to move, it’s not the best metric.Many of the Shopify websites I’ve worked with have wanted to either
a) increase the purchase size (or average order value – AOV) for those who purchase or
b) increase the average value of visitors across a set of pages.For the former, you’ll want to set up AOV and revenue tracking. These require integration with your shopping cart, but most testing tools including Convert have native integrations with Shopify.
Convert also has a whole guide to optimizing AOV you can check out.When I optimize for AOV, I also track the conversion rate to ensure I’m not harming that metric.
But I look at it as a guardrail metric.
If I can increase AOV while maintaining my baseline conversion rate, I ship the experiment to production. I can also calculate the marginal value in the case that the conversion rate does drop by a little bit, but average order value makes up for it by increasing the average revenue per visitor of the experiment.This brings me to my second post-hoc reporting tool for Shopify: average revenue per visitor.
This, some argue, is the ultimate eCommerce store conversion optimization metric, as it is a composite metric that can be influenced by increasing conversions or by increasing the value of each conversion (i.e. the average order value).Average order value and average revenue per visitor due present some additional complexities in reporting.
Conversion rate is a binary metric and can be treated as a categorical variable (pass / fail, convert or don’t), and can be analyzed using something like a chi-squared test.Average order value is a continuous variable and is often influenced by outliers (for instance, someone comes in and purchases 10X the volume of a normal purchase – what do you do with that outlier?).
Average revenue per visitor is also influenced by outliers and is a continuous variable, but the underlying assumptions of the model tend to balance out at higher sample sizes.These two metrics are underrated in reporting for Shopify experimentation, but they do present some new challenges for analysis outside of simple conversion rate increases.
Most A/B testing tools can factor this in, however, and you won’t have too much trouble with inference.
Tool tip: Use the Convert pre-test analysis calculator to gauge their sample size requirements for their risk tolerance and the effect they wish to detect on the important metrics listed above.
What Elements & Insights Should a Great Shopify A/B Testing Report Include?
So what does a stellar Shopify A/B testing report look like? We’ll get to that in a second.
First, soak this in:
You can create a good and valuable test report only if you’ve started your test from a good hypothesis
Andra Baragan, Founder of ONTRACK Digital
If you want some pointers on how to create a solid hypothesis, we’ve got you covered.
Go read: Practical Hypothesis Building: The Way the Experts Do It
And check out this cool hypothesis generator for your next test.
Now that we have our bases covered, here’s more advice from Andra Baragan on how to construct an A/B test:
Any new A/B test should start by answering these questions:
Problem: what is the problem you are trying to fix?
Opportunity: how is your solution going to fix the problem?
Optimization track: how is this helping our client reach their objectives?Source: What data sources did you use to come up with your solution?
Finally, when it comes to reporting, Andra recommends going back and answering those questions with numbers.
In any test report, we include the following:
- Test duration: (how many days the test ran for)
- Test interval: (timeframe in which it ran)
- What we tested: (explain what you changed)
- Insights: (1-2 lines on why you tested it, what you observed that made you want to test it)
- What did you learn from the test? What are the next steps now?
- Is the test something that needs to be implemented on the live website? Do you want to reiterate the variation and test again? What is the action needed after this report?
We always get our test results from Google Analytics – we create custom segments of the users for each variation and then we can run those segments on all the relevant reports – this gives us an unparalleled view into the impact of the test on the user behavior.
Note: If you get your analytics off the Shopify dashboard and compare it to Google Analytics, there will be a few discrepancies due to how metrics are calculated. Here’s more information on why that happens.
Structuring the Report
The structure of your report can vary based on who you’re presenting it to—executives don’t need as much detail as your testing team does. But, your report should typically include these aspects:
- Slide 1: The purpose of the test -Why did you run the test, and what was your hypothesis that led you to design this specific test?
For stakeholders and your broader organization, you can keep this pretty high level. When presenting to your testing team, include context from previous tests (if applicable) and dive deep into the metrics you hoped to move.
- Slide 2: The details of the test – Show the different variations of the test and add a brief note to explain the differences. Include when you ran the tests, how long they ran for and an overview of visitor count by variation.
When presenting to leadership or other teams, you can leave details out that aren’t relevant to the learnings or insights. For your testing team, you can expand this slide or page to cover every tiny detail.
- Slide 3: The results of the test – Show the percentage lift or loss, conversion rates from different variants, and the statistical significance of the tests.
Stakeholders care about results, making this one of the most important facets of your report. Highlight wins and the KPIs that moved in the right way. Remove outliers that aren’t relevant to the result. Remember, you have to appeal to their self-interest. Give them something they can that makes them look good.
For your testing team, you can spend more time on the losses and which metrics failed to move the way you expected.
- Slide 4: The lessons learned from the test – If the test didn’t have any clear wins, this is your chance to use data to tell a story. Explain to stakeholders what the numbers on your report mean, what insights have you gained from running these tests and how you plan to generate new hypotheses for future tests.
This is also very important for your testing team. The lessons you learn through fails can determine the next steps for the team.
- Slide 5: The impact on revenue: If you can, try quantifying the percentage lifts you showed earlier with YoY projected revenue impact.
Remember for executive stakeholders to be interested in experimentation, you have to show them the impact on the company’s bottom line. If you don’t have any projected revenue to show, ensure that your learnings include a plan to run future tests that might have an impact.
Since there’s no one way of doing this right, we asked a few experts to share how they structured their reports and this is what they said:
I have a very standard method of structuring reports which includes:
- Overview
A quick, plain-language summary of what we tested, why we did it, what we observed and what we intend to do next.
- Test concept
- Experiment creative
- Dates and duration
- Metrics
- Pages
- Hypothesis
- Analysis
- Results
In my opinion, it’s imperative that every report includes the full raw results to allow them to be interrogated by others and also for the benefit of posterity.
We may take for granted that we can access the results in our A/B testing tool right now, but what about in a year? Two years? Three?
- Next steps
Based on what we saw in this experiment, what will we do next?Oliver Palmer, CRO consultant at Oliver Palmer
Our A/B test reports always include the following elements:
1. A clear description of the changes that were made in each version;
2. The results of the experiment, including which version performed better; and
3. Recommendations for further experimentation based on the results of the A/B test
These reports help us to understand what works best for our store and make informed decisions about how to improve our conversion rate.
Luke Lee, CEO of PalaLeather
- “Experiment viewed (page) – How many people saw the experiment?
- Experiment viewed (element) – If the experiment is only shown on scroll, how many people saw it?
- Experiment dwell – On desktop, did the user’s cursor hover over the experiment area?
- Experiment interaction – Did the user interact with the experiment? (Track each element individually)
- Time on page
- Time to checkout”
Alex Halliday, Founder and CEO of AirOps
Here’s a quick example of what one of ONTRACK Digital’s activity reports looks like:
(You can use this as a template for your report.)
Slide 1:
- Brand name
- Report name
- Time period

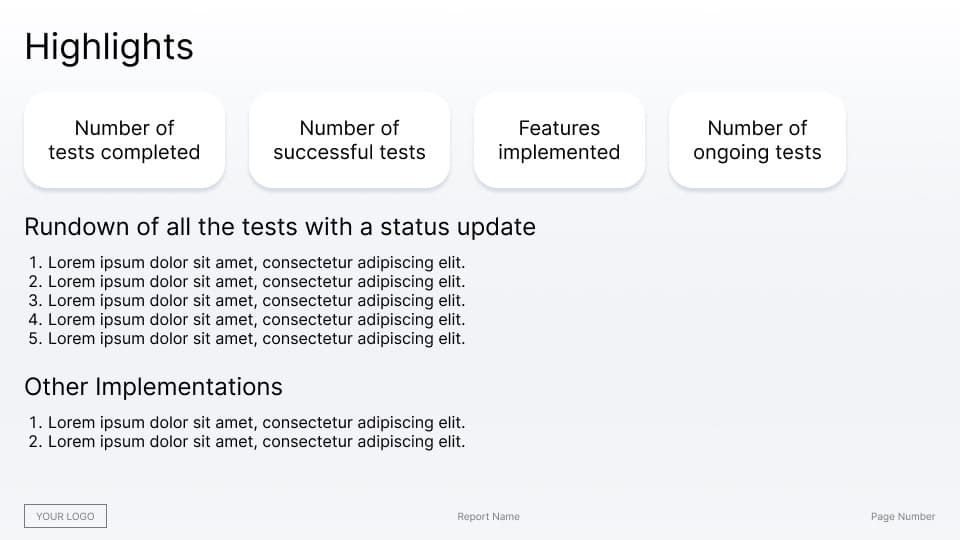
Slide 2:
Highlights of the test
- Number of tests completed
- Number of successful tests
- Features implemented
- Number of ongoing tests
- Rundown of all the tests with a status update
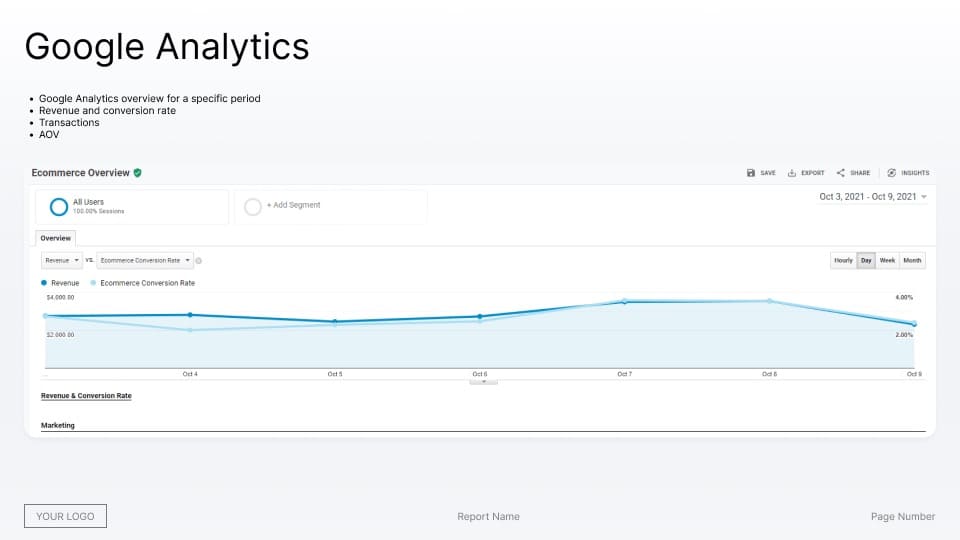
Slide 3:
Google Analytics overview for a specific period
- Revenue and conversion rate
- Transactions
- AOV
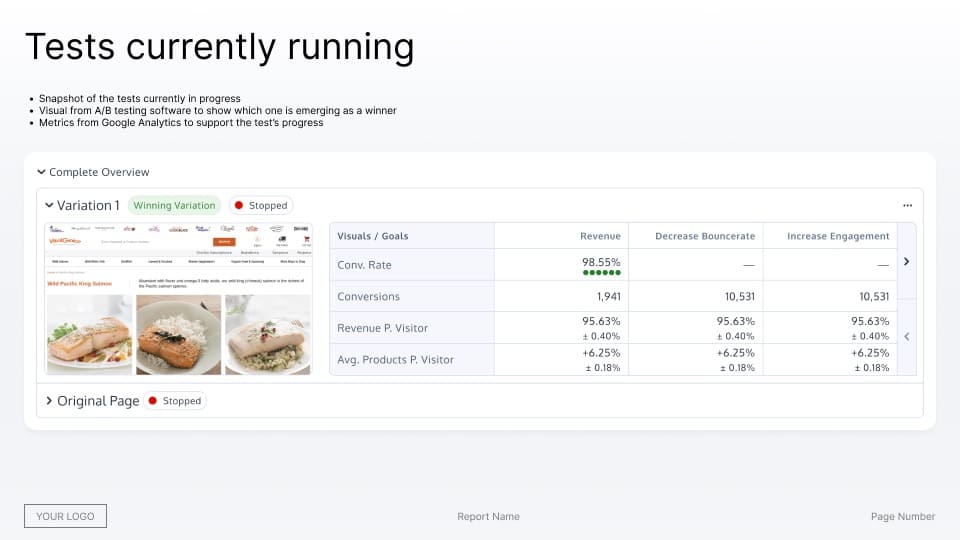
Slide 4:
Tests currently running
- Snapshot of the tests currently in progress
- Visual from A/B testing software to show which one is emerging as a winner
- Metrics from Google Analytics to support the test’s progress
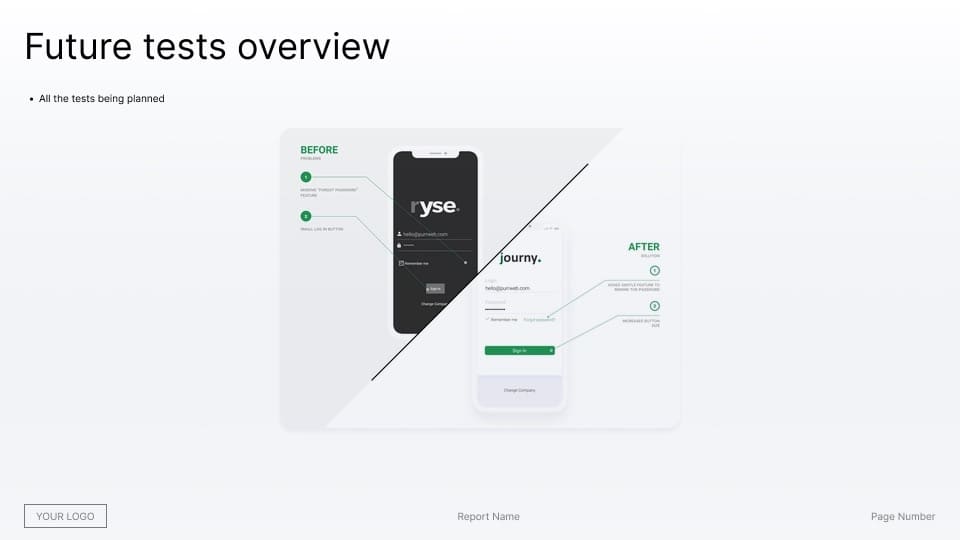
Slide 5:
Future tests overview
- All the tests being planned
You can have one slide to explain each test accompanied by a visual.
Covering Goals & KPIs
Goals and KPIs go in the “details of the test” section so you can explain the experiment’s objective.
Make sure to add a note to explain your choice. You may be grilled on why you chose a specific goal or KPI to track over others.
Quick Recap: Key performance indicators are simple metrics that reveal your current status against the business objectives. Goals are abstract concepts and you need to have a scalable measurement of the efforts that lead to achieving those goals.
Need help identifying which goals and KPIs to track? Grab our Ultimate Guide to Using Goals in A/B Testing.
We also asked a few experts to chime in on which goals they track:
My favorite goal to test on Shopify stores is increasing engagement on the catalog page. Our products define the sales revenue and customer growth within the channel. Focusing on this goal and testing gives us resourceful insights on whether the page is being visited enough times. If the engagement is low, testing helps us figure out areas where we lack, prompting revamping of marketing efforts.
Aviad Faruz, CEO of Faruzo
In terms of goal-tracking, I generally pick one primary metric from the list below and then use the others as health metrics or counter metrics. It’s good to keep an eye on multiple numbers in case of unintended consequences.
- Bounce rate
- CVR (overall boost to conversion rate)
- AOV (average order value)
- Average revenue per visitor (blend of the two of the above)
- NPS or similar
I also like to segment users by:
- UTM source
- Device type
- Location
- New vs Returning Visitor”
Alex Halliday, Founder and CEO of AirOps
Goal-wise, there will normally be a leading indicator that we’re directly trying to influence (say, product pages viewed or interactions with a size/color filter) and then almost always Conversion and Revenue Per Visitor. Tracked goals should directly relate to the hypothesis and the commercial objectives of the experiment, so it’s rarely useful to track more than three or four at most.
Oliver Palmer, CRO Consultant at Oliver Palmer
We generally track two goals in our A/B tests: conversion rate and average order value. However, depending on the nature of the experiment, we may also track other goals such as click-through rate or time on site. It generally depends on the experiment. Other users and businesses may have different criteria for tracking their respective goals.
Our favorite goals to test on Shopify stores are conversion rate and average order value. We find that these are the most important metrics for our store and they provide the most insights in terms of how we can improve our store. However, every store is different and you may find that other goals are more important for your business. It really depends on what you are looking to optimize for.
Luke Lee, CEO of Palaleather
Adding Creatives For Visual Storytelling
Most A/B testing software you use will offer tables and graphs or ready-made templates of some sort that you can use when you export reports. You can add those graphics to your report (if they’re relevant, of course) and consider creating some of your own.
Your numbers tell a story. Just use the creatives to depict it visually. The trick is to use visualizations that are easy to understand, preferably in one go.
Annemarie Klaassen and Ton Wesseling over at CXL had gone down this path trying different methods to arrive at a solution that works. Here’s a quick summary of their advice:
Tip 1: If you’re unsure, stick to the norm—Excel spreadsheets
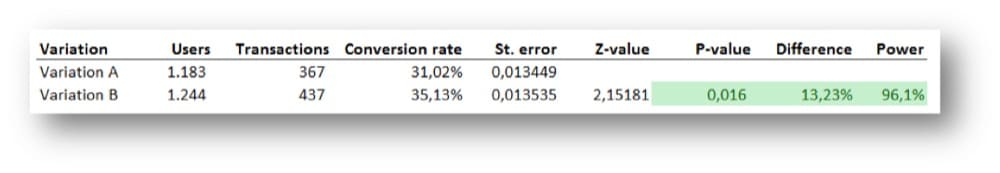
You can see the lift and impact right away. Also, you can color code the winner so everyone can see which variant won easily.
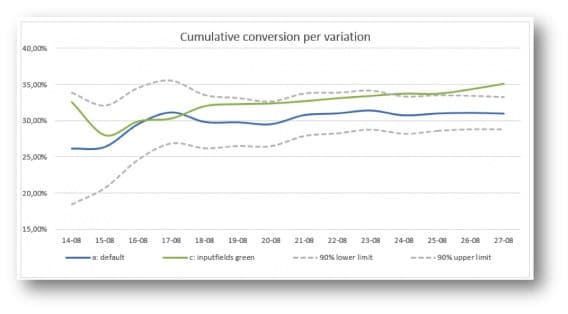
Tip 2: Add a graph
You can look at the conversion rate per day over time and add the lower and upper limit of the default variation.
However, this will not give you a clear answer to which variant won and how were the KPIs impacted; only show you that there is a stable effect which is not interesting for stakeholders.
Tip 3: Emulate statisticians
Another way (possibly more accurate) is to replicate what statisticians do: 2 bell curves, a critical value, and a shaded area. But the problem is it’s too difficult to explain it with clarity.
So Annemarie and Ton came up with this:
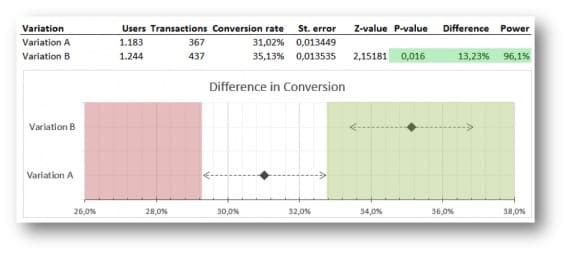
Two clear points to show the conversion rate of both the variants. The dotted line represents the confidence intervals.
“If the conversion rate of variation B lies outside the reach of the confidence interval of A, variation B is significantly better. The green shaded area accentuates this. A dot in the red area would mean that the variation is performing significantly worse.”
It took them a few more tries to get it just right. What they ended up with was a more consolidated version that made sense to their team and they were able to automate the production of the creatives.
You can read the full post to see what they ended up with in the end.
P.S. You don’t have to overcomplicate this. Make sure you have creatives that back your results and learnings and ensure that it’s easy enough for everyone to understand.
Covering Targeting & Experiment Design
How you designed an experiment and which audience segment was targeted is just as important as what you learned from it, especially since you have to use those insights to construct future tests.
These go in the “details” section as well. You might want to abstract some information that isn’t relevant to the C-suite or present an abridged version of it.
Need more effective ways to target audiences so you can run better experiments? Check out: Audience Targeting with A/B Testing: How Precise can Your Segments Get?
Here’s how the experts approach targeting & segmentation:
Different experiments will target different user segments, such as repeat customers or individuals who have seen your main product page. You can target British clients with UK English if you have users from all around the Anglosphere. By segmenting your audience, you can expose your experiment to only the specific number of visitors who meet your criteria while excluding those who don’t.
Before you run A/B testing in your store, you need to figure out which section of your audience is suited for your hypothesis. Segmentation guarantees that the correct experiment is shown to the correct clients.
Lulu Albanna, Co-Founder – WRC Media
Explain why you made these specific choices. Was it the result of a previous experiment? Or, did you arrive at a certain hypothesis based on conversion research?
Paul Somerville, Technical Manager at Electric Scooter Guide, also recommends sharing where the test was triggered and why that’s important:
We’ve conducted numerous A/B testing for features like live chat, call-to-action buttons, product pictures, upselling positioning, landing pages, navigation menus, and more as a Shopify company.
For example, A/B testing helped us establish the right balance of cross-selling and upselling without annoyance or friction in the customer experience.
We noticed that our audience liked highly relevant suggestions immediately on product pages rather than those presented during checkout after doing several experiments, and as a result, we increased the average transaction value.
Zeroing in On Segmentation
All tests don’t start with an audience segment in mind. Often, the objective of the test is to find out which segment responds to a change better.
So if you intend to define audience segments post the test is completed, make sure you include your findings on that in the “results” and “learnings” sections of the report.
Some common segmentations you’ll want to include in your report:
- Geographical
- Behavioral
- Weather
- Technographic
All of these will help you refine the results you have to better understand your audience and design superior tests.
However, you should keep in mind that post-segmentation can run into three common issues—having too small a sample size, comparing multiple segments, and focusing on the completely wrong ones.
But you can overcome these common issues with this guide: What is Post-Segmentation in A/B Testing?
Note: You can also get advanced with your post-segmentation—segment audiences based on cookies, your data layer, or even HubSpot lists.
Conveying the Value of Shopify A/B Testing, Internally & to Clients
Now that you know what your Shopify A/B test report should look like, here’s some advice from our experts:
- B2C vs. B2B – Show them the right path
The purchase cycles in B2C are much shorter and there’s a lot more traffic so you ideally have the potential to run a lot of tests. But, you’ll find most brands are still focused on the “tried and tested” channels for acquisition which are becoming unsustainable because of new privacy updates that result in poor data. The result? A staggering rise in the cost of customer acquisition. Explain to your clients/stakeholders that you cannot outspend all your competitors.
- Play to the interests of the leadership
The real value of A/B testing lies in the insights you glean from experimentation. But these aren’t useful to the founder and other stakeholders. They are less likely to be impressed with learnings and more interested in “wins.”
- Don’t set the wrong expectations
Of course, you should try to show the impact on revenue but the key phrase here is: when possible. Don’t project revenue based on an increase in conversion rates or average order value.
Instead focus on what was tested:
- Be specific about what you did and create visual and pertinent reports.
- What were the learnings? This can come from a metric like CR or ARPV moving. Fixate not on the movement but if the hypothesis was proven right. If so, what does the causal relationship reveal about your audience segments?
- What will you do with this insight? Will you refine the positioning? Or perhaps improve the site design?
- What does this mean for the business as a whole? And can it take the brand one step closer to meeting the business objectives?
- Add context to the numbers you’ve presented
You have to let people know, in no uncertain terms, what they’re looking at. That could mean color coding, adding industry benchmarks, showing averages, audience segments, or even showing how much different channels cost.
Following this approach ensures you aren’t always under pressure to get quick wins.

You can refocus your attention on what experimentation is about—learning. But the key isn’t prioritizing one thing over the other.
The best experimentation agencies focus on interest and buy-in as much as what they’re testing. A real balancing act between enthusiasm (✅Yes! Experiments can grow businesses) and setting inaccurate expectations (❌our revenue will double).
The way forward is (*drumroll please*) education. Grab a copy of “Experimentation Works”—a jargon-less read that will guide you to run better tests and share actionable insights.
And if you’re looking for an A/B testing tool that can help share your load, give Convert a try. It’s free for 15 days—no credit card required.