How Our Customers Use Parse.ly and Google Analytics In Tandem

We’re going to be real with you. We know Google Analytics is the industry standard web analytics tool, and something you probably incorporated into your marketing plans long ago. It’s not going anywhere any time soon.
But there’s a reason people still invest in Parse.ly each year: it provides an easier and more functional way to access content analytics.
The largest differences in how organizations use Google Analytics (GA) and Parse.ly to source metrics on their web properties come down to two things: access and inertia.
Table of contents
The use cases for Parse.ly and Google Analytics
We surveyed Parse.ly customers to learn how they actually use our product alongside GA to find and act on the data they need. Here is the breakdown of the core things they track and which tool they rely on.
Analytics access
Google Analytics is usually in the hands of a small group of analysts, business intelligence, data scientists (and sometimes marketers). They are gatekeepers who serve as a dedicated data-producing function for larger teams of end-users, like a newsroom. They use Google Analytics for deep analysis.
Parse.ly is generally the tool the data team uses to put metrics into the hands of end users. They use it to offload the many day-to-day questions they would otherwise have to answer. They give Parse.ly to editors, journalists, marketers, and others who create and publish content so they can log in and look at what is (and isn’t) working. Without Parse.ly, their organization would be much less data-driven as their dedicated data teams have limited bandwidth to source and provide answers.
Team inertia
Organizations frequently suffer from inertia. They’ve been using Google Analytics as their reporting source of truth for a decade, sometimes longer. They’ve set up dozens (or hundreds) of reports, architected their site in a certain way, and created business processes and systems of truth—all based on the existing use of GA.
They could source much of the same data from Parse.ly, and it would generally be easier. But GA’s tentacles are so entrenched that the mere thought of changing things, even for the better, seems unimaginable. Many even use GA’s API to create their own version of the same functionality that Parse.ly provides, but they’re okay with the way things are. “It’s just the way it’s done.”

The areas where both tools shine are vastly different, and that much is showcased in our comparison. No one is arguing that GA has Parse.ly beat in areas like tracking search terms and ad spend. The sheer amount of big data Google Tag Manager and Google Ads collect allows teams to pinpoint specific audience segments, long-term trends, etc. within GA.
Where GA doesn’t shine, however, is usability. It’s extremely difficult to actually put together a report (that has to be custom, by the way) to simply explain content performance based on the engagement metrics you need.
That’s where Parse.ly comes in.
Let’s look at real-life examples of how Parse.ly customers use our tool to manage their content metrics in tandem with GA.
Note: These examples are anonymized to protect competitive advantages among industry workflows and best practices.
Parse.ly customer #1: Local media conglomerate
Who we interviewed: Director of Web Development
How they use Google Analytics:
Google Analytics is our key report generator, but it’s complicated. It’s great for doing deeper dives into website performance reports over long periods of time, but those become heavy very quickly. As far as content goes, we tend to group pieces of content that have similar sources or pages and create custom reports like total impressions, session data, entrance and exit pages, etc.
How they use Parse.ly:
We really like Parse.ly for real-time stats and week-by-week author management. We prefer the look and feel of the visualizations in Parse.ly. It’s also great for identifying source referrals and understanding how certain pieces are performing over specific time periods. Overall, it offers a much easier and faster way to see an overview of site and content performance.
Their analytics workflow:
In reality, I almost always have multiple tabs open, including GA, SEMrush, Parse.ly, and our server for site health. While we’d love to have all of this information from one source, we know that’s not currently possible. GA gives us big-picture and drill-down information on site pages, and Parse.ly is our tool for at-a-glance and content-specific performance.
Parse.ly customer #2: Large direct-to-consumer (DTC) company
Who we interviewed: Head of Content Marketing
How they use Google Analytics:
There’s three main things we use GA for. First, it’s to track our paid spend on search. Second, it’s to report on our audience demographics. And then we also use it to report on the purchases made on our site.
We have a number of reports we’ve built out that we repeat each week. We haven’t yet made the switch to GA4 so I imagine that will be interesting when we do get around to it.
How they use Parse.ly:
One of the biggest things for us about Parse.ly is that it helps us prove the worth of our blog to the rest of the company. It’s an easy way to share numbers and “aha moments” with both the people directly creating content and with all the other team members who are what I call “content-adjacent.”
We use Parse.ly to analyze content success, mainly by whether it performs well in organic search and social referrals, engaged time, and activity viewed after this post. Basically—are we getting readers to our site? Are they finding what they were looking for? Did we keep their attention after the initial hit?
And we’ll use that frame of reference to analyze the topics we write about, individual articles or writers, the team’s work over a given week or month, distribution strategies, and so on. Sometimes we feed insights back to our web design team to help inform new layouts and page structures.
Their analytics workflow:
For the most part, our content team lives in Parse.ly and our performance marketers live in GA. There’s some overlap, especially when we coordinate on a campaign. Our CMO has organized us to put together monthly “big picture” reports for her which blend numbers from both sources.
Parse.ly customer #3: Large national news group
Who we interviewed: Managing Editor of Digital
How they use Google Analytics:
I’m the only person using Google Analytics in our newsroom, but I do use it multiple times a day. For example, this morning I’m writing reports for department heads about audience patterns over the past week. I do pull some of that information from both tools. I also use the Google API for custom dashboards and integrate that with Google Sheets, where I can specify what data I want pushed into the spreadsheets.
How they use Parse.ly:
Basically all of my team is in Parse.ly looking at specific pages, like how a push alert or homepage is performing. Our reporters are diving into data at the post- or author-level to assess performance. Parse.ly is great for our staff because it’s easier to get top-level metrics to look at their own performance. I use Parse.ly to track engaged time because it’s one of our core KPIs and easily one of the best parts of Parse.ly.
Their analytics workflow:
I think we could get all the data we need from either GA or Parse.ly, but there are certain things that are just easier in each tool. We use GA for our big trends and Parse.ly for specific posts and real-time decision-making. We track conversions in both places, but most of our editors are more focused on clicks, traffic, etc.
Parse.ly customer #4: Major media organization
Who we interviewed: Managing Editor for Digital
How they use Google Analytics:
GA is our deep-analysis tool; it’s what we use for corporate reporting because it’s standardized across the entire company. And I can easily run a daily report in Google Sheets for predictions and trends. We also track our conversions, page views, and search results in GA.
How they use Parse.ly:
Parse.ly is the tool all of our editors use, allowing me to get a quick status check for how specific authors and pieces are performing. I can actually see who is logging in and using Parse.ly. We also use it for tracking traffic by tags, which is how we find out which types of stories to publish more or less of.
Their analytics workflow:
We use WordPress VIP to connect our content teams across departments, which works great with Parse.ly. I honestly don’t know how many news organizations have put analytics in the hands of their reporters like we can with Parse.ly, but it’s a perfect solution for us because they’re more invested in the outcome of future pieces when they can directly see whether their pieces are having an impact.
How to organize your analytics workflows
Perhaps during the migration to Google Analytics 4, you’ve become lost in the complexity of accessing content analytics. If this sounds familiar, you’re not alone. In fact, we published an entire guide to content analytics to help resolve some of these questions. Content analytics is where Parse.ly excels, and it’s why our customers continue to subscribe to our services. And it’s why we want to help you excel, too.
We definitely work more efficiently as a unit because of Parse.ly. Google Analytics is like using divining rods, or interpreting blood from chickens. We needed something more visual.
Ben Maxwell (Publishing Director, Network N)
So, as you start the process of mapping out your content analytics workflows, keep in mind who is currently looking at the data. More importantly, who isn’t? What metrics are being sourced, and how deeply are they diving into the data?
You can’t fill your analytics gaps if you don’t know where the gaps are. So, where do you start? You must first determine how content drives your business, which metrics matter for you to track that impact, and how you can get those insights into the hands of the people that need them.
1. Understand your customer journey
To make effective content, you have to understand the audience journey. Ask yourself questions that get to the root of your customers’ interactions with your business, like:
- How complex is our product or service?
- How will our customers make a purchase?
- What is the purchase lifecycle?
- How diverse is our customer base?
- What sets us apart from competitors, according to customers?
- Where do we get most of our leads?
Not only do these questions help you learn your customer journeys, but they can also help you understand your target audience.
2. Identify your business type
You can then place yourself into one of the following categories of business types and marketing strategies.
- High-consideration
- Sales-driven
- Low-cost occasional
- Low-cost habitual
- Trial-driven, product-led, and marketplace
- Free or ad-supported
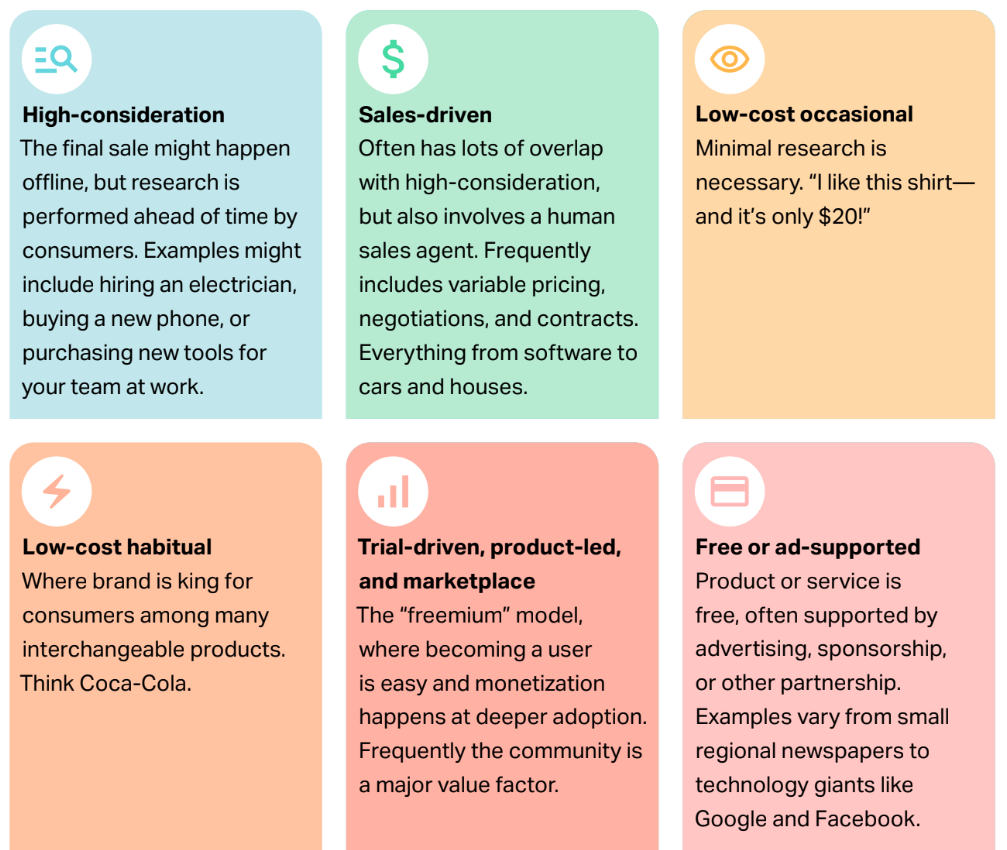
Each type of business performs better with specific types of content marketing strategies. Don’t worry if you feel like you fall into multiple buckets, nothing in business is simply black and white. But knowing where your strengths are will help you form a strong content strategy.
Learn more about each category, and their ideal content strategies, in Part One of our How to Do Better Content Marketing series.
3. Map out your KPIs
Based on your business type and ideal strategy, what are the KPIs that generate business success? Choose two to three core KPIs that truly exemplify your goals.
Identify the steps in the customer journey that lead to those KPIs. Is it engagement? Is it brand loyalty? Think through the KPIs, the metrics that align with them, and the step-by-step process for each. Then, pinpoint the people, processes, and technology you need to build (and track) the content that will help you meet those goals.
4. Strategize your content analytics workflows
Now that you know which metrics matter for your specific KPIs, determine the analytics tool that will help you measure them easiest and fastest, and which people on your team will benefit from looking at those metrics (and how often).
For example, if it’s a metric that should be monitored regularly by many on your team—like top performing topics or engaged time—Parse.ly, which lets you set up and send automated daily reports via email, is probably the best option.
On the other hand, if it’s something like ad ROI, Google Analytics might be a better choice.
Whatever you decide, put it in writing. Make formal workflows for tracking specific metrics and identify the process, frequency, and action items for each. Keeping track of your processes allows you to easily monitor and report on your metrics. You should also set up recurring content analytics meetings to ensure everyone feels comfortable with content performance and confident about making data-driven decisions.
5. Don’t be afraid to ask questions
Content analytics can be complicated! You don’t have to be a metrics expert, especially if you’re just getting started with some of these tools. Finding your ideal processes may take trial and error, especially as workflows tend to change over time as your goals and strategies evolve.
Wherever you are in your content analytics journey, the Parse.ly team is here to help you identify the workflows that make the most sense for your business.
Take a deeper dive into Parse.ly’s winning content analytics and reach out to our team to get started.