If you’ve been keeping an eye on your website’s performance, you’ve likely used Google Analytics. But as of July 1, 2023, the game has changed. Google has fully transitioned to Google Analytics 4, or GA4, and the older version, Universal Analytics (UA), is no longer supported. This is a big shift, especially when it comes to understanding your website’s reports.
GA4 doesn’t just offer new features; it changes the way you look at your data. If you’re used to the old reports from Universal Analytics, you might find yourself a bit lost with GA4’s new reporting system.
But don’t worry, that’s what this guide is for. We’re going to walk you through the new reports in GA4, explain what they mean, and show you how to use them to get valuable insights into your website’s performance.
If you’re just starting to set up your GA4 account, be sure to read our guide on the Top 10 Mistakes to Avoid in GA4 Setup.
Whether you’re using Google Analytics for the first time or switching from the old version, this guide is here to help. We’ll make it easy to understand the new GA4 reports. So let’s get started and see what cool things GA4 can do for your website.
Seeking an agency with expertise in Google Analytics 4 and a proven ability to deliver real results? Goodish Agency is here to meet your needs. Click here to explore our GA4 expertise.
Table of Contents
1. The GA4 Dashboard
2. Real-Time Reports: The Here and Now
3. User Reports: Know Your Audience
4. Traffic Acquisition Reports: Where Are Visitors Coming From?
5. Engagement Reports: What Are Visitors Doing?
6. Events Reports: Tracking Specific Actions
7. Conversions Reports: Measuring Success
8. User Explorer: A Closer Look at Individual Behavior
9. Conclusion
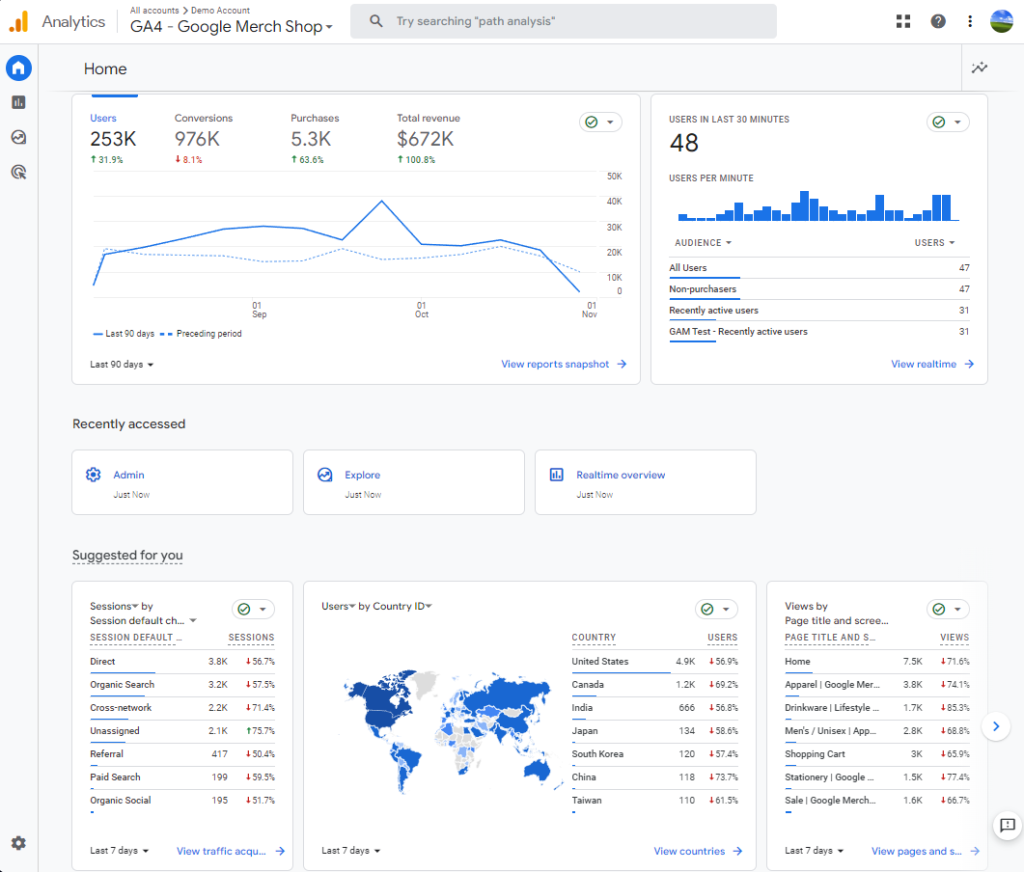
The GA4 Dashboard
When you log into Google Analytics 4, you’ll land on the GA4 dashboard. This is your main control center for all the reports about your website. If you’ve used the older version, things might look different, but don’t worry, it’s easy to get the hang of it.
Where to Find It
After logging in, click on your website’s name (called a ‘property’) on the left-hand side. That takes you to the dashboard.
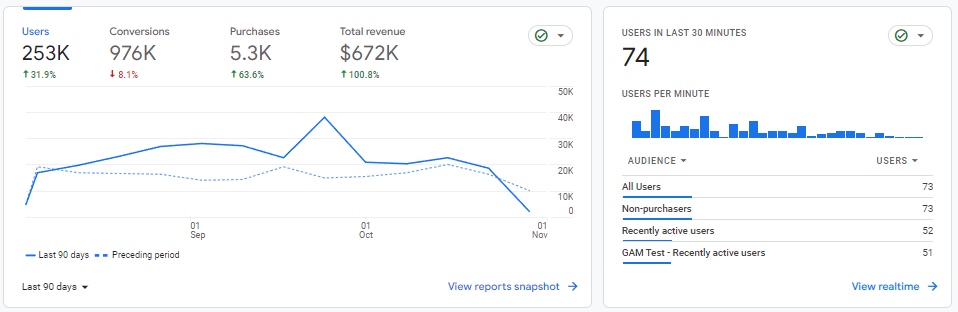
What’s On It
You’ll see different boxes, or ‘widgets,’ that show various types of information, like how many people are on your site right now or where they’re coming from.
How to Use It
On the left, there’s a menu that lets you go to different reports. Options like ‘Realtime’ and ‘Life Cycle’ give you more details on specific topics.
Make It Yours
You can customize the dashboard to show the information you care about most. Look for a ‘Customize’ button to start tweaking it.
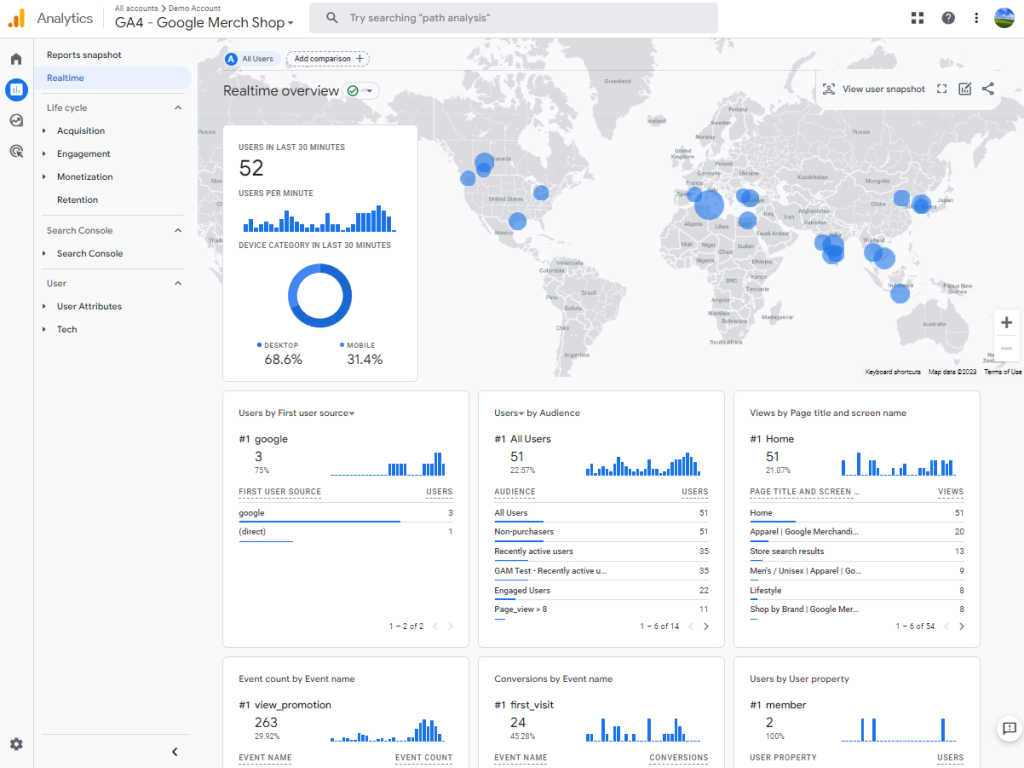
Real-Time Reports: The Here and Now
Imagine being able to see what’s happening on your website right at this second. That’s what real-time reports in GA4 do for you. It’s like having a live camera feed of your website’s activity. You can see who’s visiting, what they’re looking at, and even where they’re from, all in real-time.
What Are Real-Time Reports?
Real-time reports are a feature in GA4 that show you live data. This means you’re seeing information that’s happening right now, not yesterday or even an hour ago. It’s super useful for understanding what’s going on your website at any given moment.
Where to Find Them
To get to these reports, go to your GA4 dashboard. On the left-hand side, you’ll see a menu. Click on ‘Realtime’ from that menu, and you’ll be taken to the real-time reports section.
What You Can See
Once you’re there, you’ll see different kinds of information. For example, you can see how many people are on your website right now. You can also see what pages they’re looking at, and even what devices they’re using, like a phone or a computer.
Why They’re Useful
Because it helps you make quick decisions. Let’s say you just posted a new article or launched a sale on your online store. You can watch the real-time reports to see if people are actually visiting those pages. If they are, great! If not, you might decide to make some quick changes.
User Reports: Know Your Audience
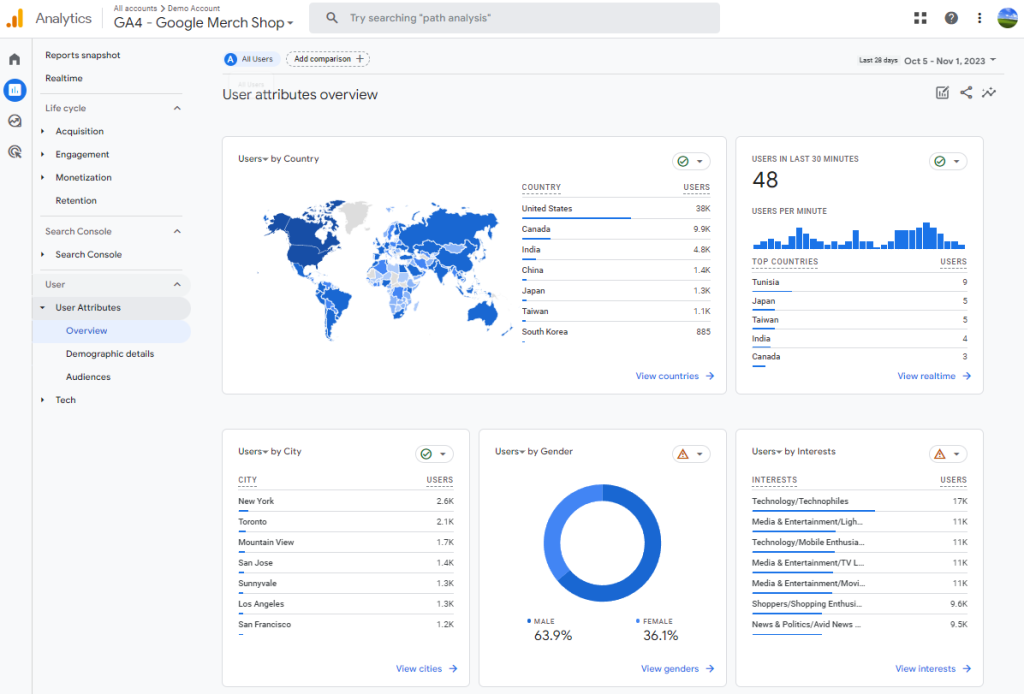
Knowing who visits your website is really important because it helps you offer what your visitors actually want. GA4’s User reports give you this valuable information. They tell you things like the age of your visitors, where they’re from, and what they’re interested in.
What Are User Reports?
User reports in GA4 are like a snapshot of your audience. They show you who’s visiting your website, giving you clues about what they might like or dislike. This is super helpful for making your website better.
Where to Find Them
To see these reports, go to your GA4 dashboard. On the left-hand menu, click on ‘User.’ This will take you to the User reports section where you can see all this great information.
What You’ll See
In the User reports, you’ll find different categories:
Demographics: This shows you the age and gender of your visitors.
Geography: Here, you’ll see where your visitors are coming from, like which country or city.
Interests: This part tells you what your visitors are interested in, like sports, fashion, or technology.
Quick Tips
Check Regularly: Trends can change, so it’s a good idea to check these reports often.
Combine Data: Use User reports along with other GA4 reports to get a full picture of your audience.
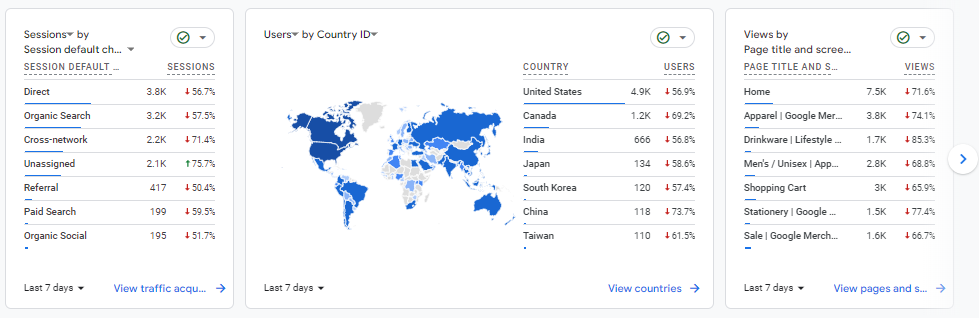
Traffic Acquisition Reports: Where Are Visitors Coming From?
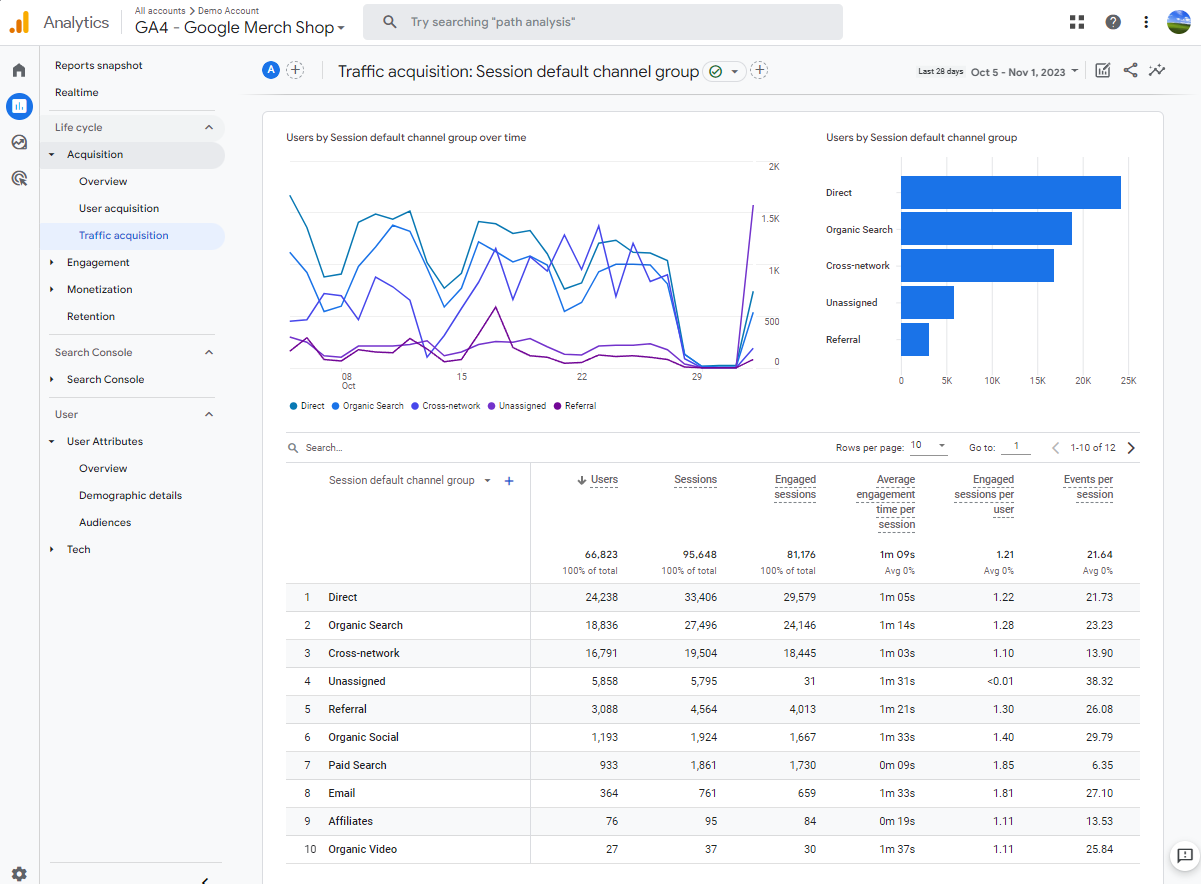
Traffic Acquisition reports in GA4 provide information on the sources that direct visitors to your website. Knowing these sources is crucial for effective marketing and content planning.
What Are Traffic Acquisition Reports?
Traffic Acquisition reports show the origin or the starting point from where visitors arrive at your website. This could be a search engine, a social media platform, or another website that links to yours.
Where to Find Them
To see these reports, go to your GA4 dashboard. On the left-hand menu, you’ll find an option that says ‘Traffic Acquisition.’ Click on that, and you’ll be taken to the section that shows you where your visitors are coming from.
What You’ll See
The report will show you different sources:
Organic Search: These are people who found you through a search engine like Google.
Direct: These visitors typed your website address directly into their browser.
Social: These are visitors who clicked on a link to your website from social media platforms like Facebook or Twitter.
Referral: These visitors found you through another website that linked to yours.
How to Use This Information
So why is this important?
Optimize Marketing: If you know where your traffic is coming from, you can focus your marketing efforts there.
Content Strategy: If people are coming from a search engine, it means they are looking for something specific. Make sure you provide it.
Budget Allocation: Knowing which channels are most effective can help you decide where to spend your advertising money.
Engagement Reports: What Are Visitors Doing?
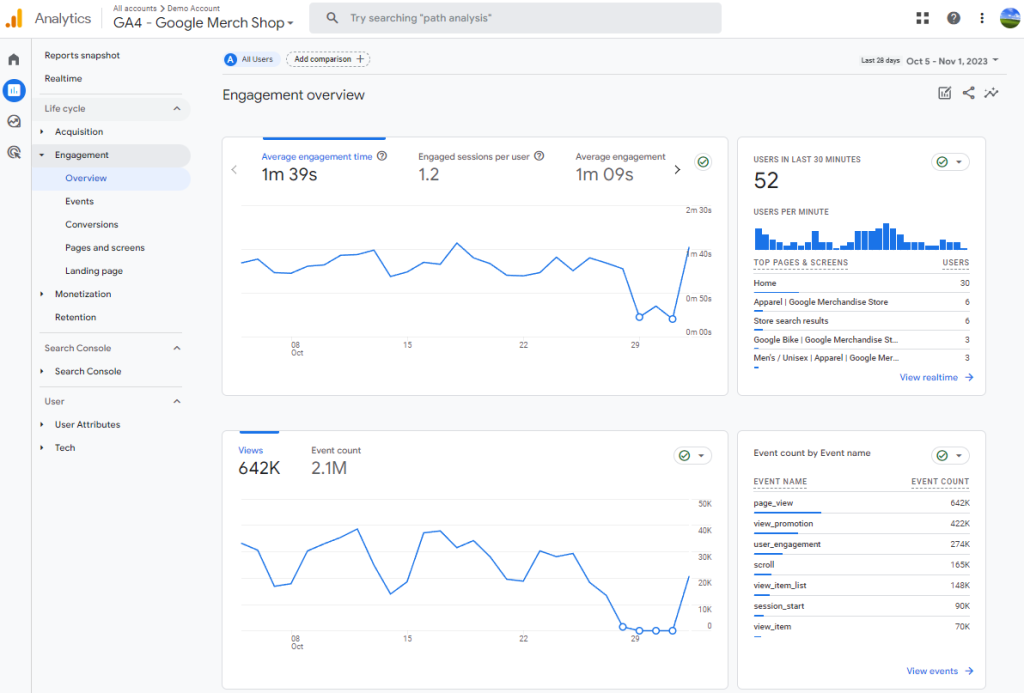
Engagement Reports in GA4 give you detailed information about how visitors interact with your website. This includes which pages they visit most often, how long they stay, and what actions they take, such as clicking on links or filling out forms.
What Are Engagement Reports?
Engagement Reports provide data on visitor interactions on your website. This data helps you understand what parts of your website are most interesting or useful to your visitors.
Where to Find Them
To access Engagement Reports, go to your GA4 dashboard. On the left-hand menu, you’ll see an option labeled ‘Engagement.’ Clicking on this will take you to the Engagement Reports section.
What You’ll See
In this section, you’ll find various metrics that measure engagement:
Page Views: The number of times a particular page has been viewed.
Average Engagement Time: The average amount of time visitors spend interacting with your website.
Events: Specific actions taken by visitors, such as clicking a button or completing a form.
How to Use This Information
Understanding visitor engagement has several practical applications:
Improve Content: If certain pages have high engagement, consider creating more content on similar topics.
User Experience: Low engagement time may indicate that visitors are not finding what they’re looking for, signaling a need for improvement.
Call to Action: If specific events like button clicks are low, you may need to make your call-to-action more prominent or appealing.
Events Reports: Tracking Specific Actions
Events Reports in GA4 focus on the specific actions that visitors take while they’re on your website. This could be anything from clicking a button to filling out a form. Knowing these actions can help you understand what visitors are interested in and what they’re not.
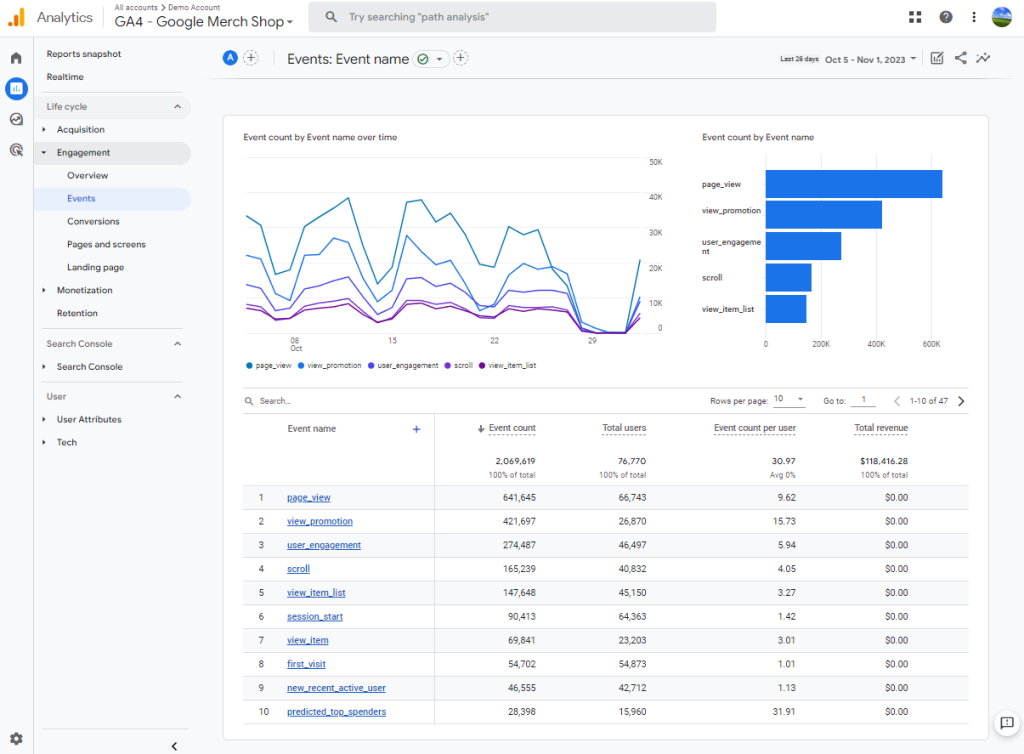
What Are Events Reports?
They collect data on particular actions that users take on your website. This is important because it helps you understand what features or content are engaging your visitors.
Where to Find Them
To view Events Reports, navigate to your GA4 dashboard. On the left-hand menu, you’ll find an option that says ‘Events.’ Click on it, and you’ll be taken to the Events Reports section.
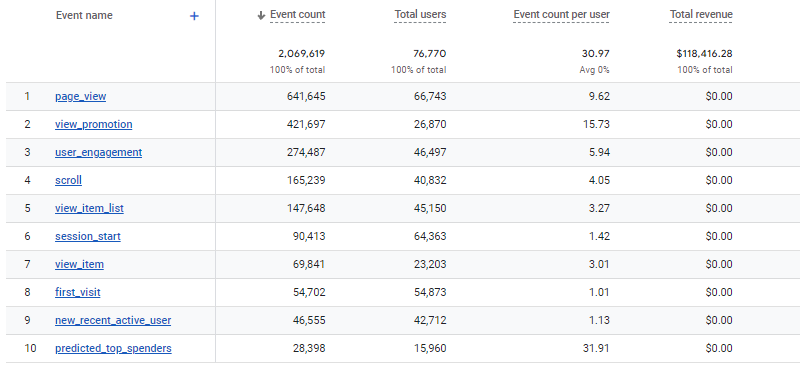
What You’ll See
In the Events Reports, you’ll find information on different actions:
Button Clicks: Tracks how often visitors click on buttons, like ‘Add to Cart’ or ‘Read More.’
Form Submissions: Measures how many times visitors complete and submit forms on your site.
Page Scrolls: Shows how far down a page visitors scroll, which can indicate how engaging your content is.
How to Use This Information
The data from Events Reports can be used in several ways:
Optimize Features: If a button or feature is getting a lot of clicks, it’s probably useful to your visitors. Consider making it more prominent.
Content Relevance: If forms are being submitted frequently, the content or service you’re offering is likely relevant and valuable to your audience.
Engagement Analysis: Low page scroll percentages could mean your content isn’t capturing visitor interest, signaling a need for improvement.
Conversions Reports: Measuring Success
Conversions Reports in GA4 help you measure the actions that are most important for your website’s success. These could be actions like making a purchase, signing up for a newsletter, or downloading a resource. Knowing how often these actions occur can help you understand how well your website is performing.
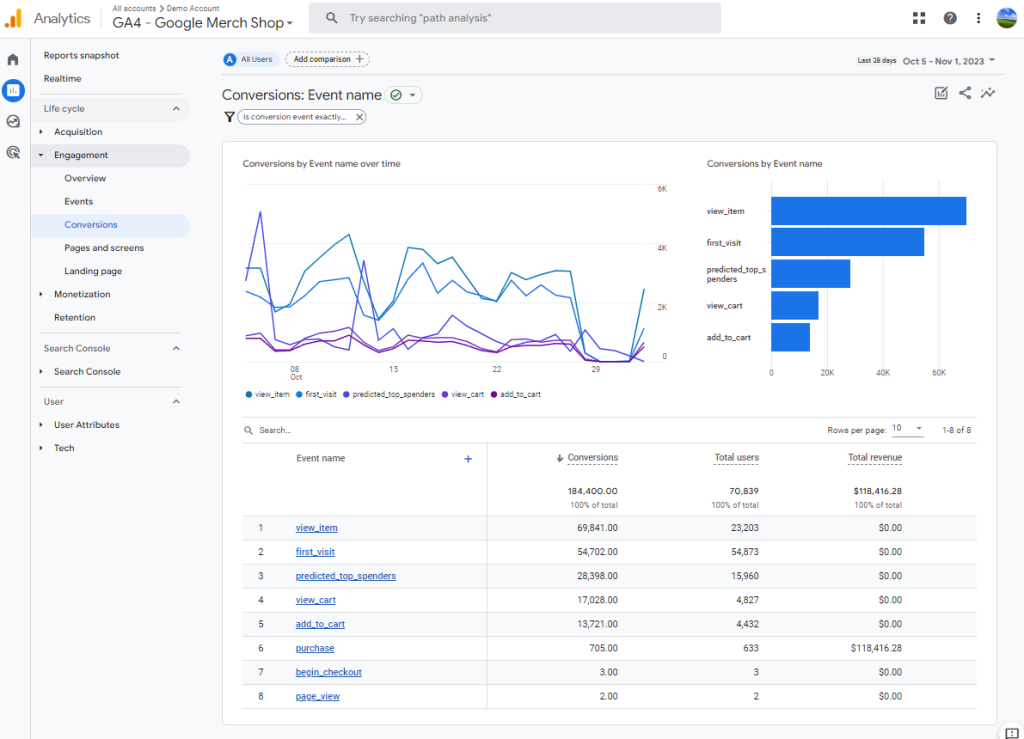
What Are Conversions Reports?
Conversions Reports provide data on specific actions that you’ve identified as important for your business. These are the actions that contribute directly to your goals, such as sales or lead generation.
Where to Find Them
To access Conversions Reports, go to your GA4 dashboard. On the left-hand menu, you’ll see an option labeled ‘Conversions.’ Click on that, and you’ll be taken to the Conversions Reports section.
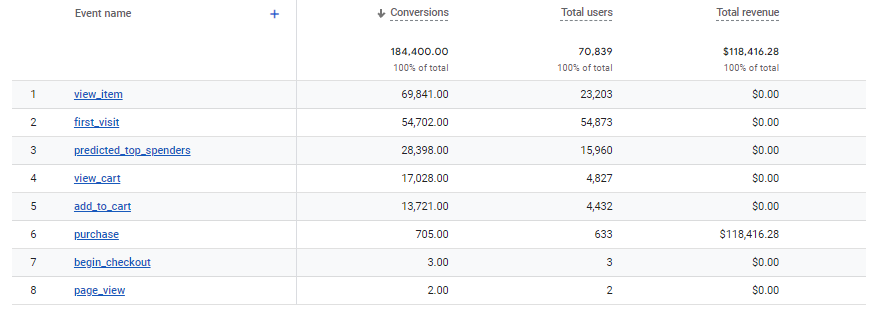
What You’ll See
In this section, you’ll find metrics related to conversions:
Conversion Rate: The percentage of visitors who complete the desired action, like making a purchase.
Total Conversions: The total number of completed actions, such as the total number of items purchased or forms submitted.
Conversion Value: The monetary value associated with conversions, if applicable.
How to Use This Information
Understanding your conversion data has several practical applications:
Goal Assessment: High conversion rates indicate that your website is effective at encouraging visitors to take the actions you desire.
Optimization: If conversion rates are low, you may need to make changes to your website or marketing strategies to improve them.
ROI Measurement: Knowing the total conversions and their value can help you measure the return on investment for your marketing efforts.
User Explorer: A Closer Look at Individual Behavior
The User Explorer report in GA4 allows you to look closely at how individual visitors interact with your website. This is a more advanced feature, but it’s extremely useful for understanding the specific steps that users take while navigating through your site.
What Is the User Explorer Report?
The User Explorer report gives you data on individual user behavior. This means you can see what pages a specific visitor looked at, what buttons they clicked, and even how long they stayed on each page.
Where to Find It
To find the User Explorer report, go to your GA4 dashboard. On the left-hand menu, look for an option that says ‘User.’ Under that, you’ll find ‘User Explorer.’ Clicking on this will take you to the report.
What You’ll See
In this report, you’ll find detailed information about individual users, such as:
Page Interactions: Shows the specific pages that the user visited.
Event Actions: Lists the actions, like button clicks or form submissions, that the user took.
Session Duration: Indicates how long the user spent on your website during each visit.
How to Use This Information
The data from the User Explorer report can be used for several purposes:
Personalization: If you see that individual users frequently visit certain pages, you can use this information to personalize their experience.
Troubleshooting: If users are dropping off at a specific point, you can identify the issue and fix it.
User Journey Mapping: Understanding the steps that individual users take can help you create a more intuitive and user-friendly website.
Conclusion
In this guide, we walked through all the important reports you’ll find in GA4. We talked about how to find out who’s visiting your site, where they’re coming from, and what they’re doing while they’re there. We also looked at how to track specific actions, like button clicks, and how to measure if you’re reaching your goals, like making sales.
The best way to get good at using GA4 is to spend time with it. Click around, look at different reports, and try to connect what you’re seeing to what’s happening on your website. The more you use it, the more it will make sense, and the better decisions you can make for your website.
Remember, you don’t have to be a tech expert to use GA4. It’s made to help you. So don’t be afraid to dive in and start using it. The more you learn, the better you can make your website, and that’s good for everyone—especially you and your visitors
We at Goodish agency are experts in digital marketing and we can help you to utilize AI to reduce your costs and boost your performance. Read more about our services.