How Many A/B Tests Should You Run a Month?

It’s an important question to consider for the success of your testing program.
Run too many tests and you may waste resources without getting much value from any individual experiment.
But run too few tests and you may miss out on important optimization opportunities that could be bringing in more conversions.
So, given this conundrum, what’s the ideal testing cadence?
To help answer that question, it makes $en$e to look at some of the world’s most successful and progressive experimentation teams.
Amazon is one such name that comes to mind.
The eCommerce giant is also an experimentation goliath. In fact, Amazon is said to run over 12,000 experiments a year! This amount breaks down to about a thousand experiments a month.
Companies like Google and Microsoft’s Bing are said to keep a similar pace.
According to Wikipedia, the search engine giants each run over 10,000 A/B tests a year or about 800 tests a month.
And it’s not just search engines running at this rate.
Booking.com is another notable name in experimentation. The travel booking site is reported to run over 25,000 tests a year which amounts to over 2 thousand tests a month or 70 tests a day!
Yet, studies show, the average company runs only 2-3 tests a month.
So, if most companies run just a few tests a month, but some of the world’s best run thousands of experiments a month, how many tests should you, ideally, be running?
In true CRO style, the answer is: it depends.
What does it depend on? A number of important factors you need to consider.
The ideal number of A/B tests to run is determined by the specific situation and factors such as sample size, complexity of testing ideas, and resources available.
The 6 Factors to Consider when Running A/B Tests
There are 6 essential factors to consider when deciding how many tests to run a month. They include
- Sample size requirements
- Organizational maturity
- Available resources
- Complexity of test ideas
- Testing timelines
- Interaction effects
Let’s deep dive into each.
Sample Size Requirements
In A/B testing, sample size describes the amount of traffic you need to run a trustworthy test.
To run a statistically valid study, you need a large, representative sample of users.
While, theoretically, you can run an experiment with just a few users, you won’t yield very meaningful results.
Low Sample Sizes Can Still Yield Statistically Significant Results
For example, imagine an A/B test where just 10 users saw version A and 2 converted. And just 8 users saw version B with 6 who converted.
As this chart shows, the results are statistically significant:
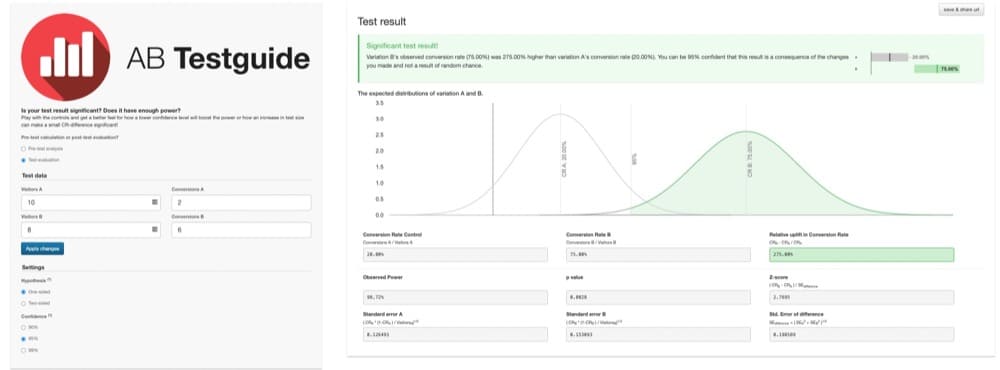
Version B appears to outperform by 275%. But, these findings are not very trustworthy. The sample size is too low to provide meaningful results.
The study is underpowered. It doesn’t contain a large, representative sample of users.
Because the test is underpowered, the results are prone to error. And it’s not clear if the outcome occurred just by random chance or if one version is truly superior.
With this small sample, it’s easy to draw incorrect conclusions.
Properly Powered Tests
To overcome this pitfall, A/B tests need to be adequately powered with a large, representative sample of users.
How large is large enough?
This question can be answered by doing some simple sample size calculations.
To most easily calculate your sample size requirements, I suggest using a sample size calculator. There are plenty of them out there.
My favorite is Evan Miller’s because it’s flexible and thorough. Plus, if you can understand how to use it, you can grasp nearly any calculator out there.
Here’s what Evan Miller’s calculator looks like:
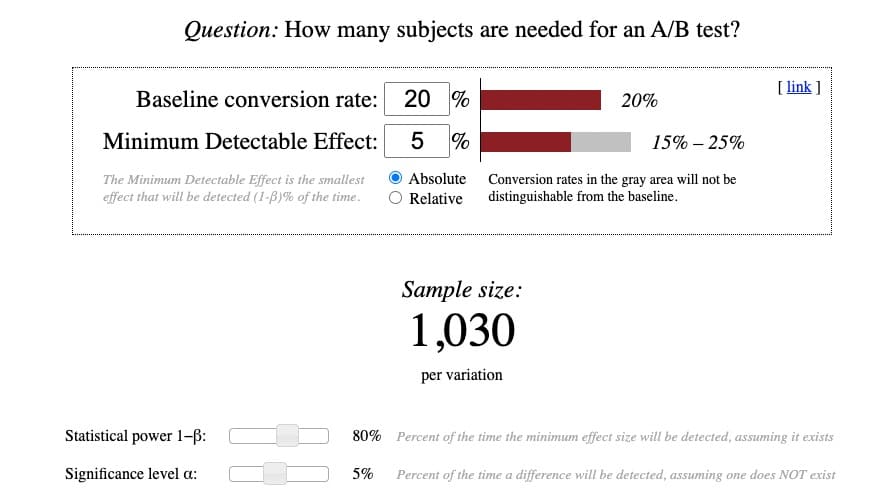
While the calculations themselves are fairly simple, understanding the terminology behind them isn’t. So I’ve attempted to clarify the complex:
Baseline Conversion Rate
The baseline conversion rate is the existing conversion rate of the control or original version. It’s usually labeled “version A” when setting up an A/B test.
You should be able to find this conversion rate within your analytics platform.
If you’ve never run an A/B test, or don’t know the baseline conversion rate, make your best educated guess.
The average conversion rate, across most sites, industry verticals, and device types, is between 2 and 5%. So, if you’re really unsure of your baseline conversion rate, err on the side of caution and start with a 2% baseline.
The lower the baseline conversion rate, the greater the sample size you’ll need. And vice versa.
Minimum Detectable Effect (MDE)
Minimum Detectable Effect (MDE) sounds like a complicated concept. But it becomes much easier to grasp if you break the term into its three parts:
- Minimum = smallest
- Detectable = want you’re trying to detect, or find, by running the experiment
- Effect = conversion difference between the control and treatment
Therefore, the Minimum Detectable Effect is the smallest conversion lift you’re hoping to detect by running the test.
Some data purists will argue this definition actually describes the Minimum Effect of Interest (MEI). However you want to term it, the goal is to anticipate how large of a conversion lift you expect to get by running the test.
While this exercise can feel very speculative, you can use a sample size calculator like this one or Convert’s A/B test statistical calculator to calculate the anticipated MDE.
As a very general rule of thumb, a 2-5% MDE is considered reasonable. Anything much higher is usually unrealistic when running a truly properly-powered test.
The smaller the MDE, the larger the sample size needed. And vice versa.
An MDE can be expressed as an absolute or relative amount.
Absolute
An absolute MDE is the raw number difference between the conversion rate of the control and variant.
For example, if the baseline conversion rate is 2.77% and you’re expecting the variant to achieve a +3% absolute MDE, the absolute difference is 5.77%.
Relative
In contrast, a relative effect expresses the percentage difference between the variants.
For example, if the baseline conversion rate is 2.77% and you’re expecting the variant to achieve a +3% relative MDE, the relative difference is 2.89%.
In general, most experimenters use a relative percentage lift, so, typically, it’s best to represent results this way.
Statistical power 1−β
Power refers to the probability of finding an effect, or conversion difference, assuming one really exists.
In testing, your aim is to ensure you have enough power to meaningfully detect a difference, if one exists, without error. Therefore, a higher power is always better. But the trade-off is, it requires a larger sample size.
A power of 0.80 is considered standard best practice. So, you can leave it as the default range on this calculator.
This amount means there’s an 80% chance that, if there is an effect, you’ll accurately detect it without error. As such, there’s only a 20% chance you’d miss properly detecting the effect. A risk worth taking.
Significance Level α
As a very simple definition, significance level alpha is the false positive rate, or the percentage of time a conversion difference will be detected — even though one doesn’t actually exist.
As an A/B testing best practice, your significance level should be 5% or lower. So you can just leave it as the default on this calculator.
A 5% significance level α means there’s a 5% chance you’ll find a difference between the control and variant — when no difference actually exists.
Again, a risk worthwhile taking.
Assessing Your Sample Size Requirements
With these numbers plugged into your calculator, you can now ensure your site has enough traffic to run a properly-powered test over a standard 2 to 6-week testing time period.
To verify, go into your preferred analytics platform and look at the historical average traffic rate of the site, or page you want to test, over a finite period.
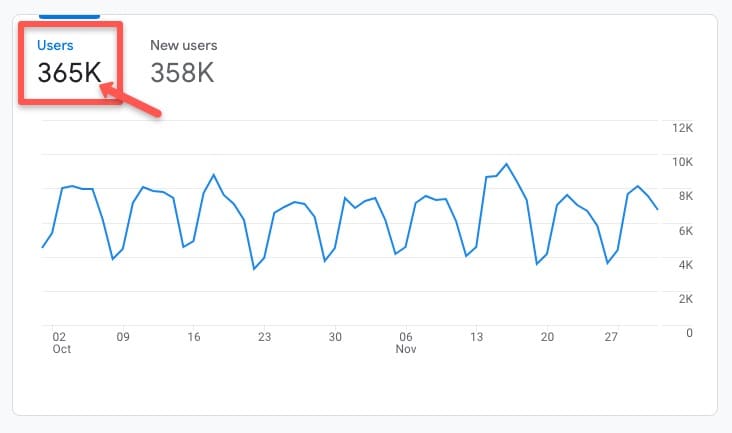
For example, in this Google Analytics 4 (GA4) account, by going to the Life cycle > Acquisition > Acquisition overview tab, you can see there were 365 thousand users in the recent historical time period between October-November, 2022:
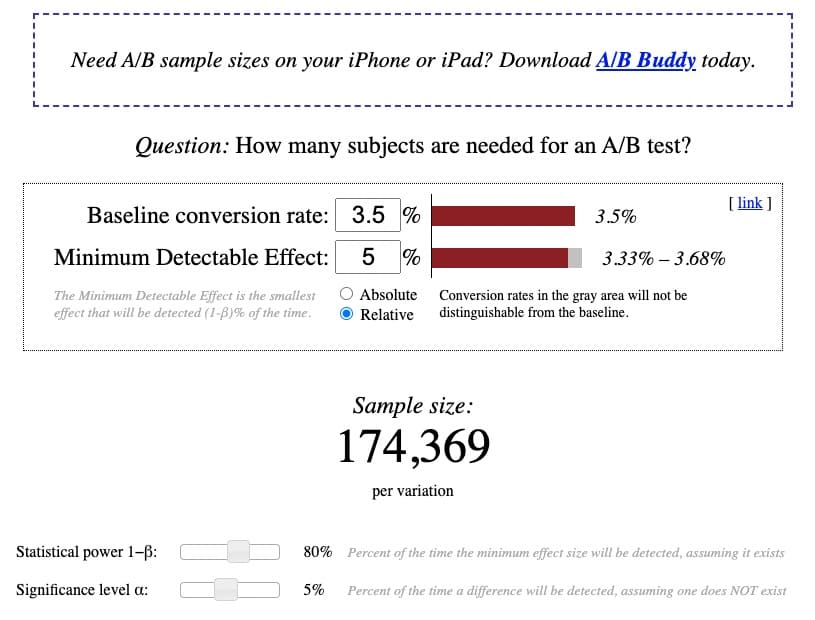
Based on a 3.5% existing baseline conversion rate, with 5% relative MDE, at a standard power of 80% and a standard significance level of 5%, the calculator shows a sample size of 174,369 visitors per variant is needed to run a properly-powered A/B test:
Assuming traffic trends hold relatively steady for the upcoming months, it’s reasonable to expect the site will achieve around 365 thousand users or (365 thousand/2 variants) 182 thousand visitors per variant within a reasonable testing time frame.
The sample size requirements are achievable, giving a green light to go ahead and run the test.
An important note, this sample size requirement verification exercise should always be done AHEAD of running any study so you know whether you have enough traffic to run a properly-powered test.
Additionally, when running the test, you should NEVER stop your test ahead of reaching your pre-calculated sample size requirements – even if results appear significant sooner.
Prematurely declaring a winner, or loser, before meeting sample size requirements is what’s known as “peeking” and is a dangerous testing practice that can lead you to make incorrect calls before the results are fully flushed out.
How Many Tests Can You Run if You Have Enough Traffic?
Assuming the site, or page(s) you want to test meet sample size requirements, how many tests can you run?
The answer is, again, it depends.
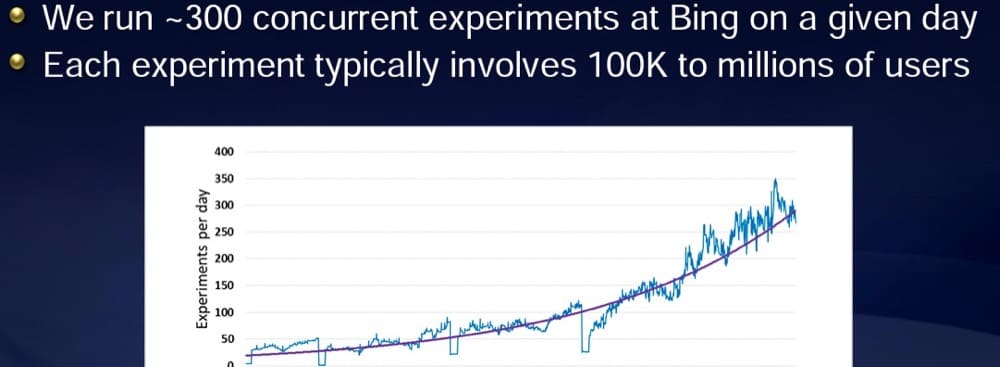
According to a presentation shared by Ronny Kohavi, the former Vice President of Experimentation at Microsoft’s Bing, Microsoft typically runs over 300 experiments a day.
But they have the traffic to do it.
Each experiment sees over 100 thousand users:
The larger your available traffic, the more tests you can run.
With any test, you need to make sure you have a large enough sample size to run a properly-powered experiment.
If you’re a smaller organization with more limited traffic, consider fewer higher quality tests.
At the end of the day, it’s not really about how many tests you’re running, but the outcome of your experiments.
Options if You Can’t Meet Sample Size Requirements
If you discover you can’t meet sample size requirements, don’t fret. Experimentation isn’t off the table for you. You have a few potential experimentation options available:
- Focus on traffic acquisition
Even large sites can have low traffic on certain pages.
If you find site traffic, or traffic on certain pages, doesn’t meet sample size requirements, consider focusing efforts on acquiring more traffic.
To do so, you can undertake aggressive Search Engine Optimization (SEO) tactics to rank higher in search engines and garner more clicks.
You can also acquire paid traffic through channels like Google Ads, LinkedIn ads, or even banner ads.
Both of these acquisition activities can help boost web traffic and give you a stronger ability to test what converts best with users.
However, if you do use paid traffic to meet sample size requirements, consider segmenting test results by traffic type as visitor behavior can differ by traffic source.
- Assess if A/B testing is the best experimentation method for you
While A/B testing is considered the gold standard of experimentation, results are only as good as the data behind them.
If you find you don’t have enough traffic to run a properly-powered test, you may want to consider if A/B testing is really the best experimentation option for you.
There are other research-based approaches that require far smaller samples and can still yield incredibly valuable optimization insights.
User Experience (UX) testing, consumer surveys, exit polls, or customer interviews are a few other experimentation modalities you can try as an alternative to A/B testing.
- Realize results may provide directional data only
But if you remain intent on A/B testing, you can still run tests.
Just realize, the results may not be fully accurate and will provide only “directional data” indicating the likely – rather than fully trustworthy – outcome.
Since the results may not hold entirely true, you’ll want to closely monitor the conversion effect over time.
That said, what’s often more important than accurate conversion figures are the numbers in the bank account. If they’re going up, you know the optimization work you’re doing is working.
Testing Maturity
In addition to sample size requirements, another factor that influences testing cadence is the maturity level of the testing organization.
Testing maturity is a term used to describe how entrenched experimentation is within an organizational culture and how advanced experimentation practices are.
Organizations like Amazon, Google, Bing, and Booking – who run thousands of tests a month – have progressive, mature testing teams.
That’s no coincidence.
Testing cadence tends to be closely tied to an organization’s maturity level.
If experimentation is ingrained within the organization, management is committed to it. As well, employees, across the organization, are typically encouraged to support and prioritize experimentation, and may even help provide testing ideas.
When these factors come together, it’s much easier to run an expedient testing program.
If you’re hoping to ramp up testing, it can be helpful to first look at your organization’s maturity level.
Begin by evaluating questions like
- How important is experimentation to the C-Suite?
- What resources are provided to foster experimentation?
- What communication channels are available to communicate testing updates?
If the answer is “none,” or close to it, consider working first on creating a testing culture.
As your organization adopts a more progressive culture of experimentation, it will be naturally easier to ramp up the testing cadence.
For suggestions on how to create a culture of experimentation, check out resources like this article and this one.
Resource Constraints
Assuming you already have some degree of organizational buy-in, the next issue to combat is resource constraints.
Time, money, and human power are all limitations that may limit your ability to test. And test quickly.
To overcome resource constraints, it can be helpful to begin by assessing test complexity.
Balance Simple and Complex Tests
As an experimenter, you may choose to run tests that range from super simple to crazy complex.
Simple tests might include optimizing elements like copy or color, updating images, or moving around single elements on a page.
Complex tests may involve changing several elements, altering page structure, or updating the conversion funnel. These kinds of tests often require deep coding work.
Through running thousands of A/B tests, I’ve found it useful to have a mixture of about ⅗ simpler and ⅖ more complex tests running concurrently at all times.
Simpler tests can give you quick, easy wins.
But bigger tests, with bigger changes, often yield bigger effects. In fact, according to some optimization research, the more, and more complex tests you run, the more likely your success. So don’t be afraid to run big swing tests, often.
Just be aware, the trade-off is you’ll spend more resources designing and building the test. And there’s no guarantee it’ll win.
Test Based on Available Human Resources
If you’re a solo CRO strategist, or working with a small team, your capacity is limited. Whether simple or complex, you may find 2-5 tests per month taps you.
In contrast, if you’re with an organization that has a dedicated team of researchers, strategists, designers, developers, and QA specialists, you likely have the capacity to run dozens to hundreds of tests a month.
To determine how many tests you should run, assess your human resource availability.
On average, a simple test may take 3-6 hours to ideate, wireframe, design, develop, implement, QA, and monitor results.
On the other hand, a highly complex test may take anywhere upwards of 15-20 hours.
There are about 730 hours in a month, so you’ll want to be very calculated about the tests, and number of tests, you’re running during this precious time.
Plan and Prioritize Your Test Ideas
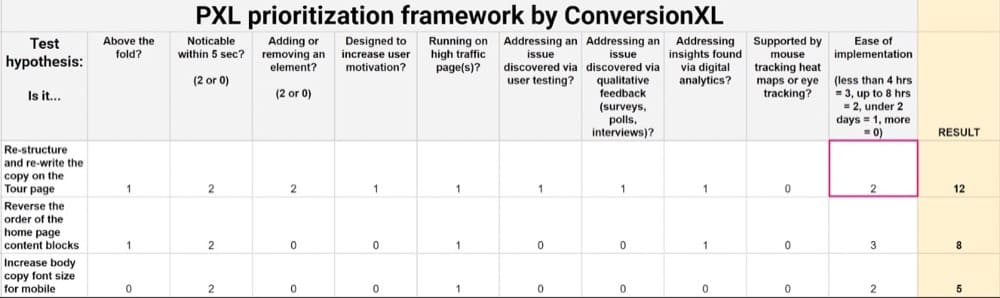
To help you map out your optimal testing structure, consider using a testing prioritization framework, like PIE, ICE, or PXL.
These frameworks provide a quantitative technique for ranking your top testing ideas, evaluating ease of implementation, and assessing which tests are most likely to lift conversions.
Upon conducting this assessment, your prioritized list of test ideas will look something like this:
With your top test ideas ranked, it’s also recommended you create a testing roadmap to visually plan your test timeline and next steps.
Your roadmap may look something like this:
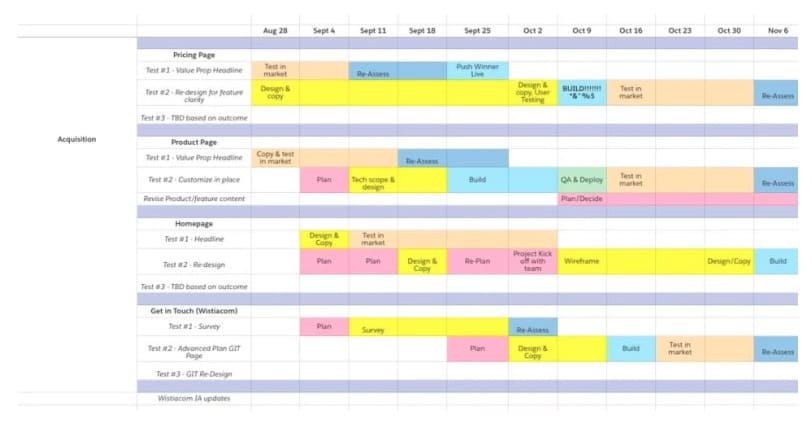
It should include:
- The list of ideas you’re planning to test, by page.
- How long you anticipate each testing stage (design, development, QA, etc.) will take.
- How long you’re planning to run each test, based on pre-calculated sample size requirements. You can calculate test duration requirements using a test duration calculator like this one.
By mapping out your test ideas, you’ll be able to more accurately determine testing cadence and capacity.
As you populate your testing roadmap, it may become very clear the number of tests you can run is based on the resources you have available.
Should You Run Multiple Tests at a Time?
But just because you can do something, doesn’t always mean you should.
When it comes to running multiple tests at a time, there’s great debate about the best approach.
Articles, like this one, by Experiment Nation leader, Rommil Santiago, bring up a contentious question: is it okay to run multiple A/B tests simultaneously?
Some experimenters will say, absolutely not!
They’ll argue you should only ever run one test, one page at a time. Otherwise, you won’t be able to properly isolate any effect.
I used to be in this camp because that’s the way I was taught nearly a decade ago.
It was strictly imparted to me that you should only ever run one test, with one change, on one page, at one time. I operated with this mindset for many years — much to the dismay of anxious clients who wanted more results faster.
However, this article by Timothy Chan, a former data scientist at Facebook and now the lead data scientist at Statsig, completely changed my mind.
In his piece, Chan argues, interaction effects are way overrated.
In fact, running multiple tests concurrently is not only a non-issue; it’s really the only way to test!
This stance is supported by data from his time at Facebook where Chan saw the social media giant successfully run hundreds of experiments simultaneously, many of them even on the same page.
Data experts like Ronny Kohavi and Hazjier Pourkhalkhali concur: interaction effects are highly unlikely. And, in fact, the best way to test for success is to run multiple tests at multiple times, on an ongoing basis.
So, when considering testing cadence, don’t worry about the interaction effect of overlapping tests. Test liberally.
Summary
In A/B testing, there is no optimal number of A/B tests you should run.
The ideal number is what’s right for your unique situation.
This number is based on several factors, including your site’s sample size constraints, the complexity of testing ideas, and the support and resources available.
In the end, it’s not so much about the number of tests you run, but rather the quality of the tests and the results you obtain. A single test that brings a large lift is far more valuable than several inconclusive tests that don’t move the needle.
Testing truly is about quality over quantity!
For more on how to get the most value out of your A/B testing program, check out this Convert article.