7 Key Steps to Learning & Improving From Your A/B Test Results

Your A/B test just finished but you’re not seeing the results you expected.
Everyone else is sharing case studies where they saw a huge lift with just a button color change or small tweak, but your test didn’t get any improvement in conversion, or worse, it seems to have lost money instead, and now you need to present this to your boss.
Well, what if your test isn’t actually a loser?
What if it’s a winner in disguise?
And if it is a loser, what if a losing test is actually a good thing?
In this guide, we’re going to help you get a deeper perspective on your A/B test results so you can analyze and break them down to find the gold.
We’ll cover why learning from your A/B tests is so important and why losers can get you sales. We share a process you can follow so you can fully analyze your tests step by step and feel confident about what you’re seeing, win or fail.
Better still, we’ll help you go from being data anxious and not wanting to check your analytics, to being confident in sharing your results with your peers.
So let’s dive in…


Why Do You Need to Learn From A/B Tests?
For a start, there’s the obvious cost involved. Each test costs money to set up. If you have losing variants, then you will also see a drop in sales for that variant.
Here’s the thing though:
A/B testing (and CRO in general) is not only about making more money. It’s about buying data. Data on your audience can help you understand them better and provide a better product and service. This then leads to more sales and an improved customer experience, and even insights into new product offers.
The more you learn about the people you serve, the better you do. That’s why it’s so important to test and test often — even when the majority of tests fail.
We’re not alone in this thinking either.
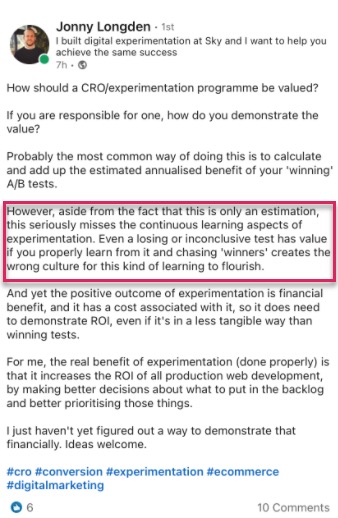
In fact, when we looked at our internal data of 28,304 tests with our tool, along with conversations with expert testing agencies, we found that most companies only find 1 winner out of every 10 tests, while agencies will usually see 1 winner out of every 4.
And I know what you’re thinking,
Surely that means I’m losing money 90% of the time with each test?
Yes, but only to half of your test audience. The other half is still seeing your site and converting as usual.
Also, the data you’re getting is helping you find out what doesn’t work, so you can learn what does. You test, learn, test again and keep going until you find what works.
And those 10% tests that do win?
They can provide an ongoing incremental lift that can be improved again and again, before being scaled out across your site on every similar page for a greater impact.
That’s the beauty of seeing a lift in conversions on a digital platform. The sheer scale of just a 1% lift can be a huge impact on your business, both now and with all future traffic. In fact, Jeff Bezos thinks along those same lines, calling Amazon and their goal for testing and improvement “the best place in the world to fail at” during their annual shareholder report:
Given a 10 percent chance of a 100 times payoff, you should take that bet every time. But you’re still going to be wrong nine times out of ten.
Jeff Bezos, Amazon
More sales and better insights are not the only benefits of A/B testing though.
Running tests allows you to move away from roadblock topics and group theory. Instead of spending months discussing possible web design changes and doing nothing, take action on it and test it, freeing up your team to focus on other things. (Just be sure to test its effect before pushing it live!)
Not only that, but you can learn something new about your audience that ONLY A/B testing can tell you.
Theory crafting and customer surveys are great but it’s what your audience actually does on your site that matters most, not just what they say. Understanding your tests helps you prove or disprove those ideas and feedback.
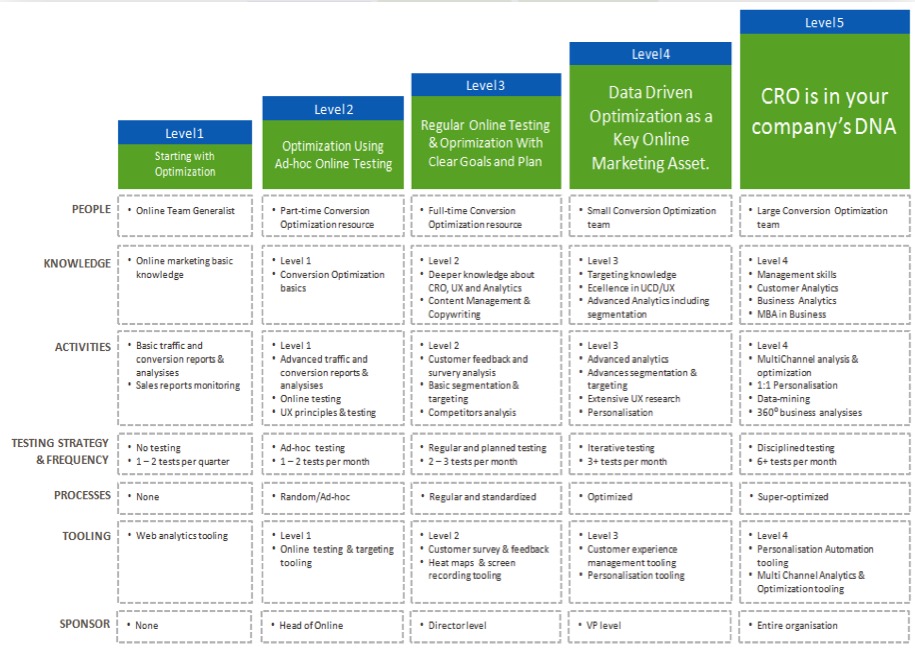
The more you understand your results, the more confident you become in your testing, allowing you to ‘mature’ your CRO efforts and run tests more often, and perhaps even start building up a testing team in-house.
Now that you see the benefit of learning from each A/B test, let’s walk you through a simple process to analyze each new test you run…
The 7-Step Process to Learn From Your A/B Tests (Along With Systems You Can Use to Improve on Future Tests)
We’ve broken this down into 7 key steps to follow.
You may not have every method or tool we recommend here, but, by seeing how they fit, you can then gauge their value and decide if you want to integrate them into your future tests.
Step #1: Check That Your Data Is Accurate, Valid + Significant
This is the most important part of this entire process. Make sure the information you have on your test is both accurate and valid so you can be confident in the results.
So how do you make sure your test results are giving you data you can trust?
Well, there are a few things you can do…
Verify Your Tool Accuracy
Now, most people miss this. Feel free to skip it if your site doesn’t get more than 10,000 visitors a month. Technically, it’s not needed to get started with CRO and works best with sites with a large traffic volume, but I would be remiss to not include it here as large sites can really see the difference.
Ideally, you’ve already run an A/A test on your current testing tool to see how accurate it is and if it has any issues.
How?
You run a simple split test with 2 identical copies of a web page and then track the results across those 2 identical pages.
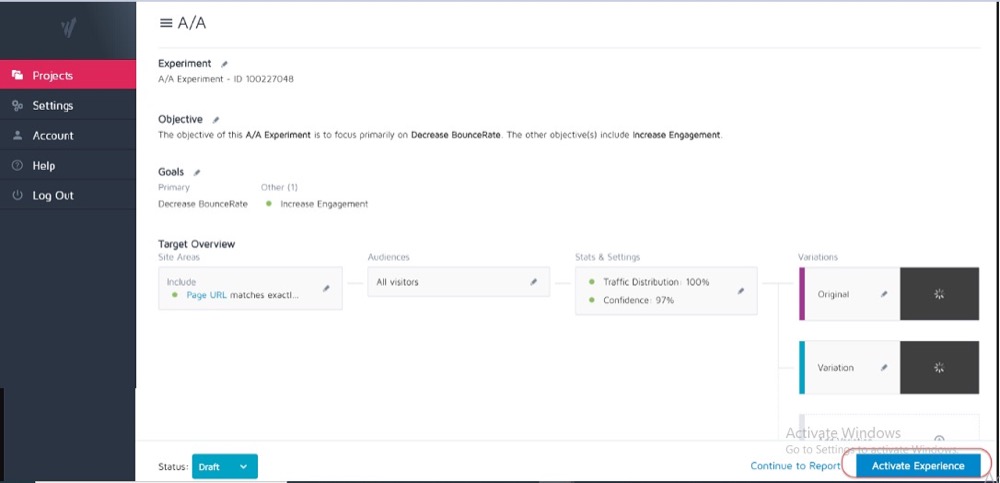
Because there are no differences between them, your results should be the same for each page. However, there may be some discrepancies caused by the tool and how it measures or tracks your data.
Knowing this in advance can help you get a tolerance for the accuracy of your testing results and use it as a guideline for all future tests.
Example
If you noticed that your A/A test showed a 0.5% difference in conversion rate between two identical pages, then you might be wary of any test results that show a winner when it’s just a 0.5% difference between the control and the variant.
You could set up internal guidelines that say a test has to show a 1% lift or higher before you believe the result. Again, you only really need to run an A/A test once when you’re trying out a new tool or if you think that your current tool may have some issues with reporting or is set up incorrectly.
A/A tests work best with large traffic sites as the sample data needed to accurately check can be quite large, but the difference in a 1% error could be huge.
Run Your Test Long Enough to Get a Valid View of How Your Customers Interact With Your Site
So now that you trust your tool, you want to run your test for 2-4 weeks, even if you get enough conversions to be statistically able to shut it off before.
Why?
Because your audience will often interact with your site differently depending on the day of the week or certain stages of the month.
Example
If people in your audience got paid on Thursdays, you would see an uptick you might miss if your test only ran from Monday to Wednesday, right?
Likewise, other users might get paid fortnightly or monthly, again skewing your results if your tests didn’t run for long enough to include them in it. You would simply assume lower sales or traffic for the times you missed.
How do you know when to end a test? Read more about A/B Testing Statistical Significance: How and When to End a Test
Be Aware of Any Internal or External Factors That Can Affect Your Results
These are unique or scheduled events that might skew your data.
For example, if your CEO or company was in the news or if you’re running any current marketing campaigns or promotions, as well as any external factors such as national holidays or even random traffic spikes.
All of this can affect your site traffic and then alter how accurate your results are during that period.
True story:
Around 6 years back, I used to own a surf clothing company.

One day, our traffic spiked by around 800% out of nowhere and our bounce rate shot up. We hadn’t run any new marketing campaigns and so I did a little investigating to find out where the traffic came from.
It turns out that one of our t-shirts had a product name that was the same name as a Korean pop band’s new song, and for 2 days we were ranking for it and getting their visitors.
Of course, this new audience was not interested at all in our product and they soon left.
Crazy, right?
Another time, my marketing blog started ranking for a TV company’s brand name and the same thing happened. We got spikes in traffic from the wrong audience.
As random as this is, these kinds of things can happen so be aware of external or internal events like this. You can always check your analytics to see where the traffic came from and then restart your test when everything goes back to normal.
Be Sure to Get Enough Data
You want to make sure that your test has enough conversions to get a valid idea of how it’s performing.
Having a control and variant with just 50 total conversions and only a small difference between them isn’t enough to get any insight into your audience — even if the test results were somehow statistically significant. Most experts agree that around 300+ conversions per variant is usually a good rule of thumb (with even more if you want to segment later on).
The larger the dataset, the easier it is to find insights in your post-test analysis.
Use our A/B testing significance calculator to get an idea of how accurate your test will be, based on a 4-week sales cycle and your current ‘control’ page’s information.
Simply set your test parameters:
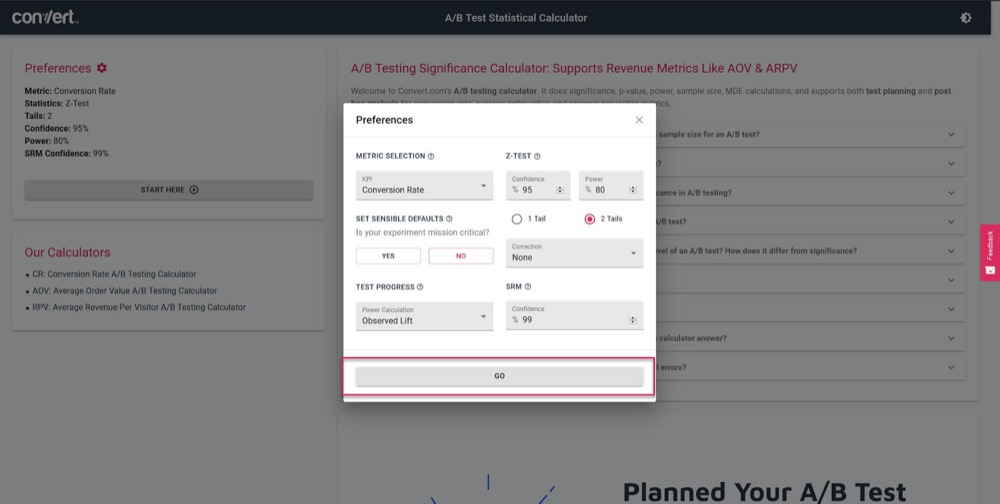
Then, feed in how much traffic your test should get per week, along with your current page’s number of conversions, and then find out the accuracy and lift % your test will be able to calculate.
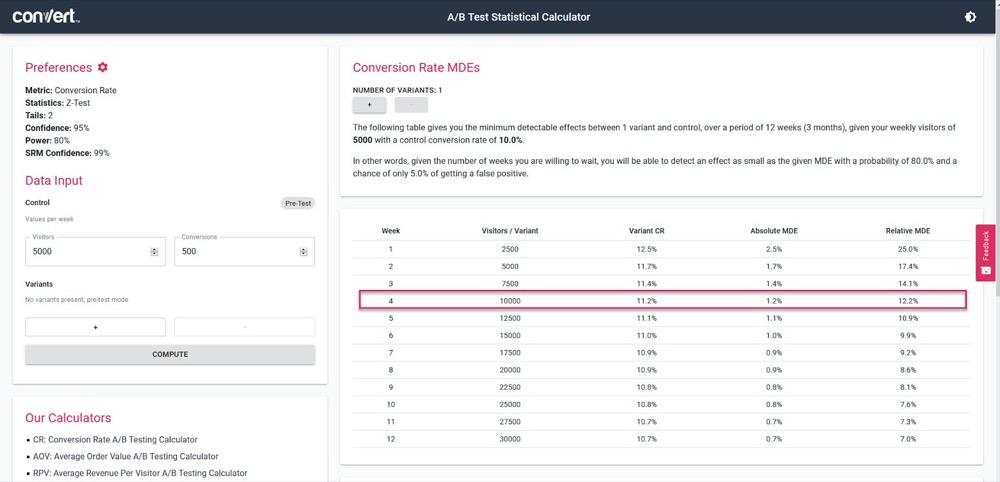
In the above example, we can measure as little as a 1.2% lift after 4 weeks. (If we want to get higher accuracy, simply run the test for longer or increase the traffic volume in the test.)
Get Statistically Significant Results
Here’s why statistical significance is important but not the most important factor when testing.
Yes, you want to make sure your test runs for long enough to see a 95-99% confidence rating in the results, but you also want to make sure every other factor we covered above is hit.
Why?
Even an A/A test can show 95% confidence in one version being better than its identical copy if it’s not run for long enough.
(It could randomly see all conversions on one version one day and none on the other.)
Too many new testers will stop a campaign once it hits ‘stat sig’ causing them to get false data. That’s why we recommend you get a statistical significance of 95% or higher, but ALSO run the test over 2-4 sales cycles, with 300+ conversions, and with a large enough sample size.
If you do all of this then you can be pretty sure that you can trust your test will give you valid and accurate results.
I can’t stress enough just how important it is to let the test run so you meet these criteria.
Calling a test too early can give you false information that can lead to either:
- Not finding a potential winner as you don’t have enough information,
- Running lower performing campaigns because you think they are winners but are actually a lower conversion rate,
- Or worse, you can get false confidence in those results and then use what you learned to scale it out to other parts of your site, thus ramping up those negative effects.
Do you know how your A/B testing tool reaches conclusions about winning variants? Click here to use our A/B Testing Significance Calculator.
Sidenote:
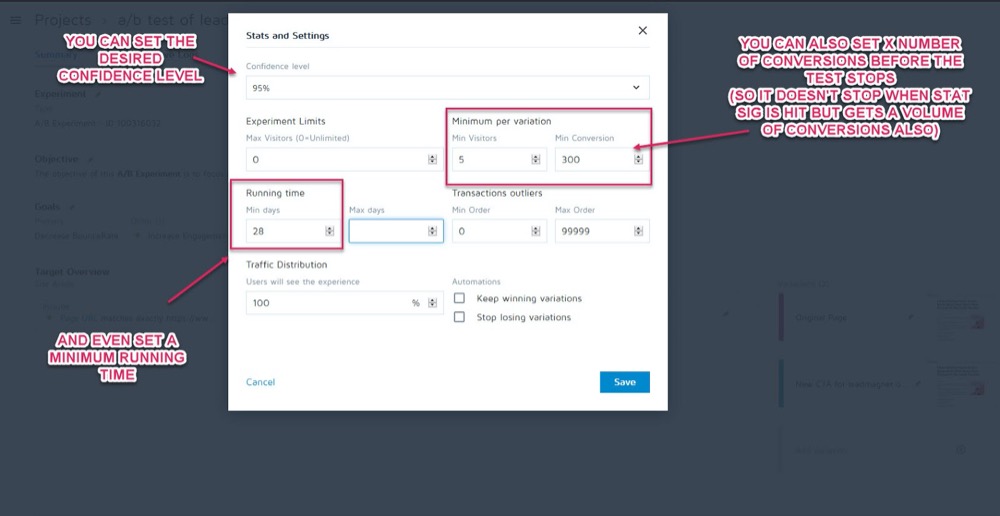
You can set these up as parameters before your test runs in the Stats & Settings section of your experiment in the Convert Experiences app.
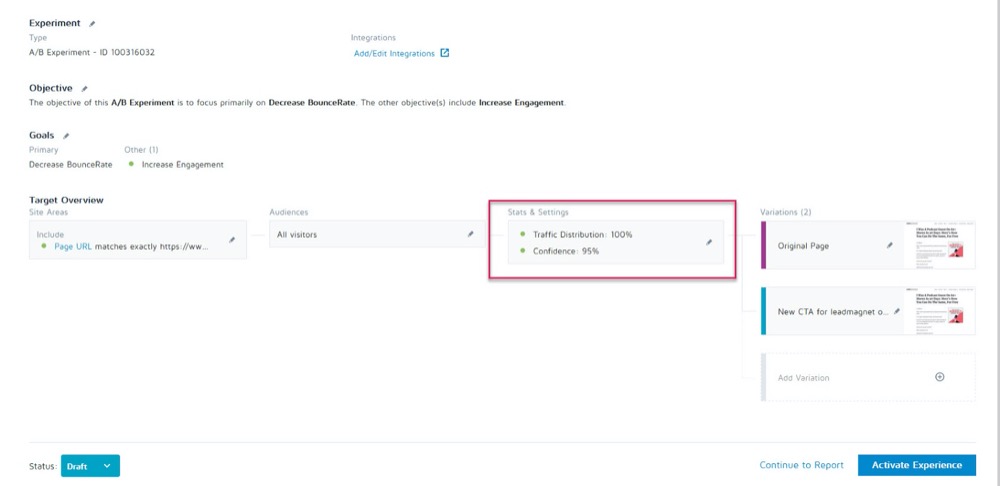
You can then set your desired confidence level, minimum run time, and number of conversions to achieve before the test can be called.
Once you’re sure your data is accurate, it’s time to analyze it…
Step #2: Check Your Micro, Macro, and Guardrail Metrics
Most people will look at a test and take the winner or loser at face value from whatever the tool tells them.
The problem of course is that the tool can only ever tell you how your test performs based on the criteria you set up for it. As CRO testers, we always want to understand the “how” and “why” that caused these results to happen so we can learn from them.
Now there are a few checks we’re going to do, but, first I’ll cover three of the most important ones. That’s where the micro and macro results tracking comes in.
Let me explain:
- Micro tracking refers to tracking the goal that you optimized your test for, which might be more clicks, signups, etc.
- Macro tracking is looking at the effect on the Northstar metric for your business, which is usually sales.
Why does this matter?
Sometimes, a lift in the micro event on your test page doesn’t affect the macro the way you might think.
Example
Let’s say that you test the CTA on a lead capture page and the loser gets fewer leads than the control.
Seems obvious which test won, right?
But on further inspection in your analytics, you notice that the leads that came through on that ‘losing’ test, actually converted far higher on the backend and created a much larger ROI.
Why would this happen?
It might be that your current page is appealing to a broader audience and it converts more leads, but your new ‘losing’ variant is actually appealing to people who are ready to buy right now.
In the example, the losing campaign would actually be the page you would want to run with as it’s converting far better with your Northstar metric.
Remember your end goal and focus your efforts on whatever affects that the most.
Micro and macro results are not all you need to look for though.
If you haven’t already, consider adding ‘Guardrail metrics’ to your campaigns.
These are core metrics you want to keep an eye on when making any other changes so that if they start to dip, you can roll back or stop certain test methods because their performance is just too important.
At Uber, we run 100s of experiments at any given time. The goal of these experiments is to continuously improve our products and the user experience. However, sometimes an experimenter might have some key metrics in mind, and may not be aware of the impact on few other metrics important to the team and the company overall, and as the experiment is run these unmonitored metrics may regress.
In order to detect and mitigate such scenarios, we have built out our experimentation monitoring platform. The goal is to identify and monitor a few guardrail metrics that we do not want to degrade during the experiment runs. We apply a variation of the sequential A/B methodology to continuously monitor these guardrail metrics and detect any regression between the treatment and the control group of an experiment. If regression is detected, we send alerts to the owner of the experiment.
Suman Bhattacharya, Senior Data Scientist, Uber
Example
Let’s say you want to collect more leads using full-screen pop-ups.

For some sites, these work great, but not always. (Which is why we test!)
Perhaps you installed a full-screen pop-up and started getting more leads on that page, but your welcome emails to those new subscribers are bouncing and not delivering.
It turns out people were opting in with fake emails just to get the pop-ups to stop showing.
You don’t want fake leads on your email list as they can lower your email delivery results to actual subscribers. Nor should you want to lower the user experience so much that your audience feels they need to fake their email.
Because email marketing is a core part of your sales process, you decide to set up an alert to let you know if the email bounce rate goes up past a set point while running A/B tests on your lead capture page.
This would be your guardrail metric. In this example, you can see it’s broken and you decide to use less intrusive lead capture methods.
Does that make sense?
Guardrail metrics are not just lead capture and bounce rate though. They are key metrics that you don’t want to see a dip in that affects user experience.
To prevent a degradation of the user experience while ensuring you’re also improving the metrics that matter, define a few guardrail metrics that, if they were to drop by a certain threshold, it would prevent you from moving forward with rolling out the supposed “winning” variant. This also helps end the debate between conversion optimization and UX or brand guidelines.
Alex Birkett, Omniscient Digital
It’s up to you to decide what those metrics are for your business. Use them to see if you have an actual winner, or if you’re simply trading in one result’s lift for a loss in a more important area.
If you need some inspiration, check out Ben Labay’s list of common guardrail metrics in experimentation and testing:
Then, make those changes accordingly.
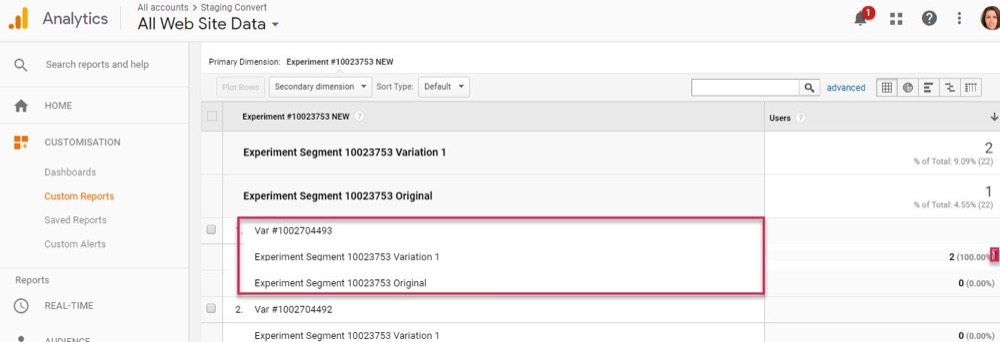
As long as you have the Convert Experiences app set up with your analytics and advanced segments, you should be able to find this information out with a quick look around. Check each variation’s effect on your Northstar metric, as well as your ‘guardrails’ so you don’t just pick the testing tool’s winner.
Now that you have your core metrics covered, let’s look a little deeper into your results…
Step #3: Go Deeper and Segment Your Results
Remember that when it comes to testing, the average is a lie.
The average result can only ever give you broad information based on a combination of multiple data points. It’s up to you to understand why that result occurred and then look deeper because it’s not always what it seems.
We’ve already seen this with macro results being affected by micro-test changes, but your analytics segments can give even deeper insights.
Example
Let’s say you’re running a test for more leads. At first glance, the control and the variant have the same conversion rate of visitors to subscribers.
However, on deeper inspection, you notice that on desktop, the new variation is almost double the conversion rate of the control, but on mobile it’s zero, causing the average of the page to seem identical to the control.
Clearly, something is wrong, but why would this happen?
It could be that the new variant just doesn’t load correctly on mobile, or perhaps the form doesn’t work on specific devices so no mobile users who wanted to subscribe actually could. And if you fixed this issue, it could be that your ‘equal result’ variant is actually able to far outperform the control.
You can only ever find these things when you work to get more information behind your results.
With each test, you’ll experiment your way into insights, which will inform smarter segmentation, which will lead to new insights, which will eventually lead you to a more meaningful strategy.
Shanelle Mullins, Shopify
Segmentation is not just about finding errors but also finding other user insights.
Maybe the page and the control are all working ok, but when you look deeper, you notice that certain traffic channels are converting far higher on this new test than others?
Often you’ll have some segments underperforming and others overperforming. This can then inform new personalization campaigns or paid or organic traffic strategies.
Perhaps the control converts best on desktop, but the new variant converts higher on mobile. Say, for example, you want to pick which version shows based on how the viewer is seeing your site.
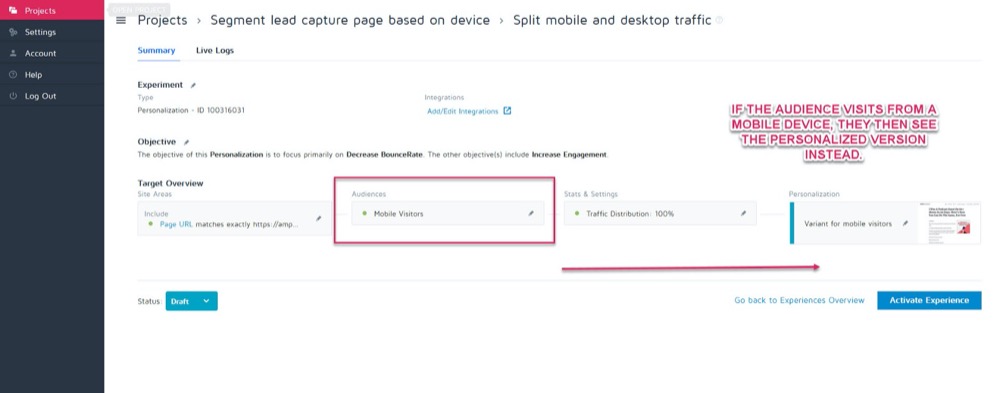
Using Convert’s personalization feature, you could set up that mobile winning variation as a personalization for just that audience.
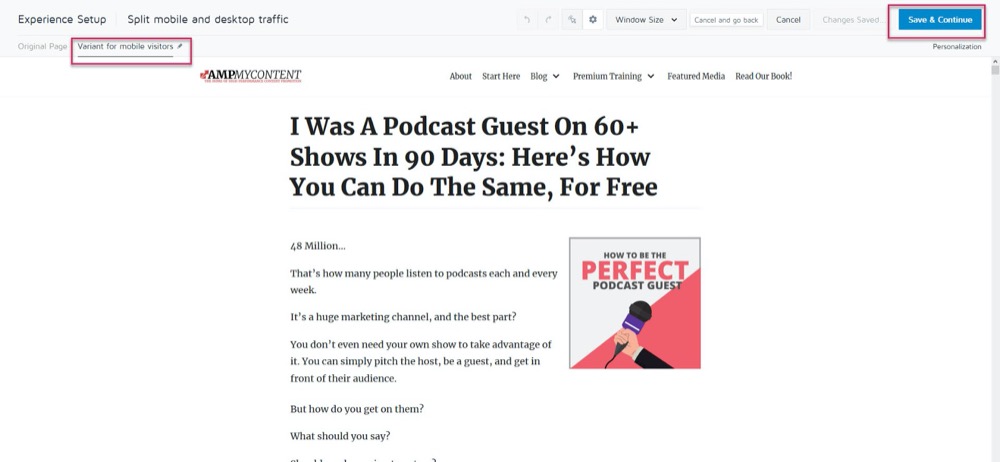
Then, you can show the new version when the visitor is coming from any mobile device.
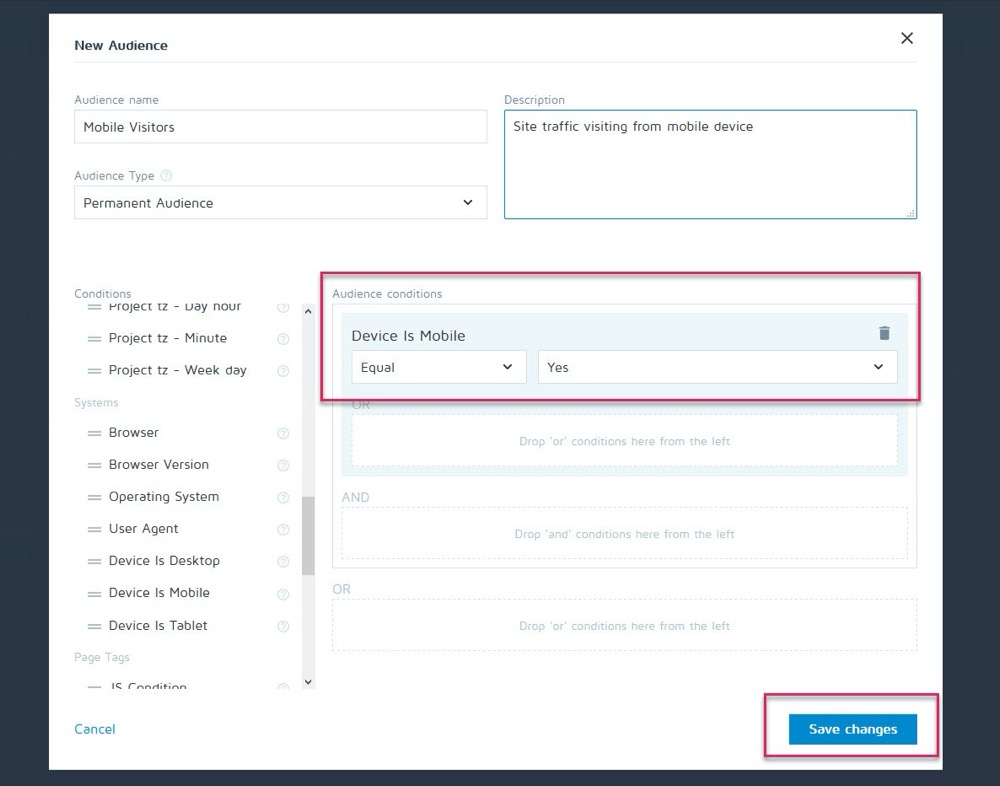
But if they come across from a desktop, they would see the desktop version instead.
There is a whole heap of different personalization methods that you can use, but only once you get some insights from your campaigns.
The key to analyzing segments is to always look into your results to learn WHY something happened.
Look at:
- New Vs Returning audience. Is one variation bringing people back more often? Is one converting more cold/new audience members?
- Traffic Source. Is one channel doing better than others? Could you focus more here?
- Page Views. Especially if your test page is trying to drive traffic to your sales page. A lack of clicks on one version could mean that you have a broken button or CTA issue.
- Bounce rate. This can indicate a broken link/slow load/bad UX experience, or even targeting the wrong audience.
- Operating System,
- Mobile Vs Desktop.
- Device used.
A slight disclaimer:
To get an accurate reflection of each channel when segmenting like this, you need a LOT of data. A good rule of thumb is to have a test with around 10x the volume of conversions as you might normally run (or 300 conversions per channel, not just per variant page).
You might be thinking, “There’s no way we get enough traffic to run a test like this”. Or if you do, it could take months for it to happen.
Even if that’s the case, don’t just skip over looking at your segment analysis.
Why?
Even though you might not have enough conversions across each segment to draw data-backed conclusions, it can give you some glaring insights if you start seeing issues such as page views with zero clicks, or an immediate bounce rate.
These are all things that could indicate a broken test and help you find a potentially missed winner. Go ahead and look for any major drop-offs and issues. Was everything working on each platform and device?
Ideally, you checked them all before the test, but things can break mid-test so check again.
I’ve personally had WordPress update itself automatically mid-campaign which then caused lead capture forms to suddenly stop working during the middle of a test. Always be checking in, and if you do see something that is ruining the accuracy of your results, stop the test, repair the issue and then run again.
And if everything was working ok?
Let’s have a look and find out WHY people didn’t take your action…
Step #4: Check User Behavior for Further Insights
Ideally, you should have qualitative tracking in place on top of your testing tool.
Why?
Because this can often give you insights into your variant you would miss with just regular testing.
Remember:
Quantitative testing tools such as Convert tell you what happened. We can give you the raw numerical data between how many people clicked or didn’t click and help you to set up each A/B test.
But adding qualitative tools helps you understand WHY an action happened. They allow you to see what the user was doing and get some more insight into their actions.
(Tests will usually fail due to either poor execution or audience understanding and it’s only through seeing what went wrong that we can resolve it.)
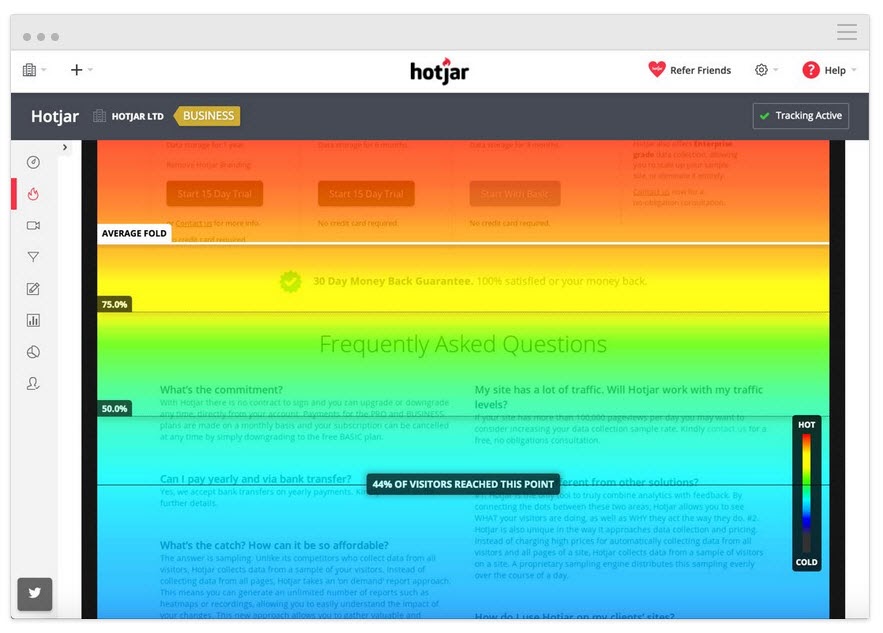
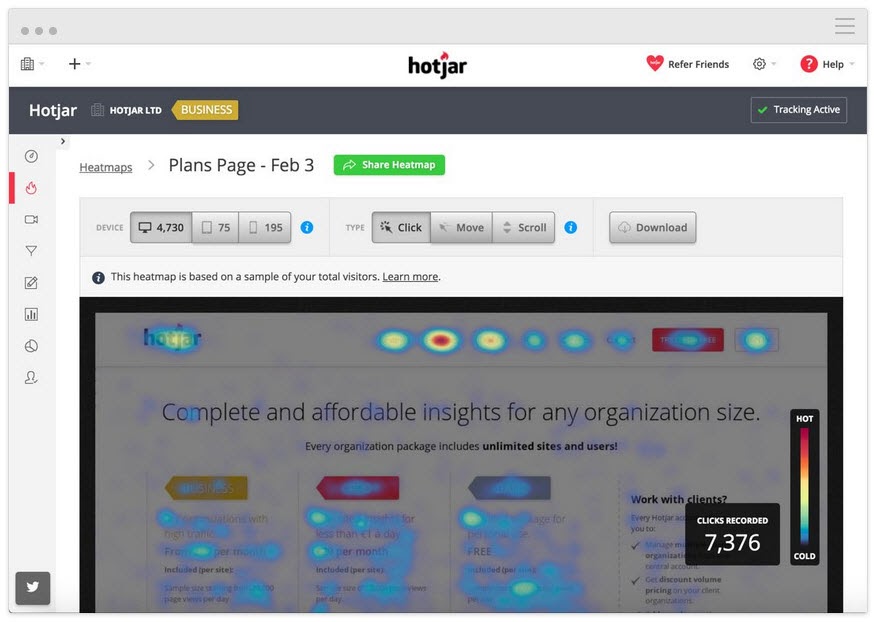
Using a tool like Hotjar, you can run a number of qualitative tests and even pull the data right into your Convert dashboard with our built-in integration.
To get deeper insights, set up the Hotjar – Convert integration and try the tactics below.
Track How Far Down the User Reads
Add a heatmap tool to your page to see if your audience gets as far as your CTA. If not, you can run your test again and move the CTA higher up the page.
Track What Users Click On, But Shouldn’t
Do they click on strategic CTAs or is it random text they think might be a link instead?
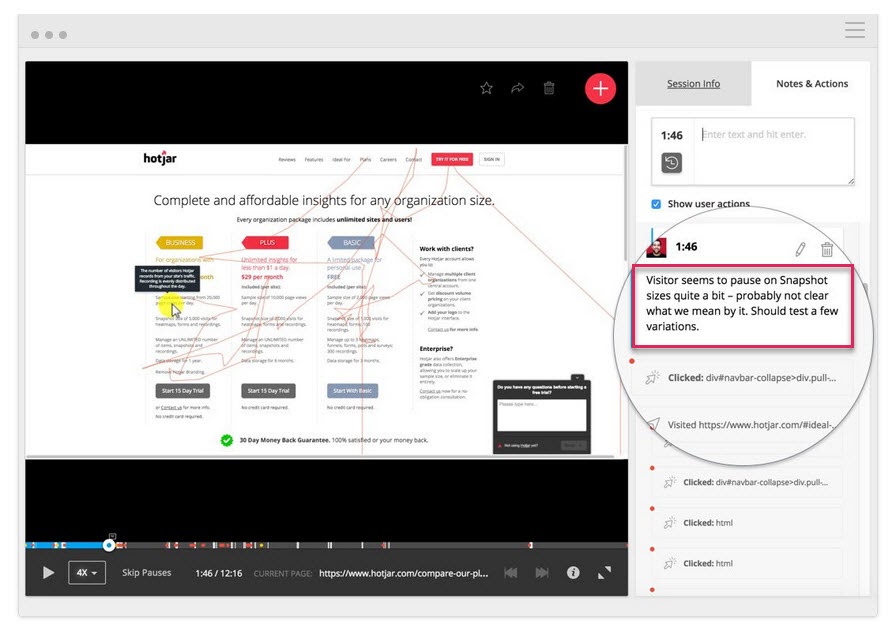
Watch Screen Recordings to See What They Don’t Click On, But Should
Are they not clicking on your CTA button even though they scroll far enough to see it? Are they clicking but it’s not opening? Do they see it but not realize it’s a button to be clicked on?
You can watch all this and even add notes when these things pop out.
It’s not just heat mapping and click-tracking tools that can help.
Run Surveys to Your Audience
Surveys help you not only get feedback on what caused your audience to take action (or stopped them) but also give you the language it uses to describe this.
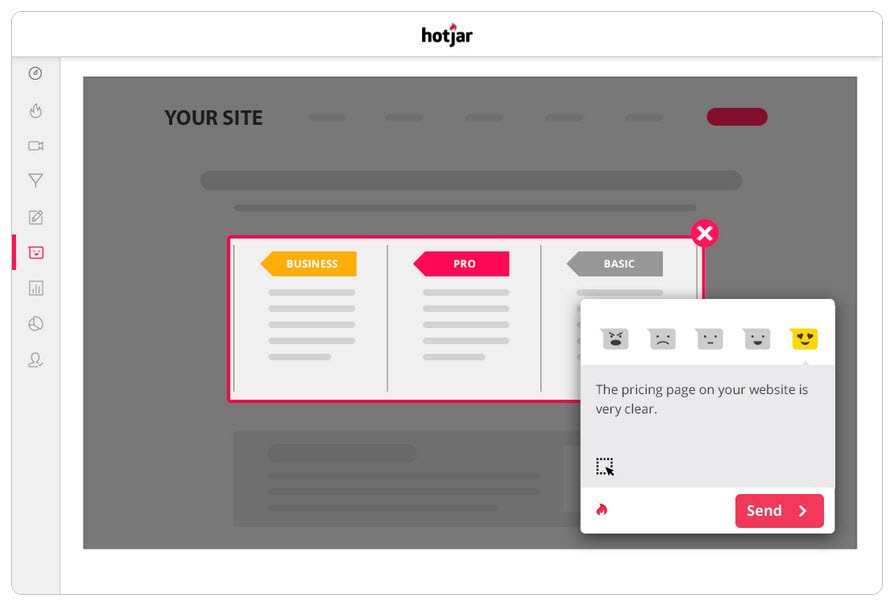
In copywriting, we call this ‘mirror language’ and it’s incredibly effective at connecting with the user. It feels like you not only recognize their problem but understand it better than anyone else, as you describe it in the same words they use.
Two great ways to use surveys alongside your A/B testing tool are:
- Exit intent polls. Identify those who don’t take the new version, so you can find out what stopped them.
Is there a reason you didn’t optin/purchase today?
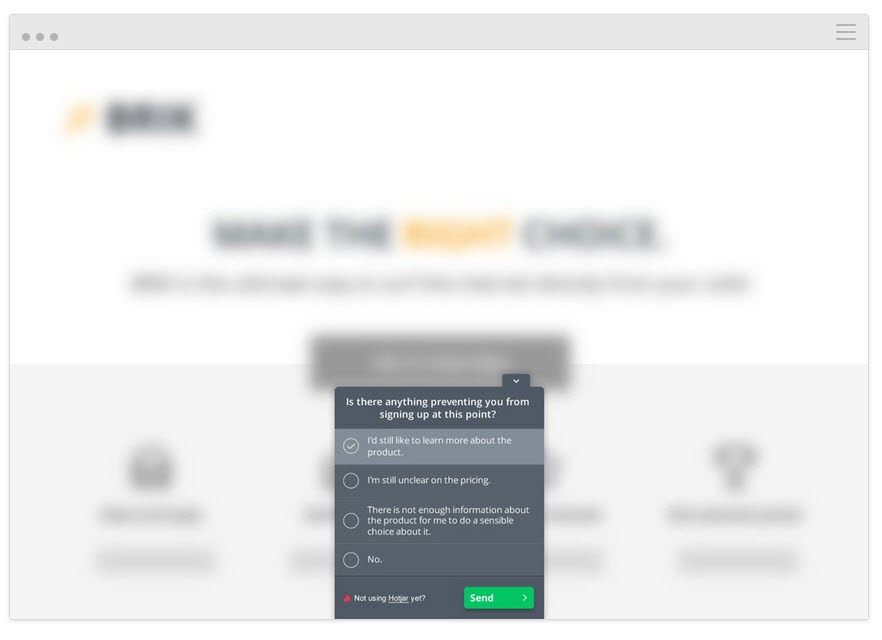
- Post-purchase/conversion polls. Find those who do take the variant and see if there were any sticking points and motivating factors.
What made you decide to take action today?” Was there anything that almost stopped you from deciding?
You can even run similar surveys on the control if you want more information. All of this will help you understand how the test performed so you can iterate and improve.
Speaking of which…
Step #5: Learn from Losing Tests
The most important thing when it comes to getting a losing test is to learn something from the result. There is no such thing as a bad test as long as you can take insights from it to improve or understand your audience better.
A/B testing is an interactive process. We fail forward while gaining understanding. You can often learn far more from taking a losing test to a winner than just getting a winner outright.
So far we’ve been doing 3 things:
- Making sure the test data is accurate,
- Looking at the raw results for any issues, and
- Trying to understand our users and their actions.
This step is more of a heuristic approach to help you understand the common issues that can cause a failure (assuming the test data is accurate and the CTA buttons all work) and analyze your approach and hypothesis.
Was Your Hypothesis Wrong or Was Your Test Misaligned?
This is a common issue, especially among new testers.
Did you run your test off of some ‘woo woo’ metrics or ideas that were not aligned with an actual KPI?
Example
Let’s say you want more sales from a page, but for some reason, you decided to test tweaks to your social share buttons instead. (Even though you have zero data to show that more social shares affect your sales.)
It sounds crazy but you’ll be surprised how often something like this happens.
Ask yourself:
Did my test goal align with a core KPI and in a way that can affect it?
If it didn’t, then that’s ok, but make sure the next test aligns better.
We fail, we learn, we try again.
With your next test, be sure to focus on your core KPI metrics and how you can affect them, and also give the test a clear win/fail scenario.
We want this page to get more leads, so we’re testing the thing that gets them to opt-in, which means we want to create a better CTA.
or
We want this page to get more leads, and we’ve found that users don’t scroll as far as our CTA so we’re testing raising it up the page.
Having your test align with your goal will get you on the right path but even then, it still might not see more conversions…
The Hypothesis Was Correct and the Test Was Aligned, But There Was Still No Change in Results
This can happen 90% of the time and it’s why most tests fail.
Example #1
Your user data shows users don’t trust your site enough. You added trust factors like social proof, user testimonials, SSL certificates, but conversions still haven’t increased.
Does that mean you should stop and try a new test or angle?
Not at all…
Your initial hypothesis may have been right, but your test just needs to be improved on or executed better before you can see any effect.
You could try adding more trust factors or even move around the ones you have so they stand out more. Perhaps re-word the language used in them to help them connect with your audience better.
All of these things still align with the initial hypothesis, you just need to test more versions to find the winner.
Example #2
CXL ran 6 different test campaigns on this landing page to get more leads for truck driver certifications.

They raised the opt-in rate from 12.1% to 79.3% all from continuing to improve the page.
(Almost all of those test campaigns took multiple tries using the same hypothesis before they saw a lift. Only then, they moved on and tested to improve the other elements on the page.)
A/B testing is an iterative process. You have to keep testing and tweaking to find improvements, and even the best in the business may only find a winner 10% of the time.
If hypothetically you were an organization and every test you ran was a success, then that would actually be a red flag in my opinion.
It sounds counterintuitive but it shows to me that you are only testing obvious things and not enough risk is being taken to really move the needle.
Deborah O’Malley, Guess The Test
It’s always great to learn from the best and we’re excited to share the interview we did with Deborah. We talked about why tests are never a failure and the importance of having the right mentality in testing. To help you get started on the right foot, listen to our interview here.
That means you might need 9 tests before you see a positive lift so stick at it.
Your tests should be following a priority system of most impact to lowest. By running more tests and changes to improve your current campaign, you’ll see far more impact than jumping to a lower importance test because you’re not seeing immediate results with your current one.
And if it still doesn’t see a lift with smaller changes, consider running an innovative test where you run a different design.
It can be a swing for the fence but sometimes it can be the change you need to make.
What if After All of These Tests and Tweaks, the Variant Is Still a Loser?
So the data is correct and you’ve tried every tweak and even done large innovative changes to the whole page and it still won’t perform better than the control.
It might not seem it, but this is actually a GOOD THING.
Why?
Because you’ve found out what doesn’t work with your audience!
So many websites make huge sweeping changes without testing anything and just roll it out regardless.
Ask yourself this:
If that page variant converts at just 1% worse than your current control, just how much money have you saved by testing this first and not rolling it out?
Back in 2014, Marks and Spencer decided to update their entire website without testing it with a sample audience first.
The result?
Their online sales dropped by 8.1% in 3 months, causing a loss of $55 million.
This is why testing and finding losers is a really good thing because even losing tests can save you money.
What if the Test and the Variant Have Identical Results?
You checked everything, it all works, you’ve segmented down and gone into the nitty-gritty, but there’s just no discernible difference between your current page and your new variant.
You’ve even tried complete page overhauls but through some fluke of math, your new page still converts at the same rate as the old one.
In this case, it’s simply the dealer’s choice.
Does the new variation more actively represent your brand and style?
If so, choose whichever you wish to use. The results are still the same but you are happier with the design.
Note: This should be the only time that you do this. Branding should not sacrifice results; it should aid them, as seen in the previous example.
Step #6: Double Down on Winners and Continue to Improve Them
So far we’ve been covering losing campaigns, but what if you got a winner right out of the gate?
First off, congratulations!
Second, let’s make sure you actually have a winner. Oftentimes, things can happen to affect your results and give you a false positive (i.e. we think it’s a winner but we implement it and nothing happens.)
Go ahead and run the test again with just your control and the winning variant and prove the lift in results first before you make any changes to your site.
Then if it really is a winner? Don’t stop there, continue to improve it!
Iterative improvements of a new winning campaign are the easiest new test to run. With each new improvement, you’ll see more ongoing ROI. You can even take what you learned with your winning test and then roll it out across similar pages on your site for further tests and see if it also adds lift there too.

Step #7: Create a Learning Repository for Future Tests
This step is relevant to both winning and losing tests.
Not only will it help you with future tests, but it will also help your QA team diagnose any broken campaigns faster, as they can see where issues have appeared in the past.
Better still?
It will help you document your results for clients or your boss, while also standardizing your reporting processes and ramping up your test velocity.
Here’s how it works:
You’re going to create a master archive or learning repository of all past tests. A place to document your previous wins and losses that you can use to both reference for new campaigns and share with stakeholders or customers.
You can use a folder on your computer for this, but, if you really want to get organized, there’s a great tool called GrowthHackers experiments.

Its main goal is to help marketing growth teams communicate and organize campaigns, but you can easily use it to manage your CRO testing and learnings. It will even pull in results from your test tool and allows you to archive each test. (You can simply tag and then add them to the repository.)
Whatever you decide to use, here are some best practices:
Organizing Your Tests
You probably have your own naming conventions but if you’re just starting, I recommend naming each test like so:
“Goal – Campaign – Test Date”
For example:
“CTR lift test – XYZ client – March 1st-14th 2021”
This way, you can organize tests by goals to get inspiration for future tests, search through and find them for client campaigns, or look back on your experiments month by month.
Then, if you wanted to run a CTR test later on, you can swipe through them and see what ideas worked or failed in the past.
How Do We Create Documents for the Learning Repository?
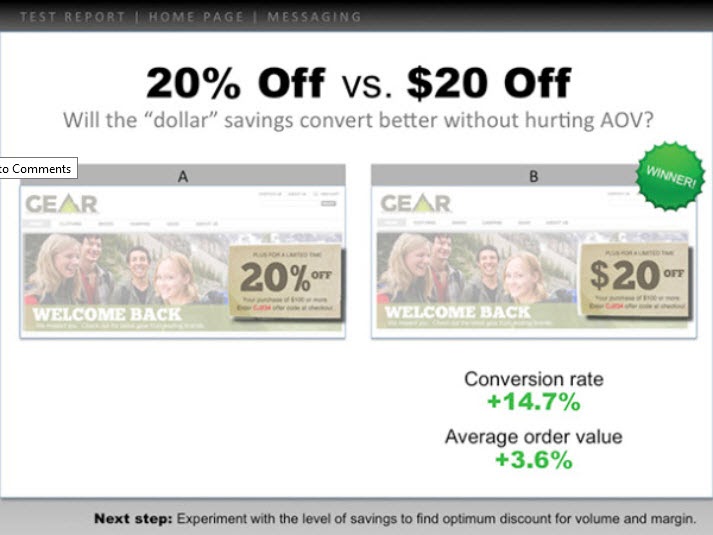
Feel free to add screenshots of your testing tools graphs, confidence, and power level or any data that you think is relevant.
However, I highly recommend creating a slide with the following information:
- The hypothesis and how you came up with the idea (any survey data or information).
- A headline with the test goal.
- A screenshot of the control, the winning variant, and any other failed versions/tests that got some lift but not as much. (Highlight the key elements so you can spot what changed without having to look too hard.)
- Add the micro goal and its percentage lift. (Perhaps 3.2% CTR)
- Then add the macro goal and its percentage lift. (AVG order value up 2.2%, etc.)
Here’s an example:
You can use these slides to present the test information to anyone else who needs them, while also having a simple file to understand the test at a moment’s notice.
Pretty handy, right?
Now that you’ve analyzed your test and recorded the results, let’s walk you through how to present this to your boss in a way that even if the test failed, they’re still happy to see your findings…
How To Present This Information To Your Boss (Even When Your Campaigns Failed)
Don’t worry if you feel anxious about this, you’re not alone. In fact, according to CXL’s state of the industry report, presenting test information or getting buy-in from your stakeholders is consistently one of the biggest struggles CROs face.
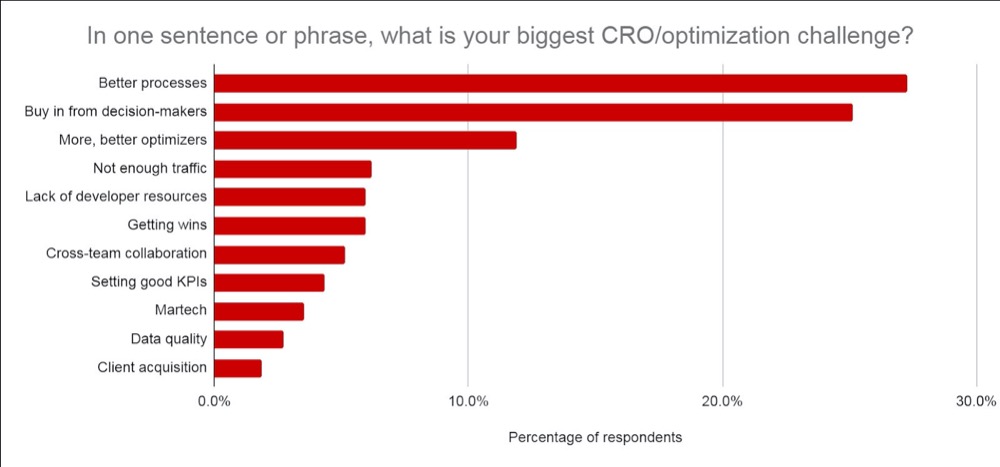
We’ve covered the best ways to communicate this information before, but I want to give you a few extra tips on how to get your test results across (even if your test failed).
Tip #1: Get Everyone On Board With CRO and Its Realities as Soon as Possible
Ideally, you covered this when you first broached the topic of running A/B tests but it never hurts to recap.
Make sure they understand that A/B testing is a continual learning process that’s more about understanding your audience and improving their experience. The lift in ROI is simply a byproduct of taking action on each test and implementing what you learn, regardless of if it wins or fails.
Winners give lift and losers give insight into where to improve.
No test is ever wasted but the majority of them do fail. You’re looking at roughly 1/10 winners for most people’s tests and agencies are around ¼.
Be clear on how many tests fail and the need to run more tests to find winners.
Tip #2: Present the Information as Simply as You Can
Not everyone can read graphs easily. Even if they can, it still means that it takes effort to understand the context of what they are seeing.
The more effort it takes to understand something, the more frustrating it can be and can cause you to lose the other person’s attention.
(Top tip for landing pages btw ^^)
Break it down nice and simple by using the slides from your learning repository.
It should already include:
- What you learned beforehand and how you came to the test idea.
- What you tested. Show the control, the variations, and the winner.
- How it worked out on a micro and macro level. Include the results.
Finally, add any insights you drew from tests to decide on your next important action to take. (Improve execution, test new variations, new hypothesis, etc.)
Providing insight into what happened is HUGE.
Your boss cares more about what you learned than the results, as that can be acted on. Sharing that and giving ideas for what to do next will help them see that you are in control of the situation and help them feel confident about further tests.
Tip #3: Make Them Look Good
Take it a step further and add data they care about:
- If the test failed, then give insights into why you think it failed. Add the ROI saved by not rolling out the failed test and how it would affect MRR and ARR.
- If it won, then give insights into the ROI made and how this affects year over year revenue / MRR and ARR, along with any opportunity to scale it further and get more lift in ROI. (i.e. You might have tested a lead capture page and saw a lift when tweaking the layout. You might have 30 other similar pages you could apply this test to that could see a potential lift.)
- If the test was flat, then share insights on what you think happened and what to do next. (Better execution, a new variant, a total change, or a better-aligned test, etc.)
Sure, the ARR + MRR, or YOY impact is a rough estimate, but it shows the potential impact and value of your testing. That’s what your boss cares about and what they are possibly thinking about when they see your results.
Trust me, when you present your information like this, you’ll notice it goes across far easier. You go from framing the test as ‘money lost’ or a waste of time to instead focusing on potential savings, actual earnings, and potential further growth.
Not only that, but you’ll also be able to prove the value of running even more tests, maturing your CRO efforts, and ramping up your test velocity.
Conclusion
There you have it.
By now, you should feel far more confident about how to analyze and learn from your A/B test results and be able to present this information to your boss or anyone else, regardless of how your tests performed.
Simply follow this guide to streamline the post-test analysis of each new A/B test you run!

