A Primer on Statistical Significance in A/B Testing (And The Biggest Misconceptions Around It)

Is your A/B test taking too long to hit 95% statistical significance?
Understanding stat sig (as the term is fondly called) and how the metric works can ease your pain.
Right now, you’re probably losing patience and wondering
Do I even need to hit 95? There’s a clear winner in front of me, and time is running out. Can’t we just move on already?
But you don’t have to feel this way.
If you can relate to the “I must hit 95% before I trust my result” experience, you’re currently being held down by one or more misconceptions about stat sig.
For your A/B test to give you the real answers you’re looking for, you’re going to need to flex some stats muscles.
But that doesn’t mean you have to become a statistical genius, you just need to understand how these concepts apply to your focus: randomized controlled experiments for digital assets.
That’s what this article is all about—everything you need to know to understand the reality of statistical significance in A/B testing, how to get the true story from your results (even when they don’t hit 95% stat sig), and ultimately, how to shake off the misconceptions that want to rain on your A/B parade.
- What Is Statistical Significance?
- Statistical Significance Made Easy
- Misconceptions Around Statistical Significance
- Statistical Significance Calculators Statisticians Use
- Conclusion
Let’s start by defining statistical significance.
What Is Statistical Significance?
Short answer: Statistical significance tells you if you can trust the observed results or not.
Long answer: Statistical significance measures the certainty of a result obtained from an experiment. The higher its value, the more you can trust that the result is not due to randomness, and that it was caused by the changes you did in your experiment.
When analyzing A/B testing results, a strong statistical significance means the changes you’re testing are more likely to have had an effect on the outcome observed.
On the other hand, a weak statistical significance means the changes you’re testing are less likely to have had an effect on the outcome, and the change in outcome likely came by chance or luck. More often than not, it is safe to assume statistical significance values below 95% as meaningless.
If in your test, B beat A and the result showed a weak stat sig, rerunning the test may show a different result.
Measuring statistical significance is a way for you to be as certain–or confident–about your outcomes as possible (more on this later).
This is important because you want to be sure that the changes you implement will continue to show effects in the same direction as observed during the experiments after it is done.
Your stat sig can be set at any benchmark. Some people choose a statistical significance of 95%, while some go with 99%. Your choice of benchmark depends on the context of your test and the amount of risk you’re willing to take with the certainty of your results.
Let’s look at an example of a statistical significance metric in action by first calculating the value.
How to Calculate Statistical Significance?
You can use simple calculator tools to help you calculate the ideal sample size to wait for in your experiment before making a decision, based on statistical significance.
But if you’d like a stronger grasp on the concept, let’s nerd out and see how it’s done (in one scenario).

In summary, these are the steps:
- Create your null and alternate hypothesis
- Choose your type of test
- Determine your alpha value
- Determine the sample size
- Calculate the required values (i.e. standard deviation, standard error, etc.)
- Use a t-table to find your statistical significance
Let’s go…
Step 1: Create your null and alternate hypothesis
For your first step in calculating statistical significance, take a skeptical stance and state that the change has no effect on the result. This is your null hypothesis, Ho.
Its contender, the alternate hypothesis, Ha, assumes the change influenced the result. You don’t need to believe either of these, they’re just necessary for an unbiased test.
Step 2: Choose your test
There are two types of tests: z-tests and t-tests. You use z-test when you know the standard deviation and t-test when it’s unknown.
Under each option, you have two kinds each:
- One-tailed z-test or two-tailed z-test, and
- One-tailed t-test or two-tailed t-test
What’s the difference between one- and two-tailed tests? One-tailed tests explore the possibility of there being a relationship between the change and effect in one direction (positive or negative).
While two-tailed tests explore that possibility in both directions (positive and negative).
To illustrate, you want to know if ‘B’ beats ‘A’ in a one-tailed test. In a two-tailed test, you also want to know if ‘B’ performs worse than ‘A’.
You need two-tailed tests in A/B testing. Convert Experiences uses two-tailed Z-tests.
For this explanation of the manual stat sig calculation process, we’ll work with a two-tailed t-test. You’ll get a wide-enough view of how it is calculated for continuous metrics like revenue.
Next…
Step 3: Determine your alpha value
Alpha, ɑ, is the significance level. This is the threshold value below which you’ll reject your first (null) hypothesis. This is usually 5%, or 0.05.
The confidence level is 1 – ɑ, in %. In this case, 0.95, which is 95%.
Alpha can be as low as 0.01 where you absolutely need to be confident in your results. In the pharmaceutical industry or in life-dependent engineering design, like parachutes, you’ll want to be as absolutely confident as possible.
Note: For a two-tailed test, ɑ is divided by 2. For example, 0.05/2 to give 0.025.
Step 4: Determine the sample size
To determine the sample size, you need to perform a power analysis. A power analysis takes into account the effect size, sample size, significance level, and statistical power.
The statistical power, β, shows us how likely we are to declare the alternative hypothesis as true over the null hypothesis. This is usually set at 80% and is what tells you what sample size you need in order to achieve statistical significance.
The calculation for determining the ideal sample size is complex, so better you use a sample size calculator for this step.
Step 5: Calculate the required values
These values are:
- Standard deviation — Measures how spread out the data you collected during the test is from the average
- Standard error — Shows how accurate your sample distribution is
- T-score — The magnitude to which your data groups are different from each other
- Degrees of freedom — The formula is: (Number of samples in Group A + Number of samples in Group B) – 2
You’ll need these to read the t-table in the next step.
Step 6: Use a t-table to find your statistical significance
The t-table will show you the p-value for your data given the degrees of freedom and other values you’ve calculated in previous steps.
One way of determining statistical significance is whether or not your p-value is below the value for your alpha.
If your p-value falls below your alpha, 0.05, you can reject the null hypothesis and say the change had an effect on the result you observed.
If your p-value falls above your alpha, your experiment does not achieve statistical significance. So, you cannot say for sure that the change influenced the outcome.
In this case, you likely need more data from a larger sample size.
TL;DR: Using a statistical significance calculator is much simpler than manually doing the calculations. We dive deeper into these calculators further down in this article.
What Is the Significance of Statistical Significance in A/B Testing?
In A/B testing, we want to be sure the outcome we’ve observed is caused by the change we’re testing.
We don’t want to end up in a situation where we wrongly invest and publish a change live that we expect to consistently produce more conversion just for that change to not deliver.
We want certainty.
If an outcome is sustained over time, we can have a certain level of confidence that it isn’t due to pure chance.
And that’s what statistical significance tells us about our result: If you wait long enough for your test to gather enough data to consistently prove the null hypothesis is false, then you have statistical significance.
This “enough data” is determined by the minimum detectable lift (MDE) and calculated sample size for the test, which you can get from a calculator. More on MDE below.
In research, statistical significance is used to guarantee the reproducibility of a finding. The degree of guarantee may be stringent, anywhere from 99% to 99.99%.
In other fields or contexts, the degree may be more relaxed at just 90%.
In conversion rate optimization, the convention is to use 95%. This is the stat sig you’ll find in most A/B testing tools.
But is hitting 95% statistical significance always necessary when running A/B tests? Some tests just won’t hit that degree for one reason or the other.
In an analysis of 28,304 experiments, research findings show that only 20% of experiments reach a 95% statistical significance level.
Does that mean that the remaining tests are a waste? No, you can still extract insights from tests that don’t hit the significance benchmark. But how?
Justin Christianson, Founder of Conversion Fanatics, shares suggestions in the video below, such as increasing your sample size by driving more traffic to the page and running your tests on the high leverage pages on your site.
Statistical Significance Doesn’t Stand Alone. What Other Concepts Do You Need to Know?
Some words and phrases we’ve used up to this point may not have made sense to you. So, this is where we’re going to dive into the definitions of each of these statistics terms related to statistical significance.
Null Hypothesis
A null hypothesis is the version of your hypothesis that says that there is no real change.
If you’ve observed any change in your data, such as an uplift, and the null hypothesis is found to be true, it would mean that the change was just random variations in values and noise.
For example, if you test changing the CTA button color on your landing page from blue (original) to green (challenger) and observe an 11% growth in conversion, your null hypothesis will be that there is no real lift.
At the end of your experiment, there are 4 actions you can choose to have in relation to your null hypothesis:
- Reject the null hypothesis
- Fail to reject the null hypothesis
- Falsely reject the null hypothesis
- Falsely fail to reject the null hypothesis
1 and 2 are the actions you want to take. Rejecting the null hypothesis means you learned from the test that the green button color did actually have an influence on the boost in conversion rate. Failing to reject the null hypothesis means you weren’t able to prove that the green button had an influence on the conversion rate boost.
3 and 4 are errors. You don’t want to “falsely” do anything in online experimentation.
One way to avoid making these errors is by choosing the appropriate p-value for the specific test scenario.
P-Value
Let’s assume your null hypothesis (the skeptic that isn’t ready to believe the results you’ve observed) is true, the p-value represents the probability of observing an outcome that is as extreme or more extreme than what you observed.
Meaning if it is extremely small, that event has a very small probability of having taken place, meaning this reality that we are considering with the null hypothesis, can be rejected, and the change is indeed real.
Power of a Test
The power of a test is the probability that an effect will be detected when there is one. This value is usually set at 80%.
The higher the power, the more likely you are to avoid making a Type II error (a false negative, failure to detect a real change when there is one).
False Negative
Remember the erroneous actions 3 and 4 you can take with a null hypothesis? False negatives are number 4. This is where you falsely fail to reject a null hypothesis.
There was a connection between the change you made and the impact you observed, but because you did not accumulate enough power in your test, you attributed the impact to random chance.
Coming to this conclusion can be a result of using a statistical power that is too low. You should have continued with your experiment until you had enough power to detect small changes.
On the flip side, you have false positives.
False Positive
False positives are also known as Type I errors. Here you falsely reject a null hypothesis. You saw a connection in change and impact where there was none.
Among other A/B testing mistakes like ending your test too early and peaking, using a statistical significance threshold that is too low contributes to causing this type of error.
Minimum Detectable Effect (MDE) Size
The Minimum Detectable Effect is the threshold value for implementing a change. The MDE says, “If the positive result (uplift) is higher than I am, then the change is worth implementing.”
A high MDE means your test is set up to detect only major uplifts. With a high MDE, you can reach stat sig while using smaller sample sizes. But make note, observing large effects while running A/B tests is rare.
For smaller lifts, you need a low MDE and large sample sizes. And large sample sizes take significantly longer to reach depending on your traffic size. So, you need to find a compromise between how much time you are willing to spend on an experiment and the lift that would be worth it for you to observe.
Confidence Interval
A confidence interval uses a margin of error to present you with an expected range of outcomes. When you see the results from an A/B test, you’ll see a line like the following:
Difference in conversion rate (AKA lift): +13% ± 1%
This means that the conversion rate may be higher (+) or lower (-) than 13% by 1%.
If you run your tests for longer and increase your sample size for statistical significance, your margin will get smaller and smaller.
There is, however, a point where the margin becomes so narrow and stops shrinking. The margin can never be zero because we live in an uncertain world.
Statistical Significance Made Easy
Statistical significance is a complex concept that is often misused in the world of A/B testing.
Here’s a real-world picture for you.
Let’s say I have a page that sells my eBook: How to Teach Your Cat to Speak German. I’m selling the book to cat owners in San Francisco, CA, and have managed to drive over 10,000 visitors to my sales page with a conversion rate of 1.6%.
That means 80 out of 5000 of my visitors buy my cat training book.
As the CRO-savvy marketer that I am, I design an A/B test to try and boost my conversion rate. The challenger shows a different cover image of my eBook that I believe is more persuasive than my original.
My null hypothesis: The new eBook cover image will not have an observed effect on my conversion rate.
My alternate (test) hypothesis: I will see a conversion lift when I use the new eBook cover image.
I set the threshold for statistical significance at 95%.
Assuming I 100% depended on stat sig to decide, at what point can I stop the test and trust my result?
Do I stop when I have 100 conversions on the variant (the page with the challenger cover image)?
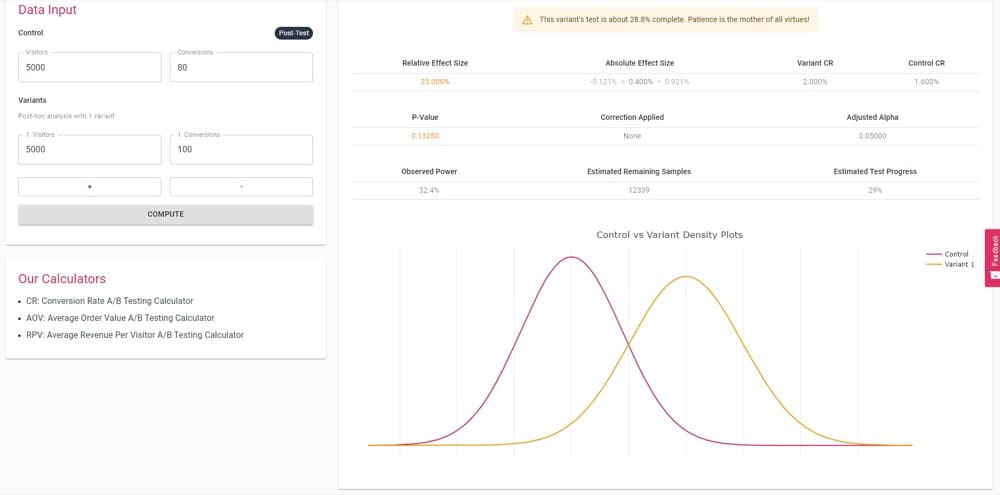
According to this result from the statistical significance calculator, at 95% statistical significance, I cannot trust the variant to beat the control again and again. This suggests I should let the test run for longer to be more sure.
That’s that wait-time we were worried about when we started this discussion.
What if the variant pulled in more conversions? Say, 120.
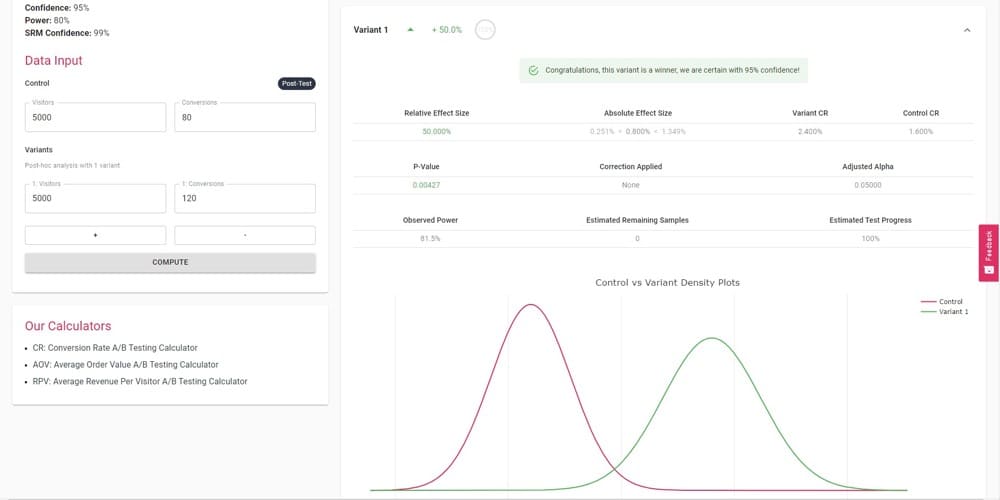
Now, this is a more definitive result that tells me I can trust the variant to beat the control 95% of the time. I can live with that. Time to sell more cat training eBooks.
Within this story, the 7 terms we defined above played a role in helping me visualize and understand the before-and-after of my test results.
For this test, I set a confidence level of 95%. This means my significance level is 0.05; a number that plays a huge role in giving context for my statistical significance as it compares to the calculated p-value, and if the latter is inferior to the former, we can reject the null hypothesis.
When explaining p-values, Cassie of Google said in this video:
When we do hypothesis testing, we’re always asking, does the evidence we collected make our null hypothesis look ridiculous? Yes or no? What the p-value does is provide an answer to that question. It tells you whether the evidence collected makes your null hypothesis look ridiculous. That’s what it does, that’s not what it is.
Cassie Kozyrkov, Chief Decision Scientist, Google
In this case, does my p-value make the idea that the new cover image not boosting my conversion rate look ridiculous, in mathematical terms, it is < 0.05 (our significance level)?
The closer your p-value is to zero, the closer you are to being certain that your results are not a coincidence.
Once my calculated p-value becomes inferior to my significance level, I can trust that my new cover image (the variant) will consistently perform significantly better than my old cover image (the control).
This will happen when the test is exposed to the calculated sample size, meaning it’s accumulated enough power (in this case, I used 80% as you’ll see in the screenshot of step 2).
Anything less and I’ll risk making a false positive. So, statistical significance is just one part of it. We have to account for power too.
Which brings us to two common questions folks ask: “What if I hit 95% earlier than expected, should I stop the test?” and “What if, at the end of the test period, I still haven’t hit statistical significance?”

Let’s address these situations next.
Misconceptions Around Statistical Significance
Did you know statistical significance is not the holy grail of testing?
Sadly, my koala friend, stat sig does not explain everything. This is one of many misconceptions surrounding statistical significance.
Let’s tackle these misconceptions one by one.
Only When p-Value = 0.05 Can Results Be Statistically Significant
As we’ve stated earlier, setting your statistical significance threshold at 95% is a conventional practice, but not a universal one.
This threshold is one you can choose for yourself, given the details of your experiment, the specific campaign you’re running, how much assurance you’d like to have around your results, and the risks you’re willing to take.
There are situations where 95% is not considered good enough. For instance, when working with aircrafts, you’ll hear statements such as, “There’s very little margin for error,” or “This has to be perfect”.
Chances are your marketing campaign doesn’t share quite the same sentiment as an experiment on an aircraft. But you can go with 99% to minimize the chances of making false positives. This will serve well if you didn’t calculate the required sample size before starting the experiment.
It all depends on how much risk you’re willing to take with your next steps once you see the results of your test.
A Statistically Significant Result Means Your Test Will Make Lots of Money
This is absolutely not the case.
A statistically significant result simply shows that there is enough evidence that the original unmodified version of a web page and the modified version of the same page result in different outcomes (i.e the Null Hypothesis can be rejected). That there is a real difference in conversion rates, that the change that was made has caused a real effect.
This observance does not guarantee that the observed uplift is:
- Going to propagate outside the controlled experiment environment
This is why accounting for shifts in traffic behavior, like seasonal dips or buying tendencies, is important. - Worth the resources invested in building the test out
Make sure you take care when setting the value for your Minimum Detectable Effect, to make sure the juice is worth the squeeze. The ROI of your test is not the same as the statistical significance of your test.
Basically, it is just a decision-making tool! Should we implement this change or not to improve metric X?
Statistical Significance Means You Can Pause Your A/B Test Early
When you decide to pause or stop your tests depends on your calculated sample size.
Some tools give you the possibility to have stopping rules, but as a rule of thumb, if you want to prove an effect, stat sig is the bare minimum. Yet you also do not need to stop your test as soon as you reach statistical significance, as it’s important to wait for the calculated sample size to be reached in order to minimize the chance of making a small positive, or missing out on a real effect, false negative.
When thinking about the latter scenario, remember that the true value of stat sig depends on a number of other numbers, which in turn depend on other inputs. In an A/B test, your stat sig depends on conversion rate, and conversion rate depends on the total number of unique visitors.
If on Day 1, 5 out of 10 people who visited your variant page made a purchase, that’s a conversion rate of 50%. And when you look at your control page, the conversion rate is still stuck at 10%.
Right out of the gate, you have a clear winner, right? Worth celebrating, right? No, hold on a second.
At this point, the rates are so far apart you can see a high stat sig. Even if the stat sig is over 95%, don’t stop. The statistical significance varies and balances over time as more data is collected. There will be a point where the significance balances within a certain interval and settles around +95%.
PS: Pausing tests should be based on sample size, i.e. how many people “see” the test, because at the end of the day an A/B test is trying to quantify and explain people’s general behavior.
You Can Calculate Statistical Significance Every Day
This is a classic case of peaking, one of the most common A/B testing mistakes.
Calculating stat sig every day shows ignorance to the fact that that stat sig fluctuates. What should be paramount in the decisions you’re making about your test is the sample size.
Have you observed enough people to have the insights you need to make a definitive decision from the data collected?
There are more important questions than “Did we reach statistical significance?”
Your A/B testing results do not, and should not, exist in their own isolated universe. Keep in mind the other factors that affect how your results will be used: the practical significance of your results and how they influence business decisions.
If you would like to dig deeper into the misconceptions that surround stat sig and would like to, perhaps, correct the ones remaining, here’s a great resource by Steven Goodman.
Statistical Significance Calculators Statisticians Use
Chances are you skipped all those formulas at the top and came straight to this section. Great choice!
You don’t need a pen, paper, and a calculator to find statistical significance for your A/B tests in today’s world. We have tools for that!
Check them out:
1. Convert’s A/B Testing Statistical Significance Calculator
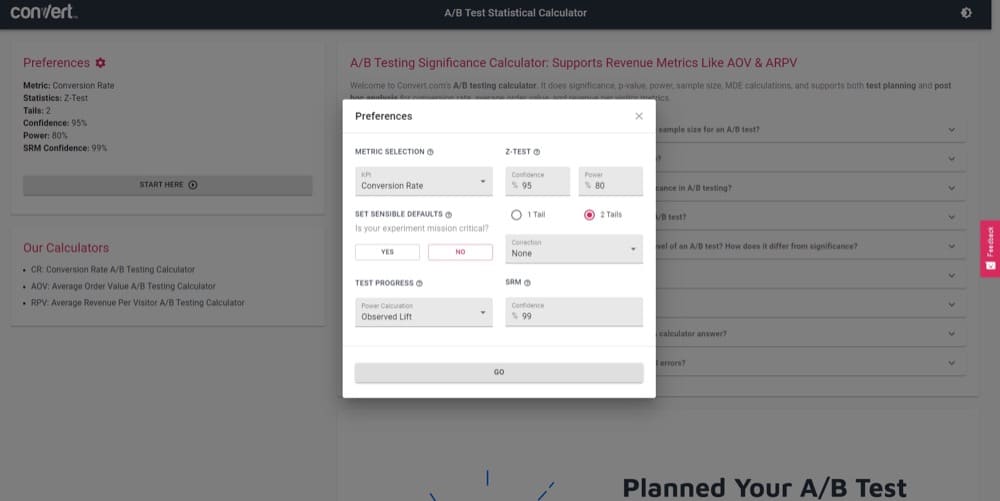
With this tool, you can easily calculate significance, p-value, power, sample size, and MDE for both your test planning and after-test statistical analysis stages. You can even visualize results on a graph.
Unlike most calculators, this tool lets you work with other metrics besides conversion rate: average order value (AOV) and average revenue per visitor (ARPV). This is great for eCommerce A/B testing calculations.
If you have any questions while using the tool, you can find the answers on the page. For instance, what does SRM in the preference tab mean? The answer is right there.
Have more than one variant? Don’t worry. You can add variants C, D, E, and more and still get accurate results, as it boasts p-value correction for multiple comparisons.
2. AB Test Calculator by CXL
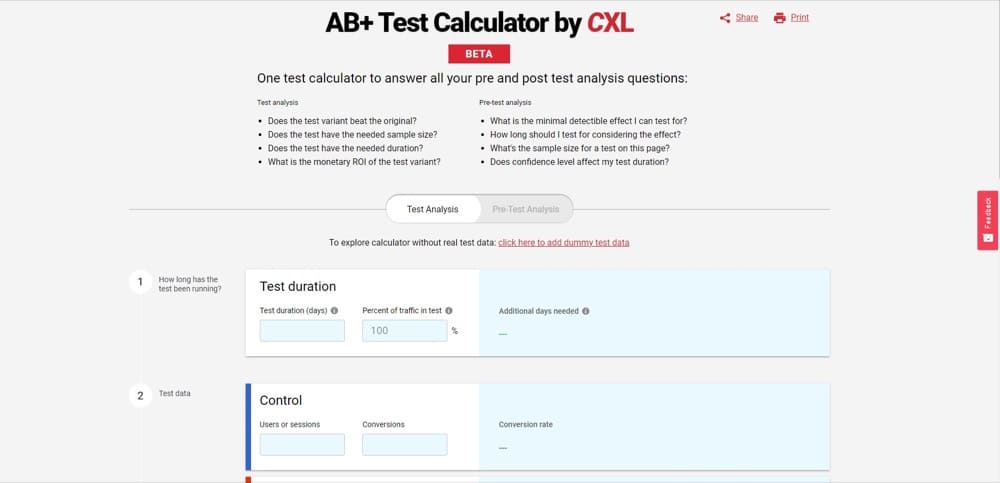
How long should your A/B test run? What is the sample size you need? What minimal detectable effect (MDE) should you expect? These, amongst others, are the questions CXL’s A/B testing calculator can help you answer in the pre-test analysis tab.
When you switch to the test analysis tab, you’ll get answers to questions like:
- Did we reach the required sample size?
- Did the test run long enough to reach stat sig?
- How long should I run my test to reach my desired stat sig?
- What’s the ROI of the test variant?
This tool also supports adding multiple variants.
3. Statistical Significance Calculator by Analytics Toolkit
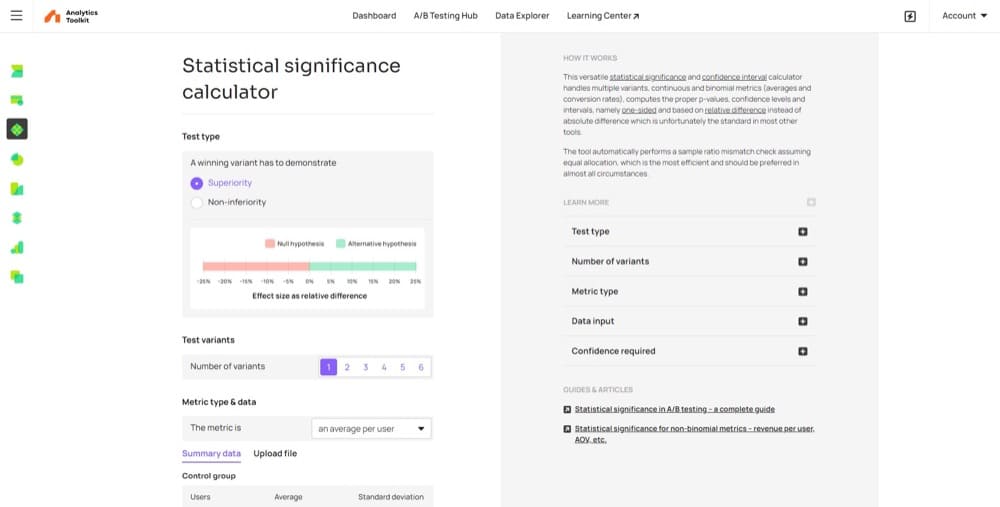
Unlike the first two tools, this one is not free. However, there is a free trial that supports the calculation of
- Statistical significance
- Confidence interval, and
- P-values.
The many other features included make the tool worth the investment.
Note that this tool is designed to be a comprehensive experimentation calculator for CROs, with features like meta-analysis for multiple experiments and test sensitivity estimates. This makes the tool a bit more complex for beginner testers to initially grasp.
Conclusion
The more you understand the statistics behind A/B testing, the better you’ll become at extracting accurate insights. Gaining understanding also makes you less likely to act on distorted perceptions in place of data-informed decision-making.
As you fight back against distorted perceptions, make sure you also check your tool. A/B testing tools are powerful, but if you blindly follow the tool, you’re removing the human element from the experiment.
You’ll also want to be mindful of the statistical models your vendor uses—frequentist, Bayesian, or hybrid—and from there, gain an understanding of how they interpret the results.
A great starting point for developing your understanding of A/B statistics is checking out Trustworthy Online Controlled Experiments (A Practical Guide to A/B Testing) by Ron Kohavi, Diane Tang, and Ya Xu.