Trying to understand A/B testing metrics is like going down a rabbit hole of overcomplicated definitions, technical jargon, and never-ending expert “opinions.”
We don’t blame you if you’ve let out more than one exasperated sigh trying to find something of value online.
Even if you’re convinced you want to run experiments, it may feel like those in the know are gatekeeping information.
But we’re determined to change that. Experimentation is for everyone and by the end of this, you’ll believe that too.
A Hard Truth About Getting Started with Experimentation
We’re going to dive into how metrics are viewed through different lenses but, first, we need to come clean.
You’ve probably heard this statement before: “There are no losses in A/B testing – only learning.”
This is partially true.
Inconclusive (flat) tests and even losses can help you get a clear idea of what does not work for your target audience. But if you’re building out the experimentation program and don’t have C-suite buy-in yet, be prepared to navigate some tricky waters. Understand that the ones holding the purse strings won’t be particularly happy about having esoteric discussions about “learnings” without considerable education.
To get their approval, you will need to show quick and tangible wins first. A/B test results that your managers can report to the leadership so they show some faith in the fact that the largely academic scientific method of experimentation can indeed propel something as practical as a business forward.
And the easiest way to do that?
Go after the lowest hanging fruit: Improve conversion rate on a user experience that is reasonably close to influencing deals or purchases. Say, a straight-up increase of 1000 units in orders placed (as indicated by your test outcome) is easy to convert into dollars and profits.
Bring that report into a board meeting and you’ll have the room buzzing with excitement — the kind that comes from discovering another “acquisition channel” aka CRO.
But the quarter will come and go without you ever seeing the promised spike. Executives that hailed you as the future of the business will be mighty disappointed. Budget cuts will follow. And someone high up (*cough* the incorrigible HiPPO *cough*) will spew some mumbo-jumbo about how experimentation can never trump traditional channels like ads and events that have stood the test of time.
[HiPPO = Highest Paid Person with an Opinion]
See what just happened? By activating your tunnel vision, you relegated experimentation to being just CRO — something that is viewed (almost) as a new-fangled acquisition channel to recover money left on the table. And along with that? All the big claims, scams, and pitfalls that tend to accompany it.
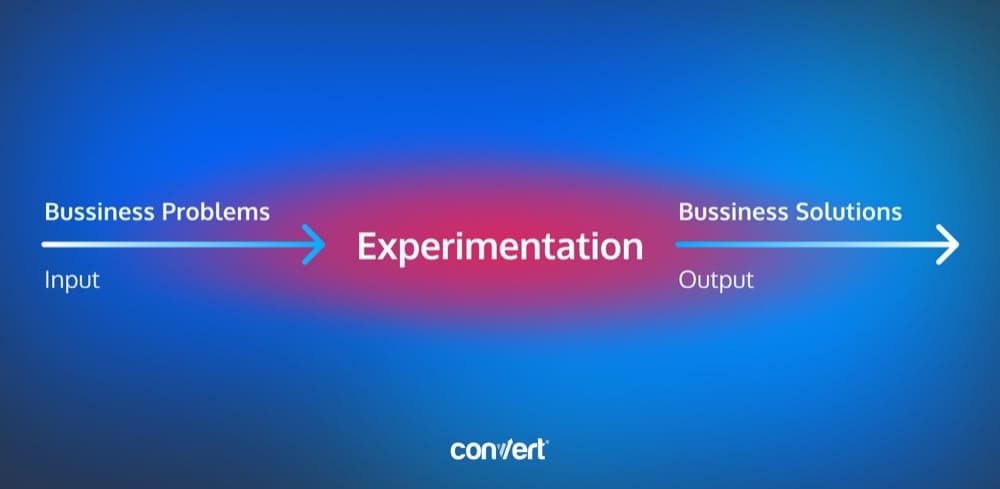
Experimentation is a machine. But most people have a flawed understanding of how it works.
They think that the input is business problems and the output is statistically significant valid business solutions. And this may be the ideal bigger picture.
Zoomed in, the experimentation machine accepts learning and effort made on the scientific process as input and yields program metrics as the output.
But there is a big IF here: For the output to eventually yield the anticipated and desired outcomes, the quality of the experimentation program is paramount.
TL;DR: The better the input (data gathered, education, certifications, data literacy, and processes), the better the output (experiment velocity, win rate, average win per experiment.), and the higher the chances of achieving the goal(s) you’ve aligned your experimentation program with.
Only when you obsess over experimentation quality will you have a higher chance of seeing an outcome that can move the needle on big growth and efficiency problems that all businesses want to solve.
The way to get there is to have a metrics strategy that does not put outcomes on a pedestal.
Instead, it helps the team measure and track the input and the output (the input being the only factor that is squarely in control of the optimizer) and use them as a gauge of progress. The journey to the outcome isn’t a sprint, it is a marathon that is run in the background as a by-product of good experimentation.
Don’t get us wrong. This is easier said than done.
Often experiments will show that certain changes shouldn’t be made. Particular features should not be shipped! And experimentation in and of itself is deliberate… taking the focus off of a shipping first strategy to an insights and learning first strategy (supported by the right metrics).
Experimentation-hesitancy is incredibly common among executives. Most founders have years of building the company without experiments, and it can feel like experimentation is a conservative force that gets in the way of company speed, product marketing, and moonshot innovation.
The Case for Switching to an Insights First Strategy (With the Right Metrics)
To make actual progress, we have to make the switch from chasing a shipping strategy to a metric strategy. This decentralizes product strategy i.e. pushes ideation down to the bottom which is ideal. And adopting a metric strategy intrinsically means experimentation. You can’t shy away from testing how new product changes affect your business.
The “why” of your experimentation program is encoded in your metrics strategy.
Is all your effort focused on quick wins and revenue?
Is experimentation the way to understand your customers and offer them value throughout their lifecycle?
Or is experimentation the goal in and of itself, where the better you test, the more reliable insights you generate and your responsibility is to keep this wheel in motion, without negatively impacting existing experiences?
More on this later with Ben Labay of Speero.
On an experiment-to-experiment basis, metrics cement your (real) focus. You can have a 10-page manifesto talking about embedding experimentation in the DNA of your business to accelerate innovation, but if your primary objective is always conversion geared, then your testing program is essentially a CRO program. This may be what you want to achieve, but be aware of the constraints that will manifest down the line, including thinking of A/B tests as acquisition/revenue minions—frankly, they aren’t.
Different classes of metrics make it possible to track indicators that matter to the C-suite, while optimizing the program for higher quality tests, causal insights, and going through different iterations to improve the inner workings of the machine so outputs can start to drive outcomes in the long run.
This video with Tim Mehta is a candid peek at why an experimentation narrative that revolves solely around learning isn’t a practical stance to take.
It’s great to get all those learnings, but in order for your business owner to continue to build resources and budget for the experiment program, you need to be able to demonstrate how much dollar value it is bringing to the business.
Often, experiments are about learning, which is at the heart of the scientific method. It’s not as much “win/loss” as it is “hypothesis proven or rejected”. Whereas with what we’re doing, on the marketing side, we need to be able to communicate some kind of win or revenue value to continue our work.
Tim Mehta, Director of Growth Marketing at Lucid Software
On a more practical level, metrics hold learning. Running flat tests back to back? This might be an issue with the way you gather data (instrument focused problem) or with the way you design experiments. Metrics help you find the needle in the haystack and do better.
TL&DR; Metrics help testers capture various facets of experimentation, and distribute its impact to stakeholders in a language they understand, value, and appreciate. Metrics strategy goes well beyond “goals” and the stake in the ground against which winning variations and losses are evaluated.
Through metrics, experimentation programs live, mature, evolve and succeed (or fail).
Input, Output & Outcome Metrics: Deconstructing Experimentation Programs with Ben Labay and Alex Birkett
There are lots of definitions around primary, secondary, and guardrail metrics. But anyone who has run an experimentation program knows that there has to be a framework to define the different levels of goals.
What is your go-to metrics framework to map variables measured to multi-layered experimentation impact?
Ben’s Framework
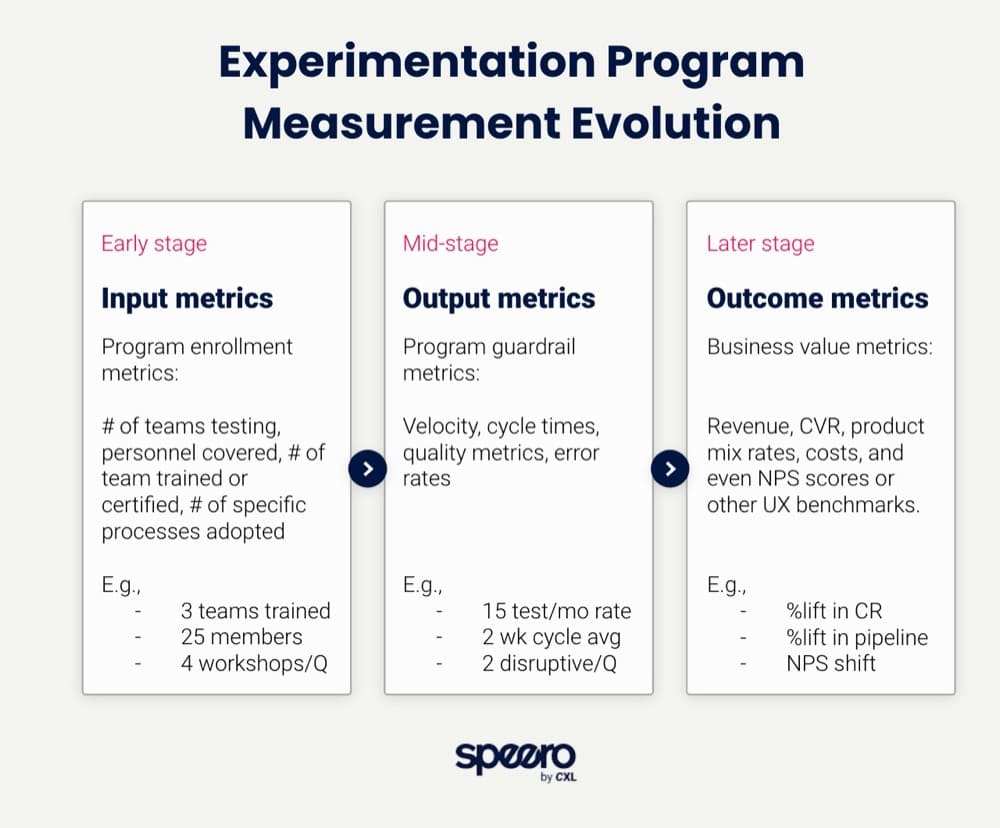
1. Program metric categories
This ‘by stage’ is to be taken lightly. You want to monitor all of these all the time, but the FOCUS is a bit different depending on the stage of the program.
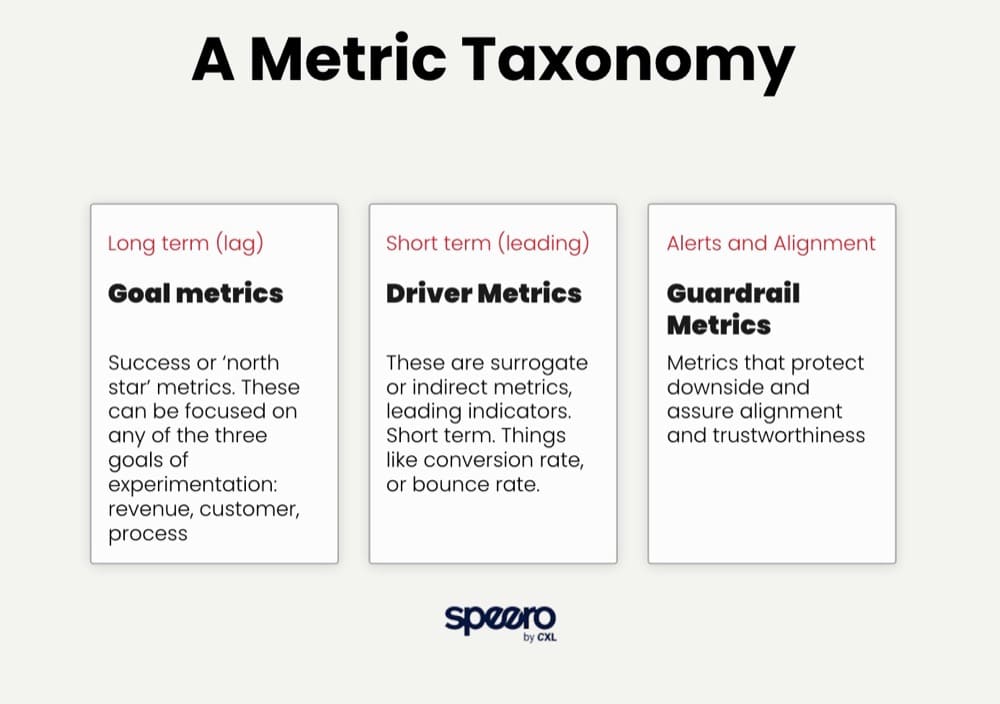
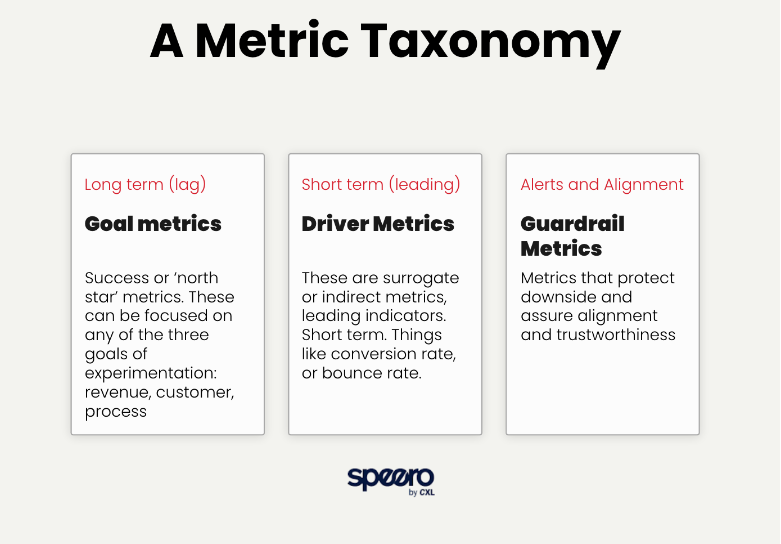
2. Start out with a top-level metric taxonomy, here’s mine:
Then, for each,
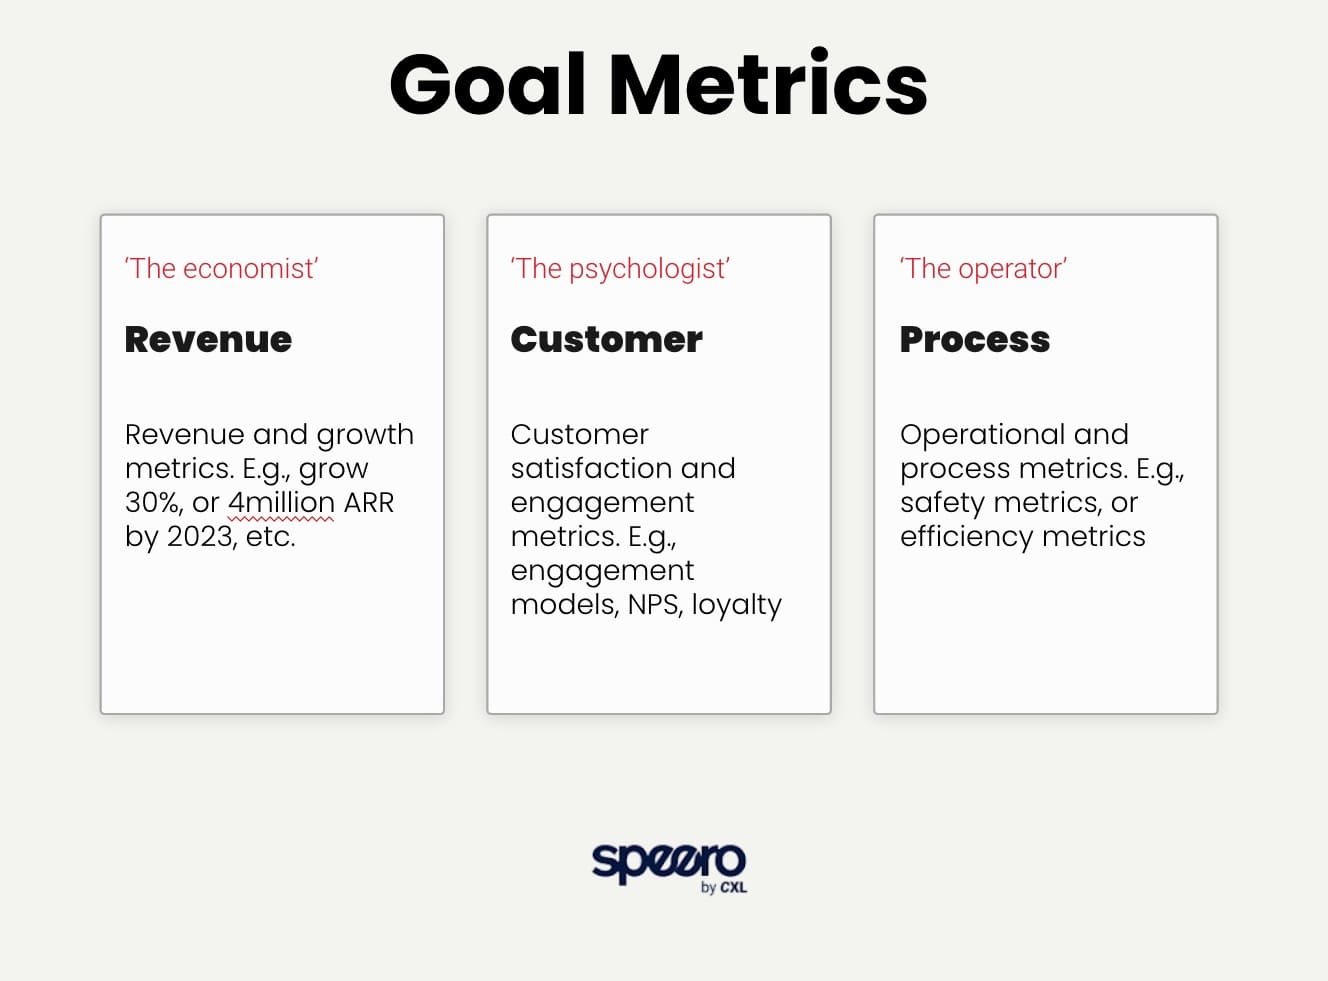
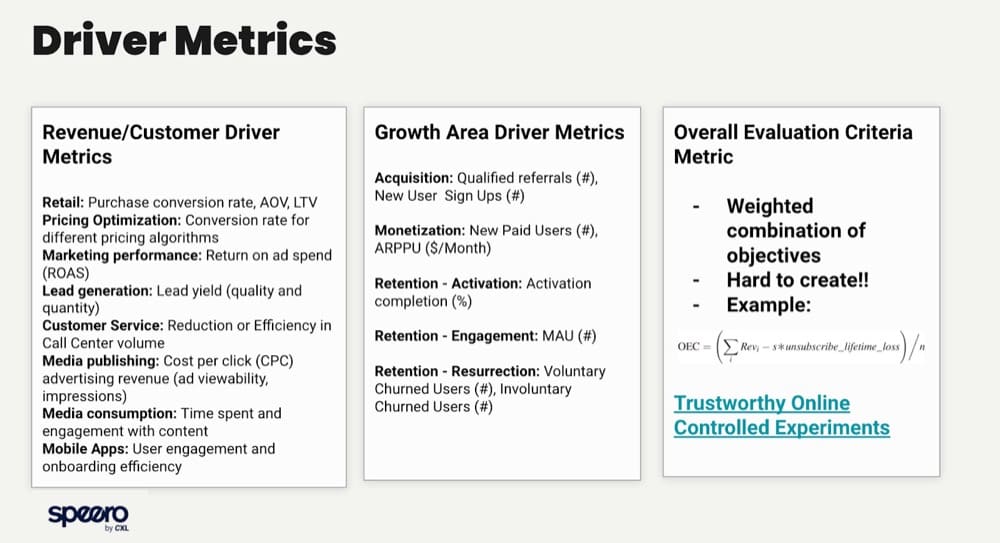
3. Goal metric examples:
Then
4. Driver metric examples
Then
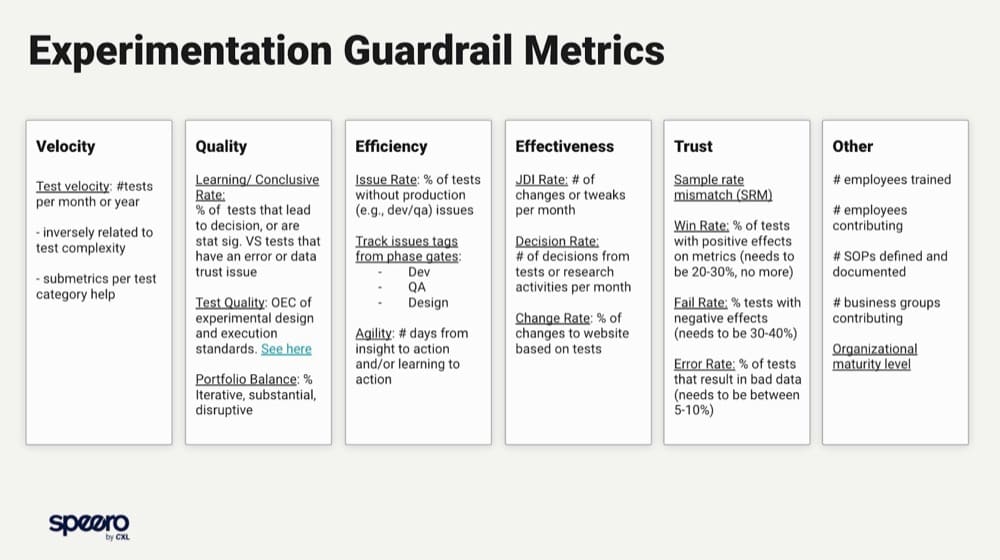
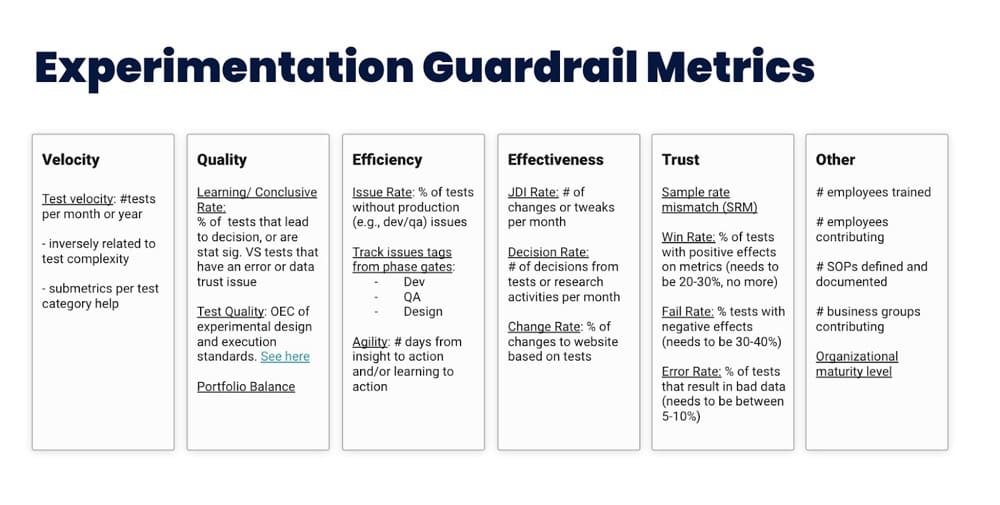
5. Program guardrail metrics
So…. THEN you have the ingredients for a metric strategy:
Note: Early-stage experimentation should focus on the input metrics but you have to deal with the pressure of producing outcomes that won’t materialize if you don’t have the right education, people, and processes.
It’s a self-defeating cycle. Also, outcome metrics shouldn’t be celebrated right off the bat especially if you are projecting “revenue”.
“Guests had to first ask permission for hosts to stay in their Airbnb, and hosts would get to decide if they like the booking request. This created a ton of friction, was a terrible experience for guests, and opened the door for improper bias to enter the process.
A product shipping strategy would have dictated a bunch of features to ship. But Airbnb set up a strong team with a metric strategy: make Airbnb reach 100% instant book.
The result was an experiment-heavy strategy that cumulatively shifted the marketplace. The product changes spanned search ranking, host onboarding, and core host functionality (e.g. guest controls, house rules, lead time settings, etc.) that allowed hosts to be successful in a world where guests book their home instantly.
Erik Bernhardsson
Alex’s Go-to Framework
My go-to framework for mapping out experimentation metrics is a simple one: input and output metrics.
Stakeholders care about output metrics. These are used in ROI calculations and prove the value of the program – things like website conversion rate, funnel conversion rate, high-quality leads, etc.
Personally, I think these are overrated on a programmatic level and underrated on a per experiment level. By that, I mean that if you’re tracking the conversion rate of your webpages quarter to quarter, experimentation isn’t going to be the only thing that happened during that time period. Fundraising, macroeconomic trends, shifting of acquisition channels – all of these can be massive confounding factors. You can get around some of these by having holdback sets or retesting the baseline version of your digital experience.
They’re underrated on a per experiment basis because people tend not to think through their core experiment KPI, instead opting to include a variety of goals and cherry-pick the one that fits their narrative. It’s really hard to come up with a composite goal, an overall evaluation criterion, to define your experiment. Input metrics are a better way for me to get a gauge on our program. The main three I look at are a) experiment velocity b) experiment win rate and c) average win per experiment.
If I move the needle on any of these, I’m likely to move the needle on my output metrics
Goals, Drivers, and Guardrails: Metrics by Scope
Ben Labay uses the analogy of a car to explain these metrics:
The crux of it is that you’ve got long-term metrics like goal metrics and this is your GPS or navigation system i.e. the north star metrics (NSM).
This is in contrast to driver metrics which are the shorter-term metrics aka your speedometer. For instance, conversion rate optimization for average order value (AOV).
Put this in further contrast to your alert and alignment metrics, like your tachometer or your heat gauge; these are your guard rail metrics.
P.S. Watch this video by Ben to understand these categories better:
Goal or North Star Metrics
A North Star metric or a lagging or broad scope metric as defined by Ben is more strategic than tactical in nature.
For instance, Netflix’s A/B tests aren’t built to improve engagement—they’re designed to increase retention. If they’re retaining customers, it means subscribers engage with and find value in the product. So, retention encapsulates several tactical metrics like the percentage of users who pay or watch more than 3 pieces of content.
These leading indicators are what you focus on in the short-term i.e. your bounce rate, and conversion rate. Sometimes, having a single metric isn’t sufficient to evaluate an outcome. That’s where Overall Evaluation Criterion or OEC comes into play.
Also known as response or dependent variable, outcome variable or performance metric, OEC is essentially a combination of differently weighted KPIs as a single primary KPI.
A single metric forces trade-offs to be made once for multiple experiments and aligns the organization behind a clear objective. A good OEC should not be short-term focused (e.g., clicks); to the contrary, it should include factors that predict long-term goals, such as predicted lifetime value and repeat visits.
Ronny Kohavi
Guardrail Metrics
According to Ronny Kohavi,
Guardrail metrics are critical metrics that are designed to alert experimenters about a violated assumption. Guardrail metrics provide what Spitzer (2007) calls the “capacity to instigate informed action.” When a Treatment effect unexpectedly moves a guardrail metric, you may want to reduce trust in the results, or stop an experiment in cases where harm may be done to users or the organization.
There are two types of guardrail metrics: trust-related guardrail metrics and organizational guardrail metrics. We begin with what we believe is the most important guardrail metric every experiment should have: The Sample Ratio, then follow-up with other guardrail metrics and organizational guardrail metrics.
Sample Ratio = In a controlled experiment, sample ratio equals the ratio of allocation of the sample size between the different test groups: control and variants
The value of metrics lies in their ability to predict user behavior. In interpreting metrics, the goal is not to ask, “How many?” but rather to ask “Why so?”. Metrics are a trail left by the user’s mind.
Philosophically, metrics can be broken down into four essential categories:
Group 1 – Amount (the Where and When)
Page views (unique and not unique)
Website Visitors (new and returning)
Visits
Total revenue
Lifetime value
Cumulative cart revenue for a cohort of experiments
Group 2 – Nature (the Why)
Event tracking
Browser/ Platform
Time on page
Transaction details
Page load errors
Screen resolution
Exit page
Group 3 – Source (the Who)
Referrers
Search terms
Country/ languages
Organizations
Top landing pages
Previous pages
Group 4 – Results (the What)
Signups
Number of page views
Orders
Clicks
Trials
Next pages
User retention
While we benchmark data and begin to see how the hypothesis performs, we must consider all validity threats such as
instrumentation effect (test setup, using a double control),
selection effect (different confidence and confidence intervals for control and variants), and
sampling distortion effect (high variance, no statistical certainty).
Based on the above categories, one of the metrics could be a primary metric, say, orders (conversion rate).
Your estimations should be based on:
Success rate – Recent conversion rate trends
Samples received – Recent traffic level and planned number of treatments
The amount of difference in the magnitude of the primary metric between the Control and the Variant and how that impacts business objectives.
Nonetheless, collecting data from your secondary metrics shall help in the interpretation of a test result.
Interpretation may be based on:
The ROI of test
Key insights that are gathered usually answer questions like
What does this test say about my customers?
What motivates my customers?
How do they respond to specific elements?
What do my customers value?
What causes them the most anxiety?
Why are they falling off at a certain point?
Where are they in the conversation?
Subsequent tests: Where else can this learning be helpful?
On an important note, testing elements early in the conversion process allows for more traffic, and testing elements further in the conversion process has a greater potential revenue impact. Therefore, based on the funnel stages, our metrics should also reflect the goal that one is set to accomplish.
Instead, focus on micro-outcomes like newsletter signups and task completion rates, digital macro-outcomes like conversion revenue and revenue, and bottom-line impacting metrics like profit and lifetime value.
💡 As you work with metrics, you’ll start to see how they relate to each other. Most driver metrics are outcome metrics. Guardrails are often associated with output metrics. You may want to run your drivers through the 5Ws as you get down to the nuts and bolts of choosing metrics for your tests. Understanding the basics lets you get creative with your interpretations.
Choosing Metrics That Make a Difference with a Driver Tree
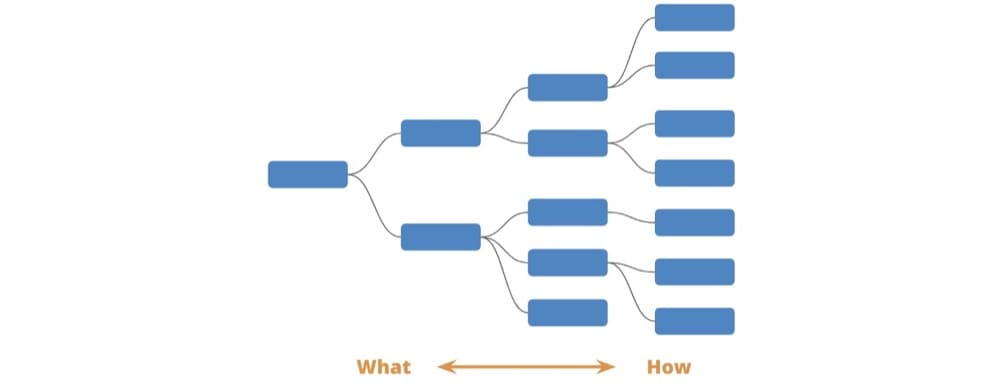
Crafting a solid metrics strategy comes down to understanding what a Driver Tree is.
A Driver Tree is a map of how different metrics and levers in an organization fit together. On the far left, you have an overarching metric you want to drive. This is the ultimate goal you want all the teams to be working towards.
As you move to the right, you become more granular in terms of how you want to achieve that goal. Each branch gives you an indicator of the component parts that make up the “what” above them.
The Driver Tree, when combined with metrics, can help identify potential opportunity areas and guide you to the solution.
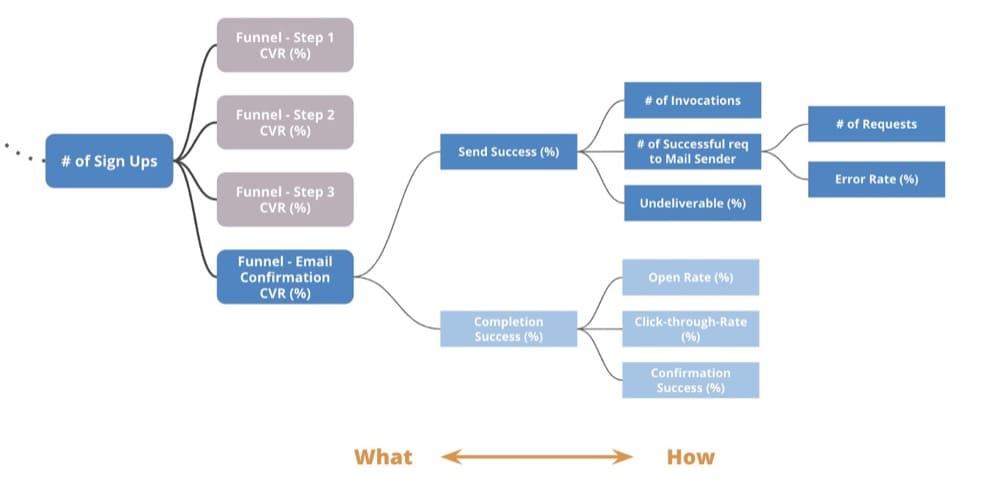
Curtis explains this with an example. For instance, if your goal is to increase the number of email sign ups. Let’s say only half the customers successfully click on the email confirmation link you sent them. There are two possible scenarios here—either customers don’t receive the email or they aren’t clicking on it. These drivers can have different influencing factors.
When you map the process flow onto the Driver Tree, you can get to the root cause. Perhaps the email provider you use has a 10% error rate which means the email was never sent. This specific problem becomes an opportunity for your team to fix.
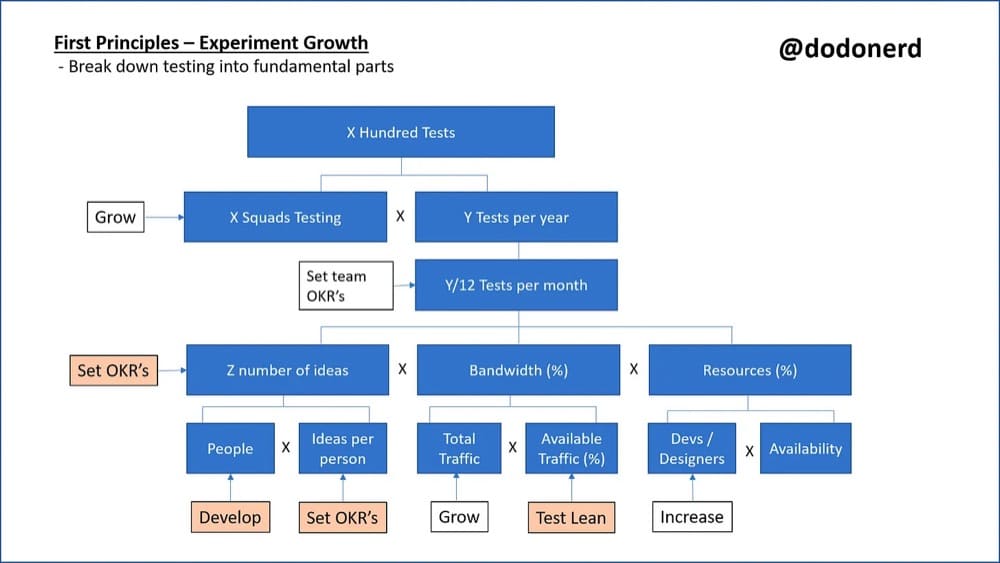
Here’s a specific example courtesy of Bhavik Patel, Head of Product Analytics at Hopin, to illustrate how you can map a goal like test velocity i.e. number of tests run to the driver and guardrail metrics.
Follow These 3 Steps to Kickstart Your Experimentation Program
1.Choose the goal of your experimentation program
Involve the HiPPO aka your C-suite so you don’t chase a north star metric the leadership is disinterested in. Otherwise, your experimentation program will never see the light of day. Loop in people who understand that big problems need innovative solutions, not playing it safe.
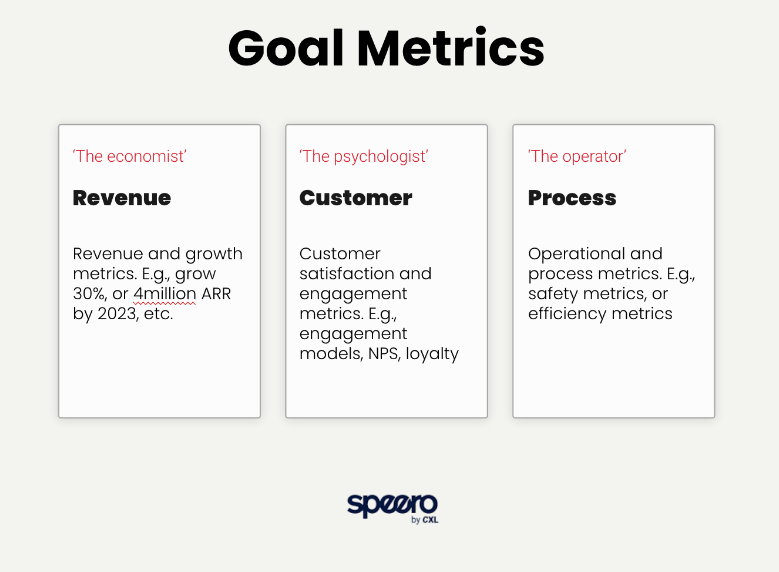
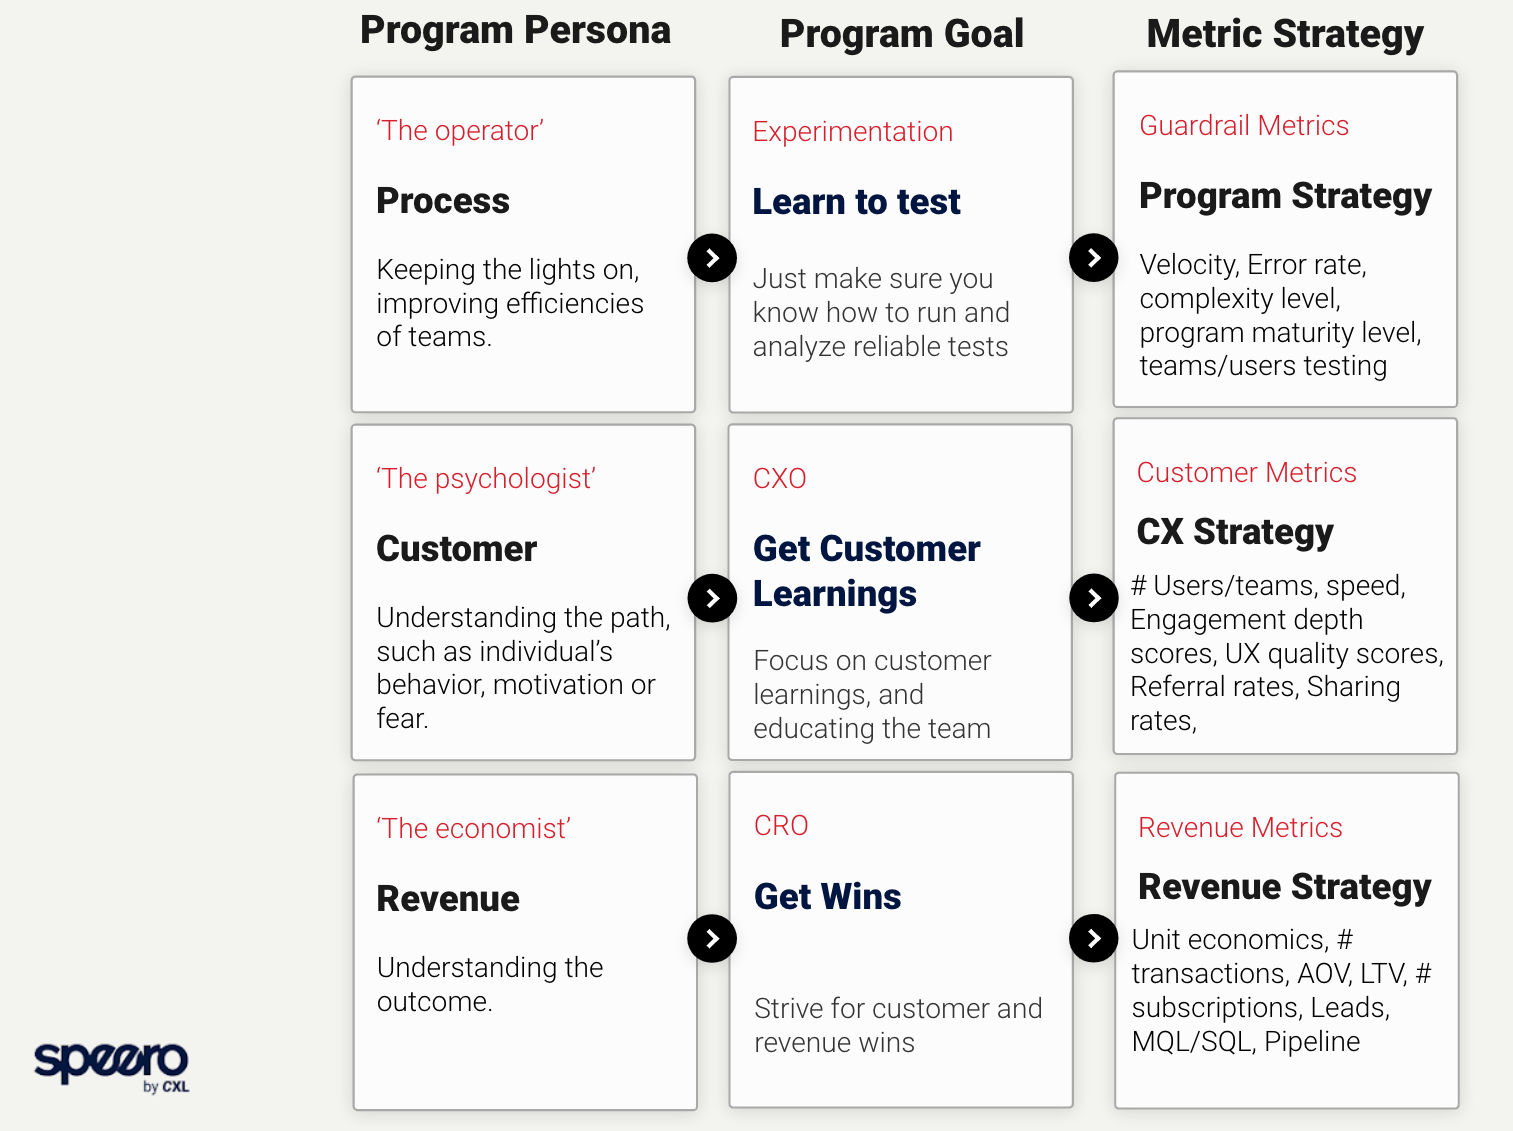
As a rule of thumb, Ben Labay says the lagging, long term goal of your experimentation program can be one of three things – Revenue, Customer or Experimentation Process.
For instance, Booking.com has experiment quality as its north star metric. Here’s why:
What really matters to us is not how many product decisions are made, nor how fast decisions are made, but how good those decisions are.
While using experimentation as part of product development and decision making is common practice nowadays, it does not, by itself, guarantee that good decisions are made. Executing experiments correctly can be difficult, and the data obtained from an experiment is only as reliable as the execution of the experiment itself. Running bad experiments is just a very expensive and convoluted way to make unreliable decisions.
Convert’s Advanced Goals Engine and Templates are Designed to Capture the Real Impact of Tests Run. See How This Works
2. Establish a log of acceptable Guardrail Metrics
Tim Mehta recommends having test velocity as a guardrail metric with a caveat i.e. only if the integrity of your test is good or meets the standard. If you’re not running quality tests, any metric you choose ends up being a vanity metric.
Like Tim, Ben Labay also suggests having test velocity along with these other metrics as a working set of guardrail metrics:
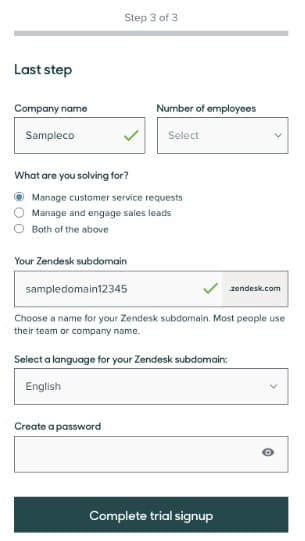
Max Bradley, Senior Web Optimization Manager at Zendesk, believes you should be flexible about driver metrics so you can think inside or outside the box:
We noticed that the subdomain creation field (shown below) was, by far, the most challenging form field on our trial sign up flow for visitors. The drop off rate at this field was considerably higher than any other field.
Crucially, we had tracking in place that allowed us to look into the performance of the form in detail in the first place. If you are starting out, this level of tracking is unlikely to be attainable in the short term but I would encourage “getting into the weeds” with your tracking as time goes on.
When the issue has been identified, we undertook a variety of steps to determine the approach we wished to test. We looked at what other companies did where a subdomain was involved, I would suggest looking beyond just your competitors here. We believed that the user did not need to concern themselves with creating a subdomain, it introduces another area for the user to pause and think, increasing their cognitive load. We can create their subdomain from their company name which they have already provided and hide the subdomain field from users.
We naturally expected that this change would increase the number of users successfully signing up for a trial, we were able to estimate the expected increase due to the tracking mentioned.
However, what we did not know at this point was the overall impact this would have on the business. We expected to see an increase in trial conversions but would this translate all the way down the funnel to Win?
In addition, by hiding the subdomain field and auto-generating the subdomain for the user we wanted to ensure we did not simply pass this problem onto another area of the business. This involved having customer advocacy and customer support involved from the start.
The primary areas we believed would be important in determining the impact of this experiment were as follows:
Trial registration rate for visitors to the form
Leads, MQLs, Opportunities and Wins
Changes made by users to the subdomain name in the product post sign up
Number of tickets received by customer advocacy for subdomain name changes.”
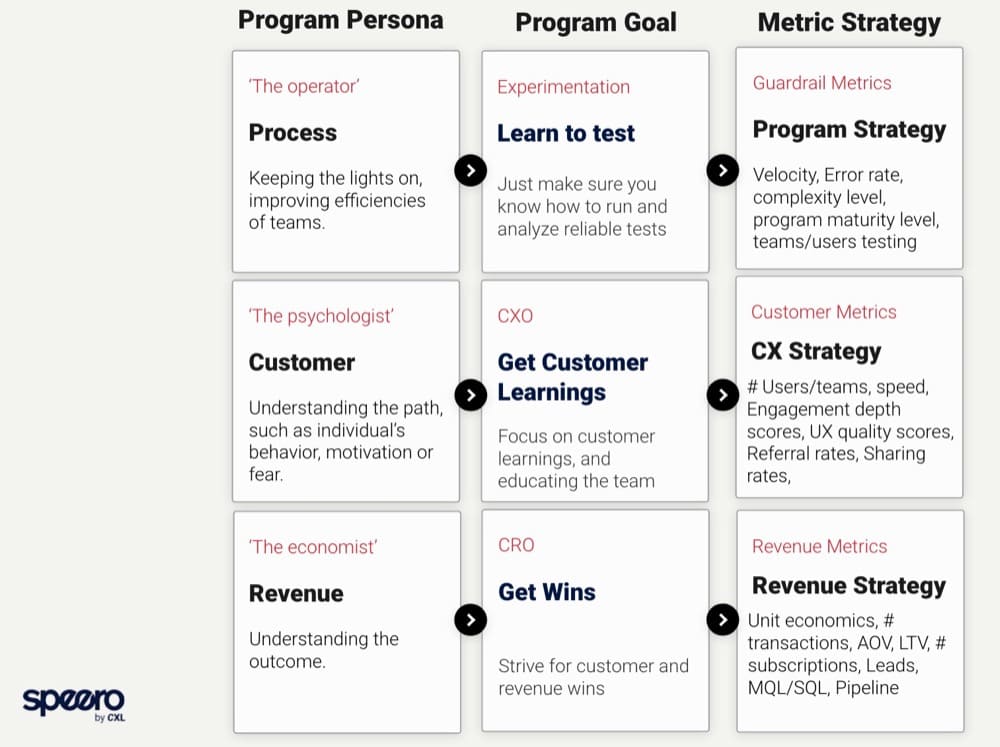
Based on the goal you choose and how you consistently approach your drivers, your experimentation persona and program trajectory can go a few different ways. Take a look at this chart from Ben Labay:
Mental Models: How Pros Choose Their Metrics in Real World Experiments
We asked experts to walk us through an example where they saw the problem, designed the hypothesis, and then chose the metrics to measure success and consolidate learning.
Here’s what they said:
Ben Labay and Goal Mapping
Get clear on where the business is going, and why.
What is the biz growth strategy? Are they growing 20% next year by acquiring more users? Are they going to focus on new products or monetization of the existing user base? With this information you know where to orient the optimization program, you should know where in the funnel or what primary channels to focus on.
For many eCommerce companies in 2021, it was acquisition and converting new users. In late 2022, it’s AOV-centric, which is focusing on profitability and acquisition efficiencies.
With SaaS over the last few years there’s been a pattern of focusing on product-led growth, so a focus on trials, and onboarding especially for down market segments.
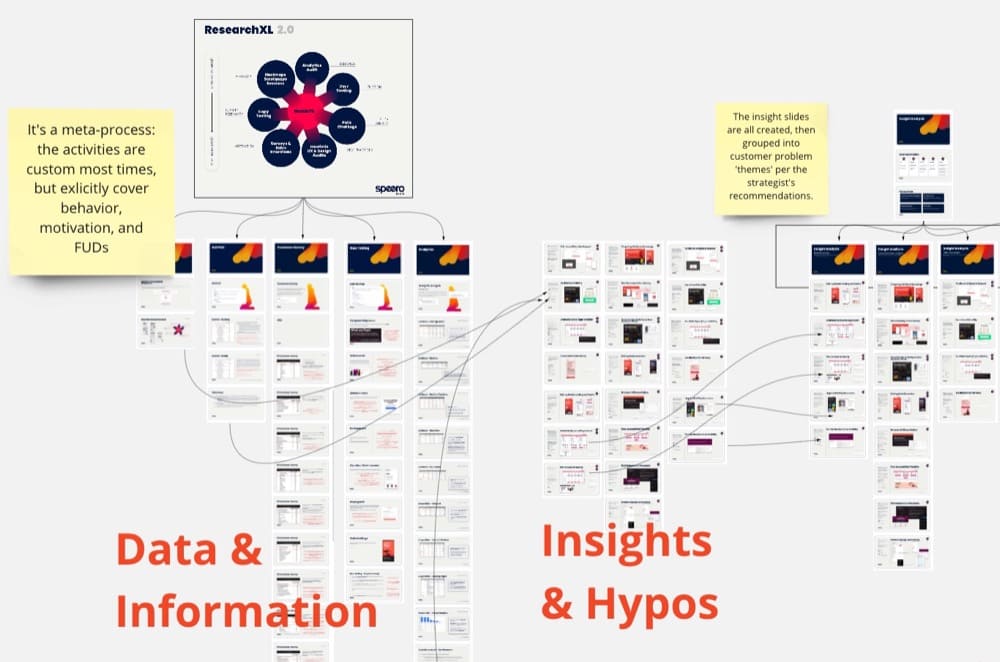
Get a clear understanding of the customer behavior (dropoffs, patterns of navigation, etc.) and perceptions (motivations vs FUDs, fears, uncertainties, and doubts).
We have a great data model on this, ResearchXL, that not only collects data on behaviors and perceptions but marches the data through information into insights that build a prioritized roadmap.
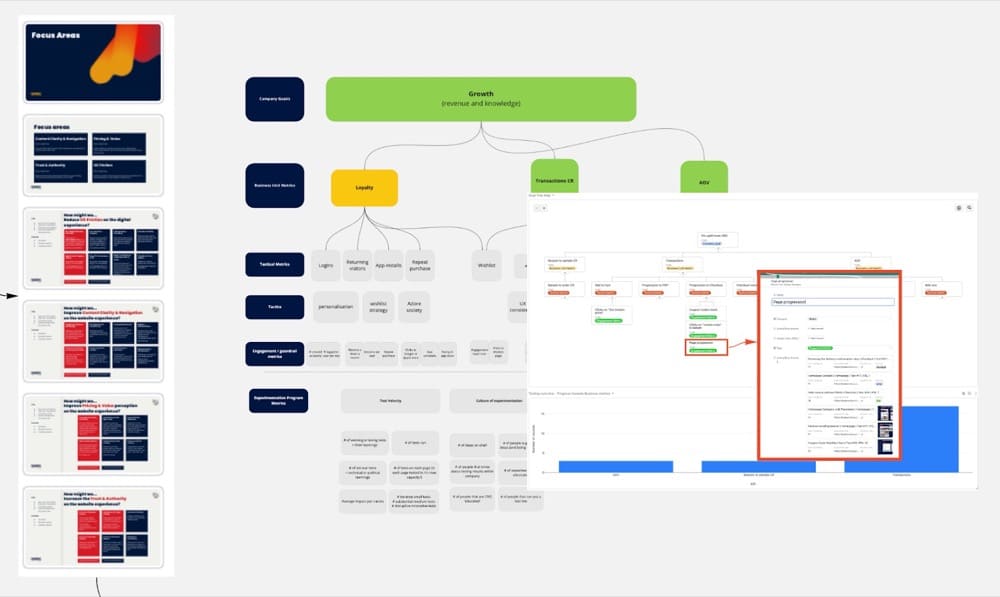
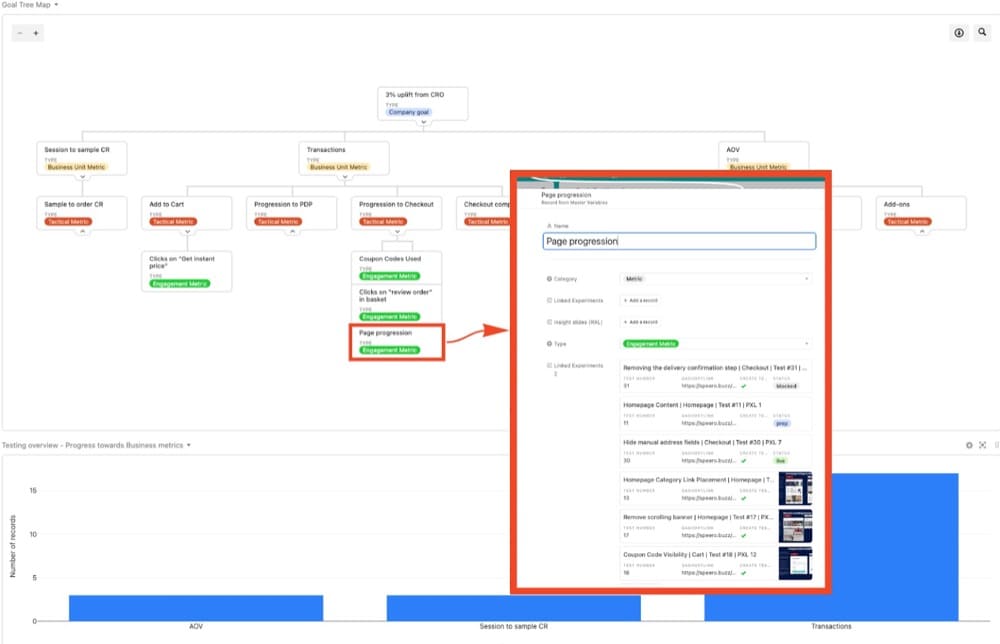
Combine steps 2 and 3, and connect the problems/opportunities themes you create from the customer research to business goals in the goal tree map.
Here’s a closeup of that goal tree map where you can see the experiments that are associated with a checkout page progression metric, which was a focal point for this eCommerce client:
When I was at Workato, we wanted to learn as much as possible about building an interactive product tour. Given we didn’t have a freemium version, many prospects wanted to get a look and feel as to how the product actually operated.
What we hoped to learn determined the KPI for each experiment here.
In one experiment, we just wanted to see if, in contrast to other core website CTA buttons like “request demo,” people were even interested in the concept of a product tour. This was a sort of “painted door” test, although we had actually already built out a minimum viable product tour. In this experiment, we just tracked the proportion of clicks to the product tour and used a non-inferiority experiment on leads (we just didn’t want them to drop).
Then, in optimizing the tour itself, we used the main macro KPI of website conversion rate (leads) and segmented out those who clicked into the product tour to see if there was also a high correlation as well as a macro improvement in our core KPI.”
How Deborah O’ Malley Helped Increase the CTR
Metrics are often client-driven. Usually, they’re tied to revenue. Sometimes, however, clients just want to increase engagement.
In this example, a client in the education sector wanted to increase Clickthrough Rates (CTRs) from a page explaining about an educational program to a page where prospective students could learn more about the program and apply to it.
Based on a data-driven analysis, the hypothesis was that there was so much competing information on the page, that users weren’t clear on how to proceed or where to click to learn more.
It was decided an optimally formatted and timed pop-up, or slide-in notification, would work best to inform visitors where to click to learn more.
A series of experiments were, therefore, carried out to determine the optimal format and timing of a notification pop-up. Clickthrough rates were measured.
As these case study results show (test 1, test 2) optimizing the placement and timing of the pop-up had an enormously positive impact on CTR conversions.
However, while results proved positive, ultimately, submitted applications was the metric that really moved the needle for the school. Additional testing, therefore, needs to be done to determine the optimal way to increase application submissions.
The key learning from this example is that clients often have an idea of what they want to improve. As an experimenter, your job is to meet their expectations, but push further. Increased CTRs are nice. But aim to increase conversions deeper in the funnel. Push as far down as you can into final-funnel money-making metrics, like completed applications or checkout completions. Measure the completions and quantify your success.
Why Justin Christianson Adds Secondary Data Points
We base our goals around objectives. You can’t just think of sales and revenue. Generally our primary metric will be both sales conversions and RPV, but that doesn’t always paint the biggest picture of how the visitors are interacting.
For that we like to set secondary data points such as add to cart, element clicks, visits on certain pages such as the cart or checkout. The secondary objectives change slightly depending on the page or the type of test. Sometimes sales and revenue are not what you are trying to shoot for in terms of outcome.
We use our experimentation to really help understand what the visitors care about, which elements carry weight in the overall UX then build the strategy based on those results. Our hypothesis is generally always asking the question, why or what in the situation. It could be something as simple as moving a section on a home page, then our objectives would be clicks on that section, sales, revenue, visits on product pages. Then how to interpret the data would be that if the visitors showed higher engagement by moving the section, then that section holds weight, therefore the visitors prefer that overall path. An example of this would be to present a collections breakdown vs showing actual product blocks on a page for an e-commerce store.
The problem, Annika explains, isn’t that CRO is unimportant but that it comes with a ton of baggage. It is but a snapshot in time and without context, it can be irrelevant and downright dangerous.
On the other hand, CXO or customer experience optimization focuses on mining quality insights about customer preferences and behaviors – feeding everything from conversion block shattering experiments to robust business strategy. It is just more bang for your testing bucks.
Great content isn’t created by an individual. Say “hello” to the experts who’ve made this guide possible.
Originally published August 01, 2022 - Updated December 20, 2022
Mobile reading?Scan this QR code and take this blog with you, wherever you go.
Authors
Sneh Ratna Choudhary
Sneh is a B2B SaaS Content Marketer & Strategist for brands that want to create quality content that converts.
Trina Moitra
Trina Moitra is the head of marketing at Convert.
Editors
Carmen Apostu
In her role as Head of Content at Convert, Carmen is dedicated to delivering top-notch content that people can’t help but read through. Connect with Carmen on LinkedIn for any inquiries or requests.