Media
5 Charts That’ll Make You Realize How Much Social Media Has Changed Since 2014
If you work in media, you know a lot can change in two years.
Think back to 2014. Tons of marketers still thought of Snapchat as a sexting platform. People were writing things like “Why Pinterest Ads Will Beat Facebook Ads.” Auto-play video, live streaming, and the ability to face-swap with your significant other were all on the horizon.
Recently, Fractl and BuzzSumo teamed up to quantify this shift. The companies looked at the million most-shared articles between December 2015 and June 2016, and compared them to a similar study published in 2014. Here are the five craziest things they found.
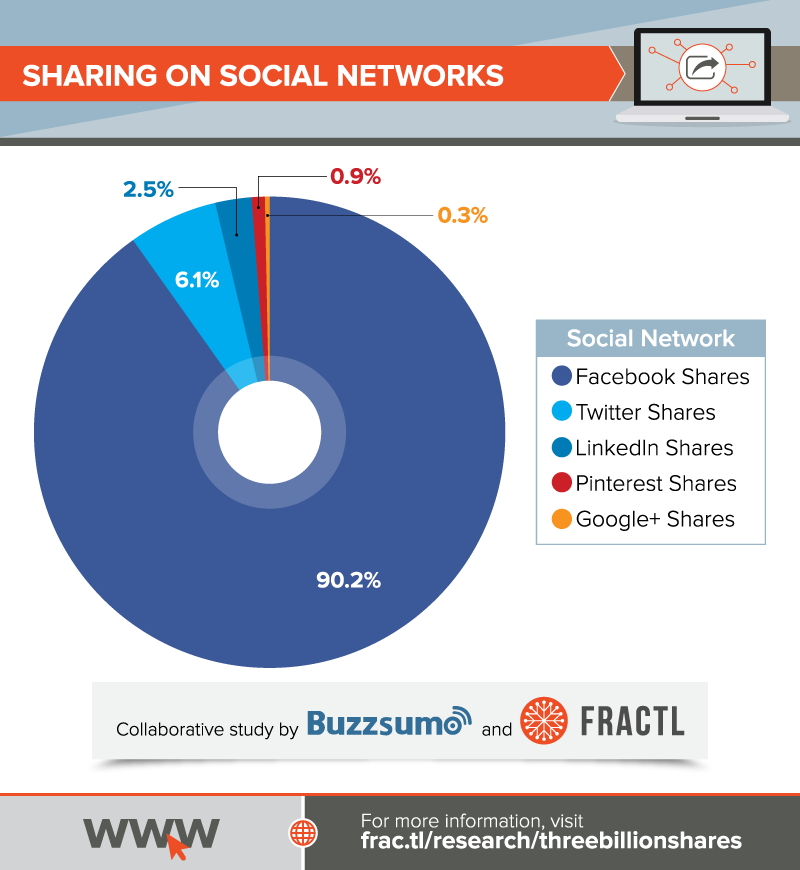
1. Facebook now accounts for over 90 percent of all shares
In 2014, Facebook owned about 82 percent of total shares across the major social networks, but with a bunch of upstart platforms on the rise, many thought it’d peaked. Not so!
With over 90 percent of all shares, Facebook has turned into the old British Empire—willing to extend its reach across the entire internet in pursuit of power, capable of obtaining it with minimal effort, and possessing a seemingly bottomless appetite for it.
Whether this is good or not for the entire industry is a different matter, but if you want to maximize your content’s reach in 2016, you have to go through Facebook.
2. Twitter and Pinterest are in trouble
In 2014, Twitter accounted for almost 9 percent of total shares across the major social networks. Two years later, it’s share of the pie has shrunk by a third, to about 6 percent.
This is a sad confirmation of what’s been a rough few quarters for the company. Twitter’s shakeups at the top, continuous complaints of abuse and harassment, and struggles to engage new users have led some people to go as far as to predict the social network’s demise. Still, those forecasts seem incredibly premature; Twitter is still the only social network other than Facebook to own more than 5 percent of the market.
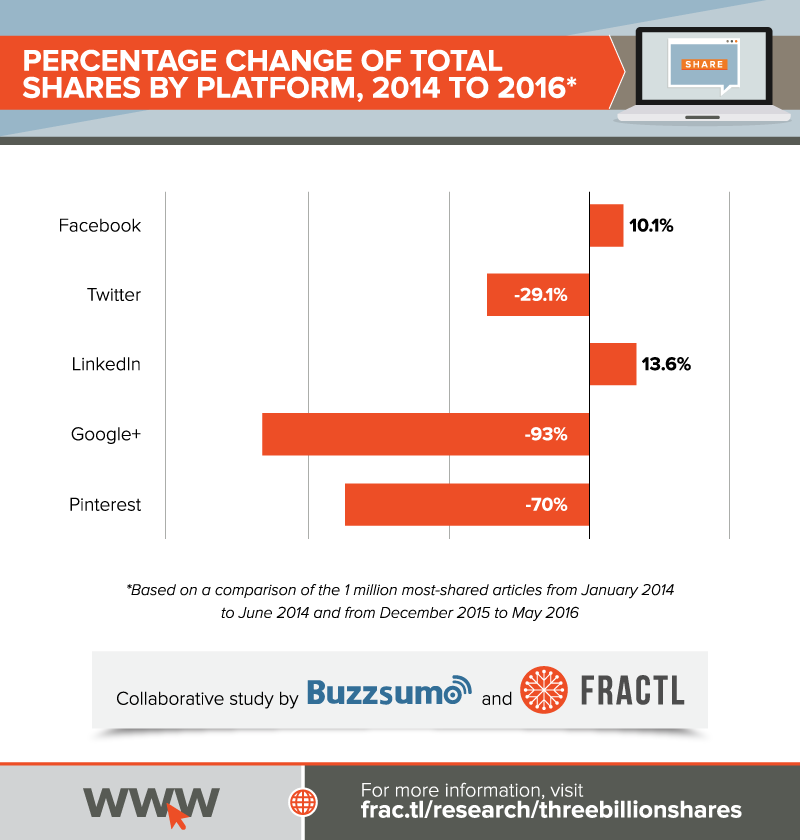
The news might be even worse for Pinterest, which has dropped 70 percent since the 2014 study and now accounts for less than 1 percent of all total shares. As it turns out, #hairgoals boards might not be the future of media.
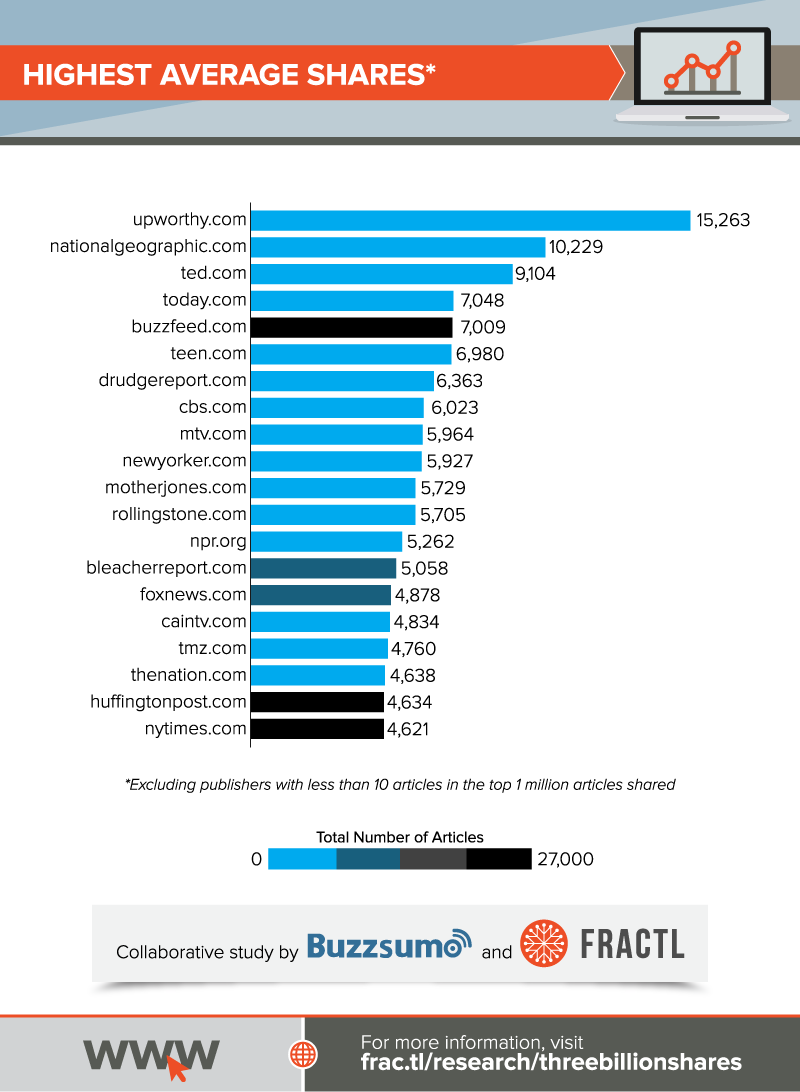
3. The world’s most-shared publisher isn’t your first, second, or third guess
Maybe this is only surprising to naive Americans like myself, but the publication with the most shares across all social platforms isn’t BuzzFeed or HuffPo or The New York Times. It’s none other than Goal.com—a site I’ve never been on. (I originally thought it was a self-help blog.)
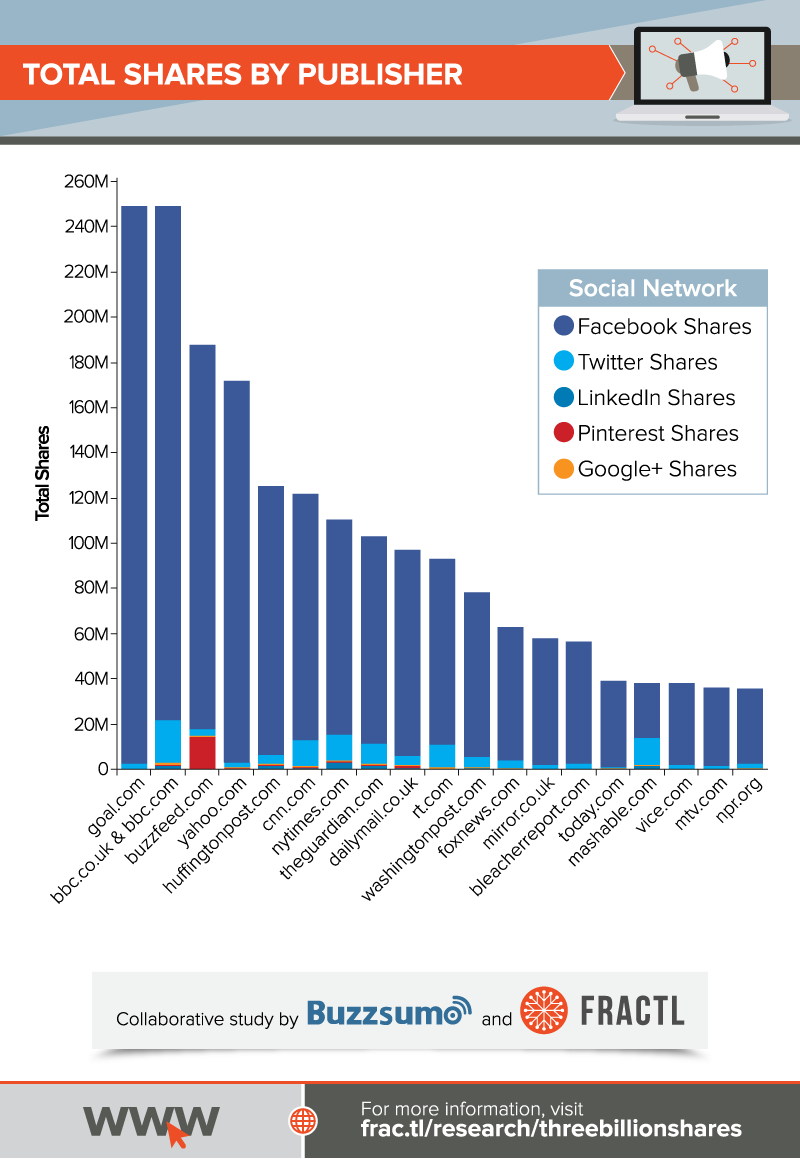
A few factors might explain the soccer website’s surprising dominance: First, Goal.com actually has about half the average share count of BuzzFeed (3,395 vs. 7,009), but had more articles in the analyzed pool. Second, timing was a critical factor, with a lot of big events—Leicester City winning the Premier League (at 5,000:1 odds), the UEFA Champions League Final, the Copa del Rey Final, the Copa America tournament—all taking place in the first half of 2016. Third, there are few topics with as much global appeal as soccer.
4. Upworthy isn’t dead!
When Facebook introduced Trending Topics back in 2014, a little site called Upworthy ate up the algorithm. It seemed that Upworthy’s inspirational stories and videos were always the hottest articles, and once they were trending, they ballooned even further.
Facebook wasn’t having it, though—there was more substance to the mainstream than “Bullies Called Him Pork Chop. He Took That Pain With Him And Then Cooked It Into This.” A few tweaks later, Upworthy seemed to have vanished from the Trending Topics section, and, perhaps with it, its success.
Turns out, we overestimated the depth of society. While Upworthy has seen a steep drop in traffic since the change—average shares per article nosedived from 60,000 to about 15,000—that current 15,000 average shares is still 5,000 more than second place National Geographic.
5. Fox News makes people 🙁
Despite the internet seeming like a very ugly, angry, and abusive place, the sentiment of the top-shared articles—measured as positive, neutral, or negative—was quite positive overall.
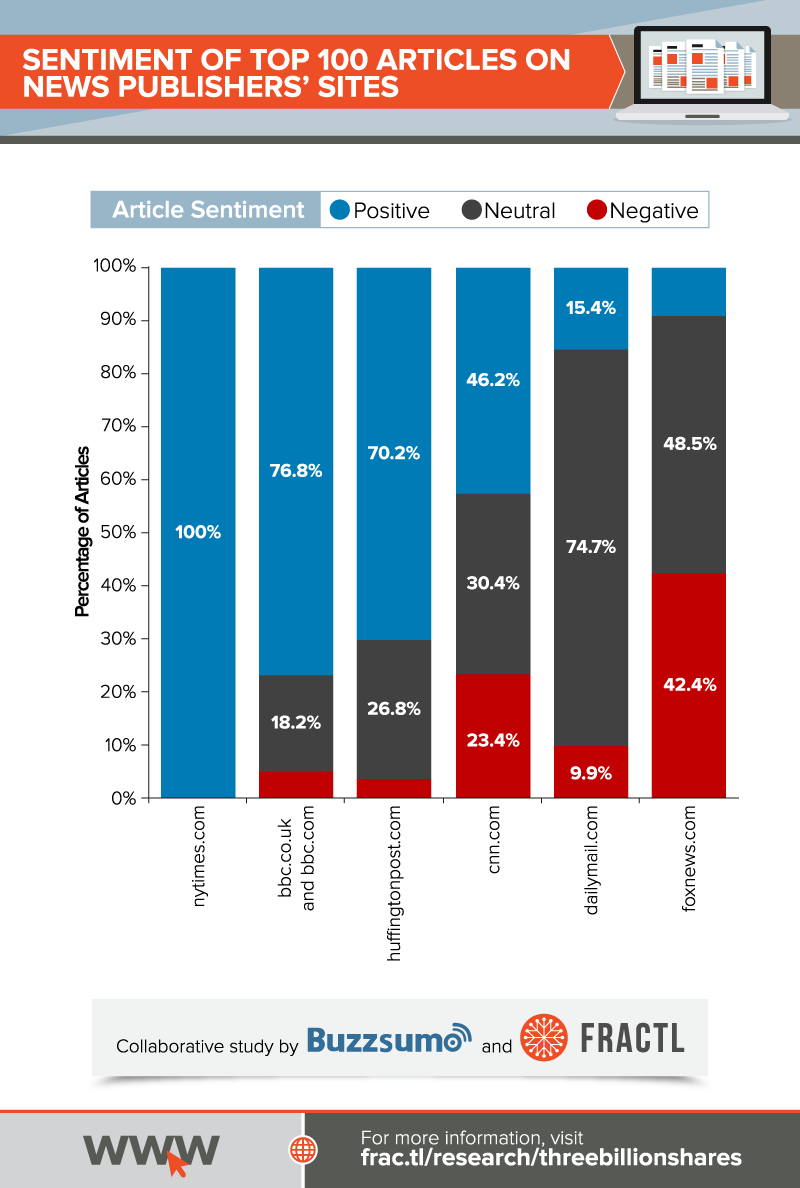
But when broken down by publisher, feelings get a little murky. On one end, The New York Times scored 100 percent positive sentiment on its top 100 articles. On the other, Fox News scored 48 percent neutral sentiment, 42 percent negative, with only the left over 10 percent positive.
Reading into this is tempting, but likely dangerous. How much is the lack of positive sentiment attributable to Fox News’s content versus its audience? We should probably all visit our uncles’ Facebook pages to find out.
Image by GettyGet better at your job right now.
Read our monthly newsletter to master content marketing. It’s made for marketers, creators, and everyone in between.