Insights from Content Consumption Patterns of Software Developer Segment
How is a B2B Marketer supposed to gain a better understanding of their prospects beyond the actions taken on their own site?
Google Analytics won’t do the trick. And in a landscape of more than 8000 Martech companies, there really is no tool available to B2B marketers to understand and inform on this matter aside from what we call Audience Explorer.
What is Audience Explorer?
Based on the content users register for and consume on the NetLine platform, Audience Explorer offers marketers the opportunity to discover tangible insights into their ideal audience segments. Professionals like you can glean so many incredible first-party insights into your buyer audience from real folks who have actually engaged with similar content. Try doing that with Facebook or LinkedIn.
Through an array of data points, tables, and charts, the tool gives B2B pros like you a chance to better understand their target buyer through an interactive interface.
So we’re going to offer up a monthly snapshot into some popular audiences using this tool. This month, we’ve decided to focus on one of the most engaged audiences across the entire NetLine platform: Software Developers.
The features found within Audience Explorer are interactive, enabling you to filter and unfilter with a single click.
Deep-Dive Exercise: Exploring the Nuance of the Software Developer Audience
To uncover the interests of the professionals in the software field, we’ll first choose the IT/Computers/Electronics from the buyer selection dropdown menu. Next, we’ll use the Job Function category to select the 3 Software Job Functions to give us an idea of what they’re consuming.
Those job functions are:
- Software Development
- Software Engineer
- Software/System Architecture
After selecting the U.S. as our Region, this brings our total number of content recommendations from 784,405 to 545,293 over the last 180 days.
Now it’s time to get to the good stuff. Let’s unpack some of the best insights from this report.
But before we do…
Creating the Niche
Seeing millions of engagement points in the first audience (5,440,961!) may have given you a sense of security. Marketers often see large audiences and think, “Hey, this is great, there are so many people in this audience, we’ll definitely have a chance with *someone* here.”
Instead, what you should really be looking for is an engaged audience — an audience that will give you a chance. Remember the words our friend and MarketingProfs Chief Content Officer Ann Handley shares so often: “You can never be too big for your niches.”
Building niches is one of the best ways to use Audience Explorer because you actually get to see what your buyers are interested in. With that point emphasized, let’s begin this analysis in earnest.
What We Can Decipher from the Top Trending Topics
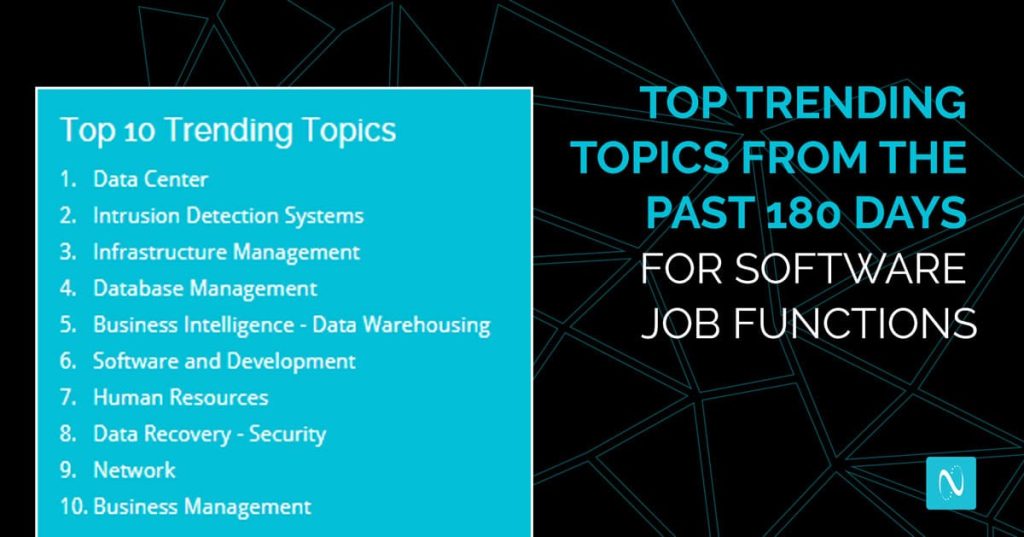
The #1 sought after topic from the last 180 days is Data Center. While this theme can be applied to a variety of subject matters within the software field, our hunch is that the primary catalyst for this demand is the shift to remote work caused by the
On the NetLine side of things, our own CTO, Jayaram Kalpathy, confirmed this hypothesis. He believes WFH is accelerating an infrastructure shift starting with collaboration software like Zoom and (MS Teams).
“Speaking from my own experience,” Kalpathy said, “WFH is pushing [NetLine] to explore Infrastructure Management changes to more cloud based platforms—cloud based phone systems like RingCentral and 8×8 replacing on-prem infrastructure, cloud based data-warehouses like Amazon AWS Redshift and Google Cloud BigQuery, cloud based docs/storage/tools like Office365.”
What the Buyer Stream Tells Us
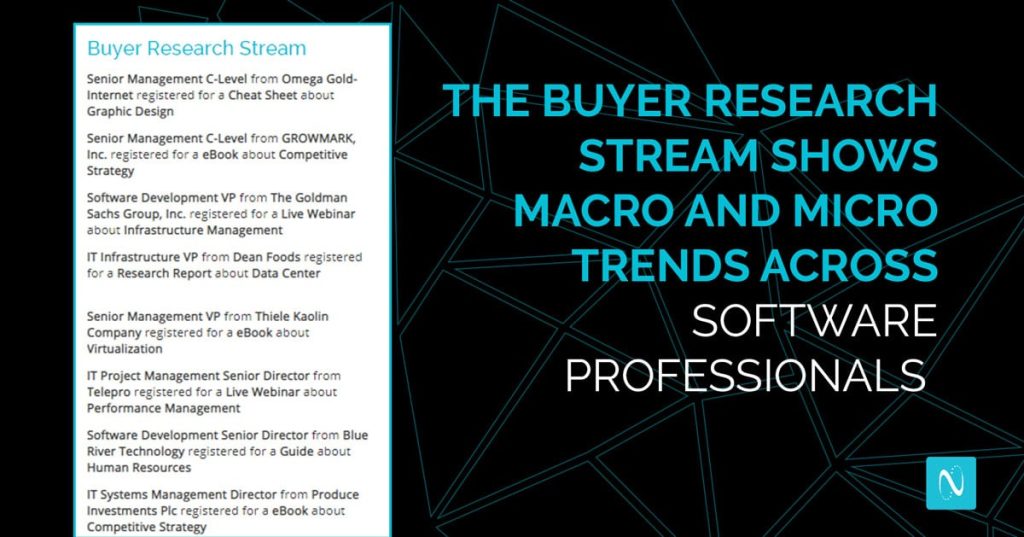
While it could be argued that Data Management was the most in-demand topic over the last 180 days, even that would be a stretch.
Truly, the Buyer Stream in this category covers a potpourri of subject matters, job levels, and industries. There’s nothing here that would lead us to one insight over another, aside from the one constant that exists in the IT/software field: there’s always something new to learn. Keep in mind that the Buyer Research Stream, just like all other components of Audience Explorer, are constantly updating and worthwhile revisiting on a frequent basis.
Slicing Up the Pie Charts
The most visual, and interactive, portion of Audience Explorer is the pie chart section. Here, content consumption data is broken down into 4 specific categories: Job Function, Job Level, Company Employee Size, and Company Industry.
Job Function
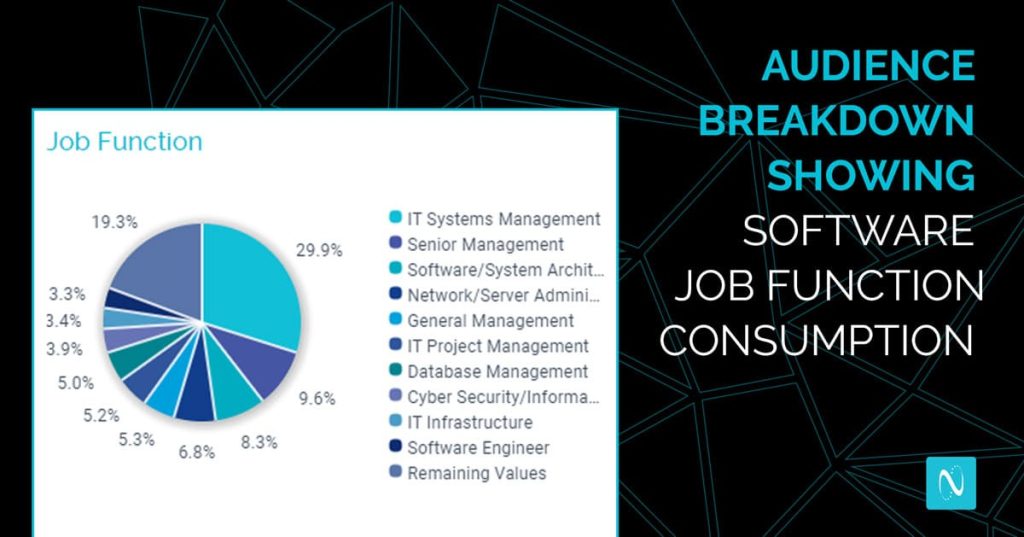
During this period of measurement, nearly 60% of content requests came from Software/System Architects with Software Developers and Engineers essentially splitting the remaining ~40%. When we further explore the interests of the Software/System Architects, Infrastructure Management remains at the top of the Trending Topics list, followed by Engineering and Intrusion Detection Systems, each of which move up two slots when the other job functions are included.
Job Level
The Job Level filter allows you to review which job titles/levels of seniority are interacting with content. In the Software industry, Individual Contributors (28.5%) and Senior Employees (27%) made up the majority of active consumers.
Because Senior Employees are responsible for shaping perception internally and literally influencing every purchase decision made within their organization, we decided to further explore their consumption behavior. An interesting detail to point out with this group comes from the Buyer Activity graph.
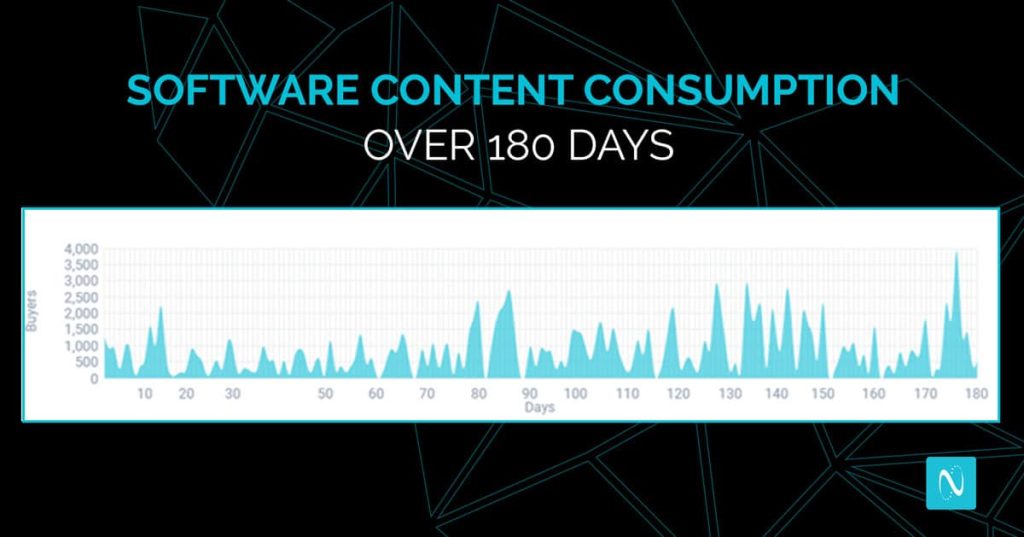
There was a sharp uptick in demand from Senior Employees, roughly 70-90 days ago. As of this writing, 90 days ago would be April 16, 2020 — the moment in time when American businesses began to realize that working from home would likely continue for quite some time.
This spike, along with the others seen around Day 130 and as recently as ~Day 175, reinforce what our CTO shared in his comments: businesses are preparing their systems for anything and everything. They don’t want to be caught off guard — not that they ever wanted to be.
Company Employee Size
When we look at the Company Employee Size chart, you’ll notice that 18.4% of the software developer audience is employed at businesses 50,000 or more employees.
As we review this pie chart, we’d suggest you also look at the Most Active In-Market Companies. Connecting these two pieces of information is natural, given the instant recognition many of the companies like Microsoft, AT&T, and IBM (2nd, 3rd, and 5th on this list, respectively) have. With these behemoths at the top, It’s easy to see why companies of 50,000+ hold nearly 20% of the consumption share for demand.
Company Industry
In an audience devoted to software development, it should come as no surprise that the majority (30%) of the professionals work for software oriented businesses (that is, their industry resides within the Computer and Technology space).
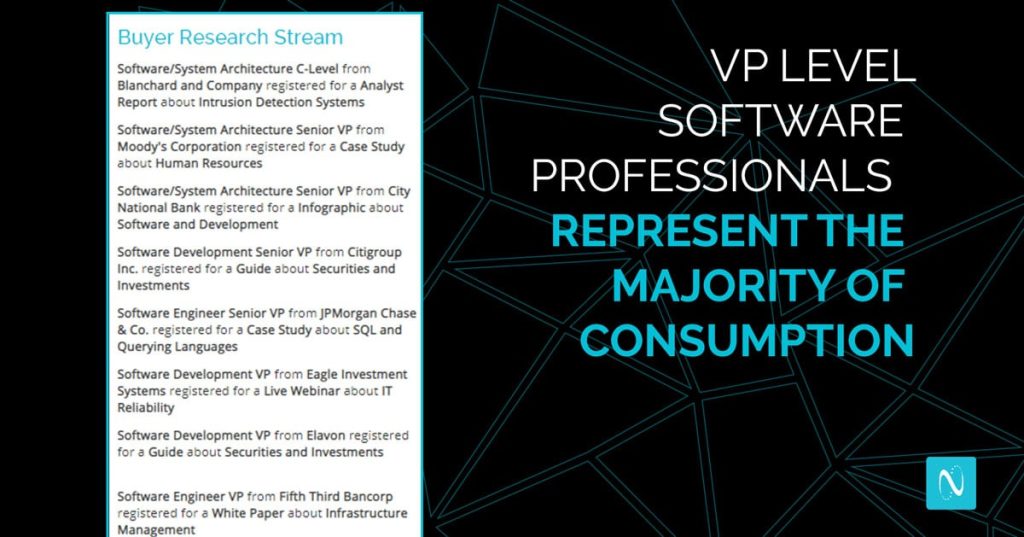
What’s most intriguing, however, is that the Finance/Accounting industry is the second most active audience, with the VP level representing an overwhelming majority of the activity from this group, per the Buyer Research Stream. Buyer Stream aside, Individual Contributors (the most engaged group across the general platform) lead the Job Level portion at roughly 26% with the VP level in 3rd at 15%. Still, having the context of what is being requested in real time provides additional sway to the VP level.
Which Type of Content is Requested Most?
Ebooks were the most consumed content type during the first 6 months of 2020, representing just over 50% of all requests.
White Papers and Guides lagged behind eBooks by a wide margin with Reports finishing in 5th. All in all, the only type of non-static content consumed by this audience were Live Webinars.
What’s the Takeaway?
When using Audience Explorer, it’s essential to remember what you already know about your buyer group. For example, we know that developers are infamous for looking for full pieces of code that have already been proven to work. This means they’re constantly looking for resources to answer questions (which are often fairly niche) that either leave them stumped or simply save them a ton of time. This could explain the popularity of ebooks and the like within this group.
We can’t make massive assumptions about our two largest Job Level groups (Senior Employees and Individual Contributors), but we can make an educated guess based on the information we’ve gathered. It’s also important to focus on the three other categories we haven’t filtered through to get a complete picture of who your buyer is and what they do.
The Buyer Research Stream is a terrific part of Audience Explorer that provides context to what buyers are actually doing and the companies these buyers represent. Looking at the content registrations of this audience you’ll notice two trending topic themes: general management-oriented resources and security-oriented resources. The management portion is a natural fit for the Senior Employee Job Level, while security-oriented content is applicable for both groups.
So, what does this mean?
Essentially: If you’re a business that provides data protection and/or management services in the United States, your most engaged audience is likely to be Senior Software/System Architecture working for businesses in the Computers and Technology industry with more than 50,000 employees.
With the information we’ve seen, it’s a safe bet that the employees we described above are likely to be responsible for problem-solving at their respective companies. The Buyer Research Stream supports this hypothesis.
How Your Business Can Capitalize
If your company provides coverage for either of these pain points, now would be a good time to produce an eBook or whitepaper — the two most consumed content formats in this industry no matter how you slice the data.
We are certainly in uncharted waters in 2020. If you’re looking to make a splash, we urge you to create well-researched content that appeals to your most profitable audience segments. It’s your best chance to generate new business in today’s turbulent market.
We’ll be back next month with another Audience Explorer breakdown of a brand-new audience. Let us know if there’s one you’d like to know more about!
By Jonathan Steiert, Content Marketing Manager at Netline.


Get a Free Consultation
for Content Marketing