In our last blog post, we discussed the importance of setting up eCommerce Google Analytics Tracking Reports if you run an online shop.
Google Analytics is such a robust platform it’s usually a good idea to have a plan of what you are trying to achieve before getting lost in all the numbers.
Ecommerce advanced reports can help you narrow down your reports so they better serve your marketing plan and help inform target goals you may have for your business such as a boost in sales, higher conversion rates, and increased traffic.
It can also show you where there may be roadblocks in your eCommerce conversion optimization and where customers are dropping off, abandoning carts, and taking a longer than desired time to convert.
GA’s Enhanced eCommerce reports give you a deeper insight into your analytics and are highly recommended for anyone serious about tracking performance.
How to Access Advanced Ecommerce Reports?
The advanced eCommerce reports can be accessed through the Google Analytics dashboard but you’ll need to first ensure that you are using Universal Analytics and that you have the ec.js plugin installed so that your site is tracked. Google’s support center does a good job of walking you through the steps here.
What Kind of Advanced Reports Can You Set Up for Your Online Shop?
1. Product Performance Report
The product performance report is great at monitoring how your products are doing from two different perspectives:
- Overall performance: tracks sales, product revenue, average quantity of units sold, average price, filtered by transaction ID or date.
- Shopping behaviors: track user engagement with your products ie: viewing products and details, adding and removing products from carts, completing checkouts etc.
2. Goal Flow Report
The goal flow report provides insight into the effectiveness of your path to sales. It shows you how well users are navigating your site to get toward your conversion goals. Are they accessing your homepage, then clicking the “purchase now” button, and is that the most common way they are making a purchase on your website, or are they funneling through in other ways? This is important because it shows you the path your customers take to get to your products. It will also identify which paths work and which don’t. This report will help you answer questions like:
- From which page on your website are your visitors entering your sales funnel?
- Where are visitors abandoning or coming across roadblocks on the path to a sale?
- Where are visitors looping back (clicking the back button) for more information?
3. User Flow Report
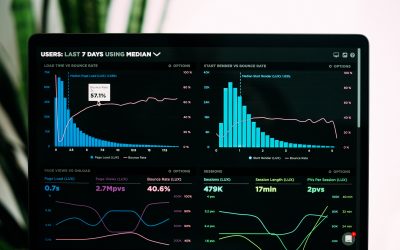
The user flow report tells you how many people are visitors to your website and what channels they are using to get there. The most important metric from this report is the “red waterfall” or red line on the graph that indicates where people abandon the site and whether or not users are clicking back and forth between pages. This report can also show you whether users are going from your homepage to your sales page, back to your homepage.
A user flow report can identify whether or not your traffic sources are funneling in from:
Social Media Outlets
Company Blog
Third-Party Sites
Email Campaigns
The user flow report also breaks down the pageview volume of the individual pages on your site and which pages are getting the most and least amount of traffic. This is helpful in identifying which pages are being visited the most and which pages could benefit from further optimization.
4. Goal Flow Report
- Very similar to the user flow report, the goal flow report tracks users’ steps on your website and throughout the purchasing process but a bit differently. This report is a bit more user friendly in its format, so it’s easier to identify important metrics like customer flow in and out of pages and it allows you to dig deeper into data by expanding the nodes on the graph.
Understanding the way a customer navigates your website is important because it highlights where there may be a roadblock in your process. If a user is going back to fix shipping information, enter a coupon code, or modify the order this may be an indicator that your user experience needs to improve.
5. Mobile Device Reports
The mobile device report will narrow down which phones people are using to access your site.
This can make it easier to focus on optimization and design efforts if you notice a large number of users are experiencing browsing issues, using a particular model.
Google Analytics provides a wealth of data, but it’s not always easy at a top-level to uncover roadblocks through your data and pinpoint important metrics that will help you optimize your website in line with how and when your customers are making purchases.
Of course, there are countless reports at your disposal. Identifying which report will be the most effective in improving your overall strategy is also helpful as well as creating custom reports that help inform your marketing plan.
Want more SEO news? Head over to our blog today!