
What is price elasticity?
Broadly speaking, an elasticity is the measure of sensitivity, as in the percent change of one variable compared to a change in a different variable. This measure of sensitivity can be applied to anything: the percent change in new coronavirus cases compared to a change in mask-wearing, the percent change of ice creams purchased with a change in temperature, and, yes, even pricing – the percent change in sales with the change in price. How does it work exactly? By the fundamental economic law of demand, as the price of a good increases, the quantity demanded of the good will decrease, but we want to measure how these changes impact the total revenue from the good.
Looking for a pricing tool? Learn more about our solution.
How do you calculate price elasticity?
Rather simply, the elasticity of price can be summed up by the following equation:
% Change in Quantity Demanded / % Change in Price = Price Elasticity of Demand (PED)
With this formula in mind, what does it mean when we calculate a price elasticity? For simplicity’s sake, we will discuss 2 cases in this elasticity ratio: elastic and inelastic. To start, elastic goods are those that see a larger percentage decrease in the quantity demanded than the increase in price. There are many examples of elastic goods, but the most common are basic foods such as bananas, bread, and chips. The types of goods that are very substitutable without differentiation. Think of goods that are seen as the same by consumers. A banana is a banana, a consumer will buy whichever is cheapest.
Meanwhile, inelastic goods are the inverse – goods that see a smaller percentage change in the quantity demanded than a change in price. Examples of inelastic goods include types of gasoline or medicines. Think of necessity type goods. Let’s say you rely on a certain type of medicine to go about your daily life, an increase in the price won’t change how much you need the medicine, meaning you’ll still purchase even as the price increases. As a company, you would hope every good would be inelastic, as a price increase would increase total revenue generation despite lowered sales.

Now that you have a better idea of an inelastic vs. elastic good, let’s take a look at what exactly the equation means for your product:
PED = 0: Perfectly Inelastic: This means price changes do not impact the demand of your product. You might see this scenario in our previously mentioned example of the required daily medicine. Demand remains the same no matter how much the price might increase.
PED < 1: Relatively Inelastic: This means price changes have a very small impact on the demand of your product. A good example of this is electricity or gasoline. These are necessary goods that offer little to no alternatives or substitutions. As these goods may not be as essential as the required daily medicine in our last example, the demand would not be perfectly inelastic.
PED = 1: Unit Elastic Demand: This means price changes have an equal impact on the demand of your product. For example, if a juice company raises the price of their juice by 5%, they would see a 5% decrease in demand.
PED > 1: Relatively Elastic Demand: This means the demand change of your product is greater than the price change. Think back to our example of the banana. If you begin charging more for your bananas, many consumers may stop purchasing bananas or purchase from an alternative, more affordable brand.
Now, how do we measure and calculate an elasticity? Much like many measurements in the econometric world, elasticities are estimated using a multilinear regression where we are attempting to explain changes in sales as a result of changes in prices. Many factors can go into this regression, including promotions, seasonal changes, or even external factors like coronavirus, but the core of the analysis is centered around this pricing data.
To find these results, a time series regression is run with data typically at a weekly cadence that tracks sales, prices, and these other factors. Because we are measuring the change in sales relative to the change in price, we use a log-log regression where we apply a transformation of the logarithmic scale to all the data and run a regression on this logged data. From this regression, we can estimate the effect and generate coefficients. These coefficients in the log-log model are, in fact, elasticities, so this equation estimates the effect of the change in sales to the change in the explanatory variable being described.
What software/tools can you use to calculate price elasticities?
Many different tools can be used to calculate elasticities, but here’s an example of our solution, priceQED. Below, you’ll see a basic example where we are calculating the price elasticities of different products. This is a mock example of sodas. What we can see here is all the elasticities are negative but comparable.
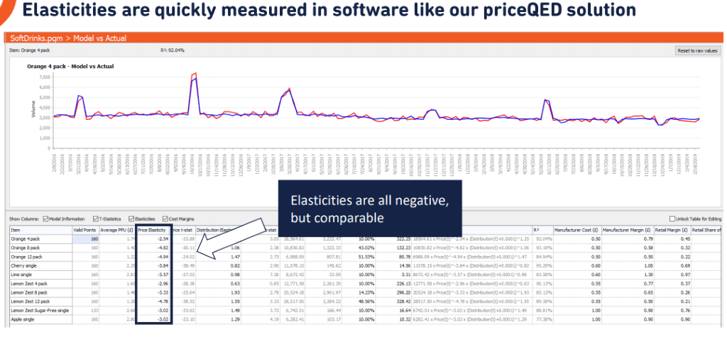
If we go back to the law of demand, price increases lead to decreases in quantity demanded. So, an increase in prices leads to negative volume. But these elasticities are also comparative. If you look at the orange 4-pack, it has an elasticity of –2.54 and because it’s on the exact same scale as the other products listed, you can compare the orange 4-pack to the orange 8-pack listed just below. This means we can say that the orange 4 pack at –2.54 is less elastic relative to the orange 8-pack at –4.82 and the orange 12-pack at –4.94. The idea here is that the elasticities can be compared across individual products and because we are expecting that an increase in price will lead to a decrease in sales, they will always be negative.
Price elasticity and your competitors
It’s not just the price of your own products you need to worry about. Elasticities provide a great opportunity to compare our product with the entire marketplace. This means they can help us find our place in the competitive space. But how do we do that? We should ask the following questions to better understand the competitive landscape and find out how price elasticities will be of most use.
To start, what are competitors doing? What kind of promotions are they running? What kind of pricing strategies are they executing?
To answer these, we must ask, how can we measure competitor sales and pricing strategies? This one can be a bit tricky depending on the industry. For many consumer-packaged-goods companies, you can use scanning data to help answer this question. So, third party companies will scan data and allow you to look at the sales and pricing strategies of your competitors.
Also, dependent on the industry, you might be able to use governmental data. But the point here is, while this isn’t any groundbreaking revelation, searching for industry-specific data sources is imperative for measuring this strategy. Competitor activity is essential to knowing your optimal price, so let’s discuss what’s needed for that.
.png?width=600&name=Untitled%20design%20(24).png)
First, for us to understand how we can approach the entire marketplace and find these optimal prices, we will want to know how the effect of a price change of another product affects the quantity demanded of our product. Like the price elasticities that we looked at previously, the cross-price elasticities are calculated in the same manner, so by taking the percentage change in the quantity demanded of one good and dividing it by the percentage change in the price of the other good. The cross-price elasticity is a flexible metric that will allow us to compare price changes on all products in the competitive space, determine your brand’s perception in the marketplace, and measure cannibalization.
Using cross-price elasticities, we can find goods that are substitutable, meaning consumers find these products similar and can switch between them depending on the price. Cross-price elasticities also allow you to gauge what proportion of incremental volume is actually incremental, or just taken from competitors. The worry here is volume taken from a competitor can easily be taken back, so knowing where your substitutability lies is an important aspect of your pricing strategy.
Let’s take a closer look at the substitutability of products and how you can measure your brand’s perception using cross-price elasticities.
If you look at the chart below, you’ll see an example of product substitutability. On the x-axis of the graph, you’ll find the price elasticity, starting with elastic and going to inelastic. On the y-axis, you’ll find substitutability, ranging from unique to highly substitutable.
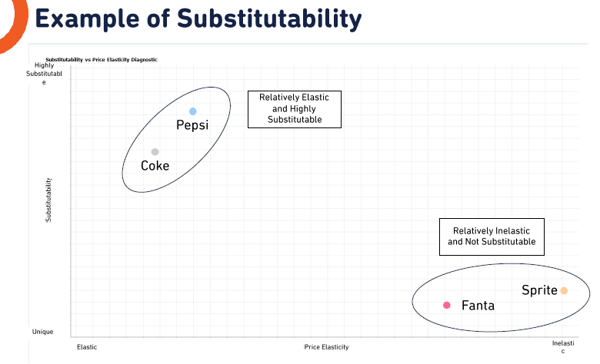
For this example, we used Pepsi vs. Coke and Fanta vs. Sprite (not real data). You find Pepsi and Coke in the upper left corner of the graph, meaning they are relatively elastic and highly substitutable. Consumers of these products are very price sensitive to them and any change in pricing will have a large impact on the category as a whole. If the price of Pepsi increases, the quantity demanded for Coke increases as consumers switch over to less expensive but substitutable products. But, if you look at Sprite and Fanta as the example, you’ll see the exact opposite results. Any price change in Sprite will lead to overall profitability going up and which won’t be coming from Fanta consumers, but from brand-new consumers. It can also be interesting to note, that generally speaking, brands that are relatively elastic and highly substitutable, like Pepsi and Coke in our example, work in conjunction with one another, while brands that are relatively inelastic and not substitutable would not.
Cross-price elasticities also allow you to measure brand perception, without having to conduct survey studies or other types of analytics. If you were to calculate a cross-price elasticity to determine how substitutable your product is against alternatives you’re able to measure how loyal your consumers are.
If you have low substitutability, then you can conclude that you have a highly loyal consumer base. Meaning, an increase in the price of your product may not have an adverse volume decline. So, you may be able to increase your prices and maximize your profit because you know that your product is perceived as a better option in the marketplace compared to others available.
Conclusion
Learning to price your product is the key that unlocks a multitude of important factors for your business. Although calculating your elasticities can seem complex at first, learning how allows you to maximize revenue, better understand your competitors and get the most out of your data. We hope that our breakdown of price elasticity and its benefits gave you a deeper understanding of the topic.
If you are still looking for more pricing content, check out our webinar--Price Optimization in Revenue Optimization where we covered price elasticities in periods of high demand and shortages, price shocks, setting your optimal price, and more. Access the recording of our Price Optimization for Revenue Optimization webinar here.
Or learn more about our pricing software – priceQED here:

-1.png)
.png)