A/B Testing Statistics: Why Statistics Matter in Experimentation
A Quick Guide to Statistics and A/B Testing: The Terms You Need To Know
It is nearly impossible to conduct a reasonable A/B testing experiment without having a grip on statistics.
While a platform like Convert Experiences can take care of all the statistical measuring, reasoning, and analysis for you, having a basic understanding of some statistical terms will certainly help you.
Let’s start with the basics.
Sample and Population
Using all of your website’s traffic for A/B testing would, in theory, give you a general idea of your population. However, this can be a sub-optimal use of resources as the population in its entirety is impossible to capture. This is where samples come in handy. While there are different methods of sampling, using a random sampling approach helps ensure there are no inherent biases in sample selection. This approach is inspired by the pharmacy-medical practice of Randomized Controlled Trials.
Mean, Median, and Mode
In the simplest terms, mean stands for the average, median stands for the values situated in the middle when all the numbers are aligned linearly (the 50th percentile in the distribution), and mode is the most repeated value. These three terms come in handy when you are going through the summary statistics of an A/B test.
Variance and Standard Deviation
These are very important concepts that measure the dispersion in the data points. In other words, how far the data is from the mean. The Standard Deviation is the square root of the Variance. This is why the Standard Deviation is a better judge of dispersion as it holds the same unit of measurement as the mean. For example, the average height of adult men in the US is 70 inches with a Standard Deviation of 3 inches. If we were to use Variance in this example, the value would be 9 inches squared, so it’s less intuitive. Think of the Standard Deviation as the “usual” deviation of the data.
Null and Alternate Hypothesis
A Null Hypothesis appeals to the status quo. Your Null Hypothesis would state that any change you have observed in the data, for example, the lift, is because of sheer randomness. An Alternate Hypothesis would be that the change is not random, but that it indicates a causal effect, meaning your changes did have an impact on your users.
For instance, assume that you are trying to flesh out the best headline for your landing page. You have a control variant and an alternative variant. You run an A/B test and get different conversion rates for both, so there is a lift (positive or negative). The Null Hypothesis here would be that the difference is due to randomness. The Alternate Hypothesis would state that the change is attributable to a certain variant.
When running an A/B test, you will get one of the following four outcomes:
- You reject the Null Hypothesis.
- You fail to reject the Null Hypothesis.
- You falsely reject the Null Hypothesis.
- You falsely fail to reject the Null Hypothesis.
Ideally, outcomes a and b should be the ones to aim for since those are the scenarios you can learn something from. This is how you can make your product better and ultimately increase your bottom line. Outcomes c and d correspond to the errors below.
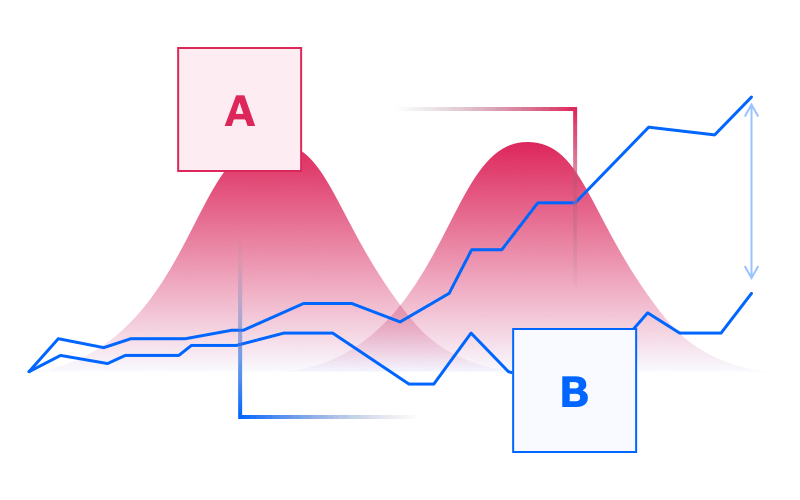
Type I and Type II Errors
The last two options in the possible outcomes of your A/B test are Type I and Type II errors, a.k.a false positives and false negatives.
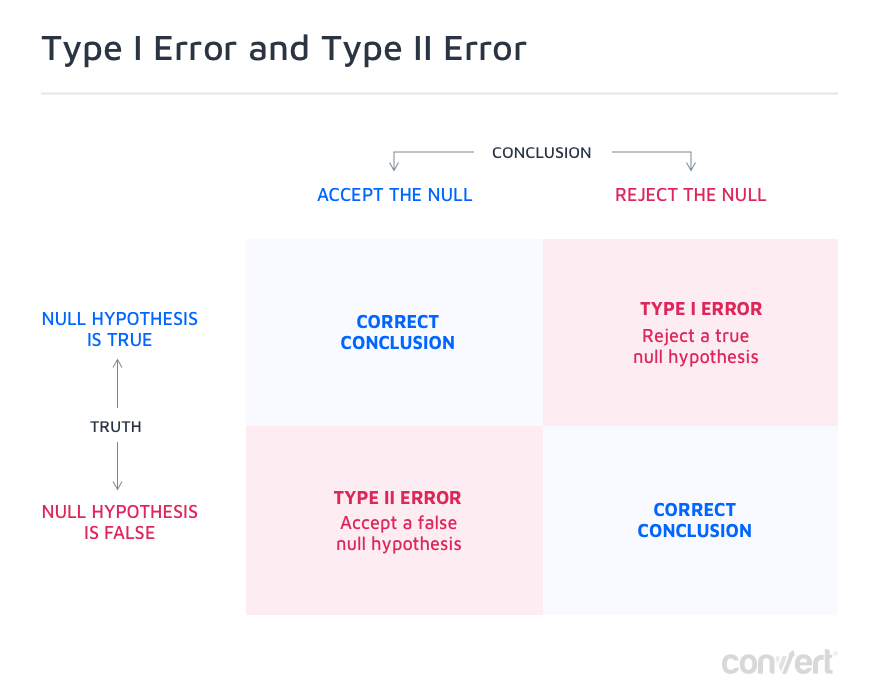
A type I error is when you falsely reject a true Null Hypothesis. Meaning, the change you observed was due to chance but you concluded otherwise, so it’s a false positive. In most cases, all that is required to diminish false positives is to increase the confidence level required to reach statistical significance. This is usually set to 95%, but for mission-critical experiments, you might want to set it to 99% confidence, which will reduce the chances of making such an error to only 1%.
Type II errors are the exact opposite. Here, you fail to reject a false Null Hypothesis. This means that there was a real impact, positive or negative, on the conversion rate, but it did not appear to be statistically significant, and you falsely declared that it was due to random chance. Most often than not, this is due to a lack of statistical power.
In statistical power parlance, the Greek letter α represents Type I errors and β represents Type II errors. It is easy to get confused between statistical power and statistical significance.
This table makes it clear:
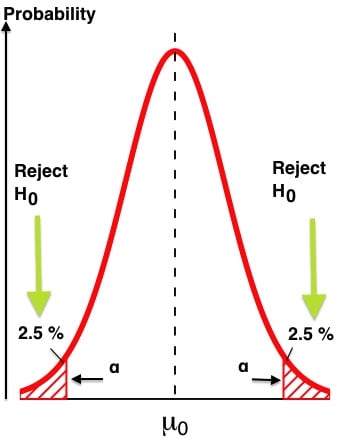
Statistical Confidence
The more visitors your test gets, the more your Statistical Confidence increases, until it reaches 99% if you let it run long enough. But usually, unless mission-critical, a 95% confidence level is considered good enough for most A/B tests (it ensures that the chance of making a false positive i.e. Type I error is 5% at most).
Statistical Power
Statistical power pertains to the probability of detecting an effect when there is one.
Statistical Power and Statistical Confidence are related concepts that work together to measure the evolution of an A/B test. Ideally, both should pass threshold values before ending the test (more on this below).
Confidence Interval and Margin of Error
Generally, the output of your A/B testing experiment would be something like ‘Conversion rate is 3% +/- 1%’. In this statement, the ‘1%’ represents your margin of error. In short, this is the deviation in conversion results that is reasonable to keep the test results acceptable. The smaller the margin of error, the more reliable your test results become. As you increase your sample size, you will notice the margin of error going down.
If you run A/B tests with Convert Experiences, you get access to the Experience Report that details variation, conversion rate, improvement, confidence, and conversions upon unique monthly visitors. You should attain at least 97% confidence to declare a winner. By default, the Convert platform has been optimized to start reporting the analytics of the experiment only after five conversions have been attained. To ensure the reliability of the tests, Convert uses two-tailed Z-Tests.
At the beginning of your experiment, if one of the variants is performing significantly better, you should still continue with the stipulated duration of the test. Early results might be caused by noise or randomness.
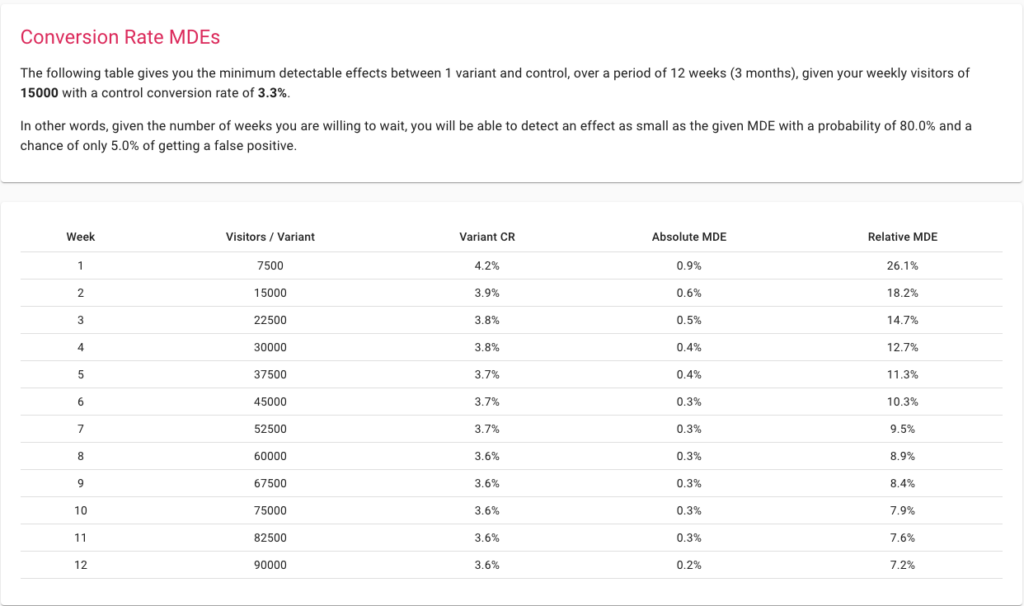
Minimum Detectable Effects
MDE is the minimum lift to achieve, above which the change becomes worth implementing. Preparing for a test by choosing a low MDE allows your experiment to capture more granular changes. Setting a higher MDE means that your experiment can detect only major changes and hence work even with smaller sample sizes. The catch here is that making a drastic change to generate a big enough lift, in most cases, won’t be possible unless your website has never been optimized before.
The best way to think about MDE is to use our sample size calculator. Start by inputting your weekly traffic and conversions and see what is achievable over a period of time.
P-Value
Cassie Kozyrkov, Google’s Chief Decision Scientist coined a very simple definition to explain P-Value: “The lower the p-value, the more ridiculous the null hypothesis looks!”
What is P-value in A/B testing?
P-value is defined as the probability of observing an outcome as extreme or more extreme than the one observed, assuming that the null hypothesis is true. Hence, the p-value is a mathematical device to check the validity of the null hypothesis. The smaller the p-value, the surer we are that we should reject the null hypothesis.
The way we use it is by comparing it to the significance level. Say we have a significance level of 5%, that directly corresponds to a confidence level of 95%, then as soon as the p-value becomes inferior to 5/100 = 0.05, we can say that our test has reached statistical significance and we can reject the null hypothesis.
If we want to be even more sure, we set our significance level to 1% and then wait for the p-value to drop below 0.01. That would equate to 99% confidence in our results.
Traffic Distribution
Traffic Distribution helps allocate a certain percentage of traffic to the experiment. Assume that you have 100 visitors to your website every month. From this, you can choose to allocate 30% of the traffic to the experiment. By default, each variant in your A/B test will receive an equal share of the traffic. So, if you have two variants, each one will get 15% of the traffic.
Using Convert Experiences helps you configure this traffic allocation in a few clicks. As your experimentation process evolves, you can create more variants and optimize the allocation to fit your needs.
How Can Statistics Help in A/B Testing?
Why Can’t You Just Compare the Performance of Variant A and B?
Running an A/B testing experiment using even a convenient platform like Convert Experiences requires some resources in terms of time and energy. Then, wouldn’t it make sense to just create two variants, measure their respective conversion rates, and choose the one with better performance?
While it sounds pragmatic and resourceful, it can lead to wrong conclusions and even misinterpreted results, as no statistical tests were run on the data. So observing a change is not enough, one must know how long to wait to be sure of that change, and for that, one has to perform a statistical test like a Z-test, T-test, or G-test.
Looking at the lift or effect size alone will not help you:
a. Determine the Probable Causal Factors Associated with the Winning of One Variant
An A/B test, by design, would constrain you to choose two variants that only have some material differences. For a larger set of differences, you would generally go for a more extensive multivariate test.
A/B testing operates on the rule that, right from the outset, you know the dependent and independent variables in the experiment. For instance, if you create two sets with different CTAs put in the same layout, you know the difference in the CTAs is the causal factor if you can refute the hypothesis and see a change in conversions.
If you simply run two entirely different variants, even if you get relatively better traction on one, it would not help you get insights on your audience or determine why it works.
b. Differentiate Between Randomness and Causality
The structure of an A/B test would require a Null Hypothesis and an Alternate Hypothesis. The Null Hypothesis would generally delve around randomness being the causal factor and not the efficacy of one of your variants, in determining the conversion rates. A Null Hypothesis is not refuted when statistical significance is not reached in time, and any subsequent variability is assumed to be the result of randomness. On the other hand, if you can reject the Null Hypothesis, it means there is a high probability (at the set level of confidence, e.g. 95% or 99%) that you have discovered a causal factor with a positive or negative impact on the conversions.
c. Allocate Costs to Only the Changes with Higher Probability of Improved Conversions
The A/B tests conducted would also come with statistical measures like significance levels, confidence intervals, and margins of errors. Such analytical concepts don’t exist in most ad-hoc analyses.
Take, for instance, a comparison between two form-submission pages with some material differences in information layout and display. One performs relatively better than the other one. Now, how do you determine that you will be able to replicate the results? Since you do not have any data that shows how significant the experiment’s results were, there is no way to judge whether the experiment’s results can be replicated or not.
Evaluating and Eliminating Your Exposure to Type I and Type II Errors for A/B Testing
Type I errors (a true Null Hypothesis gets rejected or a false positive) and Type II errors (a false Null Hypothesis is not rejected or a false negative) can have serious consequences on the market assets you are optimizing with A/B testing.
No tool can explicitly show you a Type I or Type II error, but it can help you minimize them, for instance, by making sure that a confidence level of 95% or more is reached, and statistical power has reached at least 80%
Assume that you make two variants of the final page in your purchase cycle, show it to about 10,000 visitors over 10 days, and get the results. You see better performance for one variant and hence apply it on your Ecommerce website.
The problem here is that you will get to know about a Type I or Type II error in your A/B testing experiment after you fail to replicate the results of your experiment in reality. There are better ways to ensure you do not have Type I and Type II errors in your A/B test.
First, make sure your sample size is big enough to ensure sound statistical experimenting. You can use Convert’s calculator to get the right sample size.
Then, make sure you have a significance level of at least 95% and do not stop the test until your power has reached 80%. With the right MDE and length of the experiment given by the calculator, you can be virtually assured of controlling Type I or Type II errors. The former is directly influenceable by the significance level you set, and the second by the statistical power you are willing to live with. Ideally, your confidence level should be superior or equal to 95% and your statistical power should have accumulated to at least 80%. In both cases, the more the better. If both parameters reach 99%, it ensures that the risk of Type I or II errors is well controlled and inferior to 1%.
Both discovery and elimination of such issues are possible only because of statistical thinking on which A/B testing operates.
Determining Whether Your A/B Testing Experiment Is Scalable or Not
In the example above, even if you see one variant win over its alternative over a month, you would not be able to scale your experiment easily. This is because the sample size of 10,000 visitors was quite small.
A/B testing statistics give you many heuristic guides to ensure your test is scalable and so are its results. Each A/B testing experiment’s outputs will pave the way for more tests in the future.
First, begin with ensuring you have sufficient traffic coming in every month to test any variant of your platform’s UI or UX elements. Experts at Convert recommend traffic of at least 10,000 visitors and 1,000 conversions on each variant to have statistically sound results. Once you have these, make sure you are not testing several elements at once, are allowing the test to run for a considerable duration, and can reach a reasonable level of significance.
If you have a small set of visitors, you can still conduct A/B testing on email campaigns, social media campaigns, and even Google Ad Groups. Or, you can opt for a high MDE to get some broad insights about your audience.
Making Experiments Cost-Effective
Allocating any percentage of your traffic for an A/B test is a cost. You are showing a possibly sub-optimal page or UX element to your audience and hence might be losing out on some potential revenue. While the A/B test will give you a definitive idea to scale a more optimized element or page which can recoup these lost probable revenues, this cost can be used as a constraint to optimize your testing process.
After conducting an A/B test, you may move on to an A/B/n test where you will have several more variants to be tested.
Many free calculators available online would show you the sample size you need for accurate results out of this test. These calculators run on a simplistic assumption – calculate the sample size for an A/B test and then multiply it with the number of variants with the experiment. This is an inefficient way to proceed. Our calculator offers efficient multiple comparison correction options like Šídák, so always use the right tools at every step of your experimentation to ensure you get the necessary results without shedding the extra dollars incurred from miscalculations.
Start planning your tests with Convert’s A/B Testing Calculator
Estimating and Controlling Randomness in Your Sample
While there are several complex mathematical principles of randomness, most of them indicate the same characteristic – unpredictability.
Randomness can be perceived as the opposite of clearly defined causality. Instead of knowing what elements were responsible for the higher conversion, you have to rely on some undefined external factors as the probable causal factors for the results. Since you do not control these external factors, you cannot replicate your test results at scale.
If you are not using a statistically sound A/B testing process, you would not bother to examine the impact of randomness. But, the randomness will still exist. You may end up deploying capital on a marketing asset that converts during the test but does not work at scale. Worse, you may end up diluting the impact of your existing conversion funnel.
A/B testing statistics can help you solve this issue. When you formulate a hypothesis, you are creating a scenario where randomness might be the reason for the changed results. If you can refute this scenario, you have in essence refuted randomness as the cause of better conversions. With more tests ahead in the process focusing on other areas in the conversion funnel, you can further eliminate the space for randomness in the conversion optimization process.
The ideal would be to define an Overall Evaluation Criterion (OEC) with one main metric and other guardrail metrics and run experiments to optimize the former while making sure that the latter ones do not degrade. For instance, you want to increase conversion rates (primary metric), but don’t want user engagement to decrease, because that would indicate unsatisfied clients.
A great book, probably the most important book on experimentation to date, is Trustworthy Online Controlled Experiments: A Practical Guide to A/B Testing, by Ron Kohavi, Diane Tang, Ya Xu.
Ensuring That You Don’t Need a More Comprehensive Multivariate Test
Comprehensive tools like Convert Experiences can help you run multiple A/B tests. While this may sound like a trivial functionality, it can help you understand whether you need a more comprehensive multivariate test or if the results of your A/B test are satisfying enough.
All of this depends on what you do right after you have understood the results of the test. Do you start deploying the winning page or element or do you go for further testing? If your sample size, level of significance, and MDE are satisfactory, you can usually deploy the winning alternative. If you are on the other side, you can use further testing to find the cause of the different conversion rates.
For example, assume that you are testing whether having a certain CTA on your landing page is helping with better conversions or not. You run your A/B test and have a clear winner. But, some statistical measures like the level of significance are not satisfied. So, you take the winning variant and create another variant to conduct another A/B test.
If the results are replicated, you can have higher confidence in the winning variant. If you are unable to replicate the conversion levels of the first test, you might need a multivariate test to find the element responsible for the lift in the conversions.
A/B Testing Can Help You Avoid Dependence on Self-Reported Data
Even the smallest of variables can have a major impact on the detected user behavior. For instance, the flickering effect has a considerable impact on conversion rates. Flickering is the situation where your default landing page is shown before your variant page when a visitor is a part of your sample traffic being used for A/B testing. This can lead to polluted results – even when you are running an analytically consistent process.
When there can be possible issues with statistical and analytical processes like A/B testing, running a self-reported process can only lead to more suboptimal or even false results. Self-reporting processes are often polluted by several biases and noisy data as the entire responsibility of remembering preferences and reporting them is left on the user, who does not have any incentive to be honest. Plus, there are ordering biases and other external factors that can lead to faulty data.
A/B testing puts you in the observing chair and eliminates the need for any form of user reporting. With tools like Convert, you don’t even have to worry about flickering.
Making Organizational Decision-Making Data-Driven
An A/B testing experiment leaves no space for guesswork in the process. At every step, your testing platform is collecting observations, recording data, and performing analysis. This way, irrespective of your superiors’ or investors’ or agencies’ preferences, the results you get would be data-driven.
When there are several stakeholders involved in the process, it is easy for the end result to be suboptimal. A/B testing is an analytical process, which eliminates the space for any such hierarchical decision-making or biased thinking.
For instance, your agency may recommend a UI overhaul for your landing page because it will add to their billables for the month and if done properly, might not even hamper your conversions. However, with an A/B test, if your Null Hypothesis stays strong, you would know for a fact that no such changes are necessary for the time being. Since you have the data to back your reasoning, you do not have to succumb to posturing even to leadership in your firm. This can also help you fight HiPPO (Highest Paid Person’s Opinion). The data doesn’t lie and an A/B test is the best proof you have at your disposal.
Understanding the Experiment Results with Transparent Calculations
Understanding the results of your A/B test is almost as important as running a statistically rigorous test. Any tool can run the test, compare the alternatives, and throw a winner at you. What you need is an indication of a causal relationship. While the statistical measures can highlight this, Convert Experiences has been designed for transparency in calculations.
The platform has 99.99% uptime, allows over 90 third-party integrations, permits third-party goal tracking, and supports code and error checks. This way, by the end of the testing process, you will have a clear idea of which element is the winner, why is it more preferable, and whether you need more testing to be more confident about scaling it.
Putting A/B Statistics to Use to Move Towards CRO Maturity
What is CRO Maturity and How Can Statistically Sound A/B Testing Help You Get There?
While Conversion Rate Optimization may seem to be an isolated way of thinking, it requires process-based changes across the company trying to become more focused on conversions. The challenge is that CRO is a relatively new field. In a 2018 survey, close to 62% of marketers had been working in CRO for less than 4 years.
A CRO specialist from Shopify created a hierarchy of how firms tend to transcend towards CRO maturity. As you delve into this hierarchy, you will discover how sound statistical experimentation is critical to evolving your organizational processes:
1. Conducting Qualitative & Quantitative Research to Identify Suboptimal Touchpoints
Your Google Analytics dashboard will often help you explore the pages or touchpoints in the consumer experience that require immediate attention. Solving for a specific problem like high bounce rates on the home page, abandoned carts, incomplete form-filling, and skipping email subscriptions can be used as the starting point for optimizing the conversion funnel.
2. Formulating Testing and Experimenting Ideas Based on The Earlier Performed Research
A/B testing statistics can help you understand the benchmark performance for your website and even competition. You can use this to understand which elements are lagging and start A/B testing variants that can perform better.
3. Running Testing and Experimenting Ideas with Highest Priorities
When you are setting up your A/B testing ideas in Convert Experiences, you will set metrics like MDE. Such metrics will help you prioritize tests that will have the maximum impact on your business, concerning the resource-allocation necessary to run the experiment.
4. Analyzing and Recording Test Results
After you have conducted the test, it becomes critical to understand why you got the results you are seeing. This is where platforms like Convert Experiences can help you filter between randomness and high-probability causality. With its transparent calculations, Convert Experiences will help you understand why your winning variant performs better.
5. Creating Follow-up Tests
Once you have conducted the A/B tests and attained the results, you can move on to more comprehensive multivariate tests or conduct an A/B test with another variant. Convert makes it easy to conduct a varied set of statistical tests that can help you increase your confidence in backing the winning variant.
The CRO Maturity Model focuses on a holistic process across a firm’s Strategy & Culture, Tools & Technology, People & Skills, and Process & Methodology where the progress of the enterprise is tracked across levels of maturity like – Beginner, Aspiring, Progressive, Strategic, and Transformative.
Convert Experiences brings rigorous data analysis to your A/B testing process, does not require coding for conducting the tests, provides visually and analytically accessible results, and is transparent about test results. With the platform at the center of your A/B testing plans, your enterprise CRO Maturity can move towards the Transformative stages with greater ease.
A/B Testing in Action: Benchmarked Case Studies
1. Using Google Analytics and Convert Experiences for Hypothesis Generation
Google Analytics can be a great starting point to understand the potential areas of improvement across your website. Sudden fall in traffic, high bounce rates in comparison to page-times, etc. can be strong indicators of potential issues.
Map out all the challenges you see across your Google Analytics reports. Parallel to this, run a qualitative survey on your website, social media handles, and email campaigns asking your audiences what they are looking for. In addition to this, you can use Hotjar to understand how visitors are navigating the elements on each page.
Based on all this data, you can then create insightful variants and run A/B tests. If you’re already using Convert Experiences, you can also use the Convert Compass hypothesis generation tool to further expedite the process.
2. Augmenting Conversions from Abandoned Carts through A/B Testing
Abandoned carts are expensive for your website and quite inconvenient for your visitors since both of you have invested significant time and resources in coming to this point but the conversion did not work out.
Using Convert Experiences integrated with other platforms, you can formulate a structured approach to tackle this challenge.
- First, begin with integrating Convert Experiences to your Shopify, WooCommerce, PrestaShop, BigCommerce, or any other eCommerce platform you are using.
- Then, use Google Analytics to set up goals on your platforms and use tools like Hotjar or Crazy Egg to evaluate the possible issue.
- With Convert Experiences, you can use this data, formulate hypotheses, and run A/B tests in an organized manner. Customers have observed a revenue increase of over 26% using a similar approach.
Convert Experiences integrates with well over 100 tools. Check out our database to find if we integrate with the tools in your current tech stack. If we don’t, drop us a message and we’ll build it!
3. Landing Page Optimization
Landing pages are quite central to the entire conversion process. To extract maximum value from your landing pages, you can use a variety of tools like Google Analytics, Adobe Analytics, Kissmetrics, Baidu Analytics, or other leading tools for the use-case. Convert Experiences integrates seamlessly with these platforms to help you filter low-conversion landing pages.
Next, you can use the Hotjar and Convert integration to understand what elements of your page are not working. With advanced tools like heat maps, you can get a visual understanding of how the visitors are accessing the different elements on your page. Past this, you can use Convert Compass to generate hypotheses and then run tests on the platform.
After you have conducted your test, you can use the integration between Convert and leading landing-page building platforms like LanderApp, Instapage, or Hubspot CMS. These integrations will help you run easy A/B testing experiments across your landing pages.
Using the same workflow, CRO experts have found conversion increments of 27% with add to cart rates going up by 13%.
Achieving Higher ROI with ‘Hygienic’ A/B Testing
- Website Traffic Threshold: Convert recommends that you have traffic of at least 10,000 visitors and conversions ranging above 1,000 available to each variant being tested.
- Using the Right Tool for A/B Testing: Not having the right testing platform can give you polluted results, make you run suboptimal tests, or cause severe constraints on your resources. Convert Experiences has been designed to eliminate these key parameters while ensuring the testing process is accessible, transparent, and seamless.
You can now run tests in Convert Experiences for free for up to 15 days. You will get a clear idea of what a seamless, flicker-free, and transparent platform that integrates with your other conversion analytics tools feels like.
- Defining Testing Goals: Your goals as a business have to be aligned. For instance – while you are optimizing for maximum sign-ups, some other units in your team should not be optimizing the consequent processes for maximum sales. Incoherent UX can do more damage than a sub-optimal UX.
Hence, maintain uniformity of goals among the entire set of team members. At the testing level, make sure you define the sample size, duration, statistical significance, hypothesis, and MDE clearly before, during, and after running your A/B test.
- Excluding Internal Traffic: When you are running an A/B test, many of your team members would visit the pages or points in the customer journey to objectively assess the page. This can bring noise to your testing results.
Convert Experiences has been designed to filter such traffic and focus only on the audience segments you have defined, for recording, aggregating, and analyzing data in the A/B testing process.
Final Thoughts on A/B Testing Statistics
A/B testing is a rigorous analytical exercise that can be run only with statistical rigor. Without the statistics built in the process, A/B testing is pure guesswork.
Convert Experiences makes it possible for you to have streamlined, accessible, reliable, and yet resource-efficient A/B testing experiments. While the process of A/B testing can seem a little overwhelming at first, it certainly unlocks value in the form of the right insight and analytical proven ideas it gives you. Make sure you never run an A/B test in isolation – it has to be followed up with more tests, and even multivariate tests.
With consistent optimization and unlimited tests made available by Convert Experiences, you can expect your enterprise to become a more analytical and data-driven operation in no time.