Adding Brand Health metrics to your Marketing Mix Models
Marketing Mix Modeling (MMM) is frequently conducted on metrics such as sales, footfall, or sign-ups. However, it is not always possible to measure the impact of advertising on your chosen Key Performance Indicator (KPI). This can be because the impact is too small to measure, it is crowded out by other activities, or because there is a long- time- lag between someone seeing an advertisement and making a purchase. Sometimes these impacts can be easier to determine when looking at a different KPI, one that is earlier in the customer journey, such as brand awareness or ad awareness. By analyzing brand health metrics, you might learn that the latest media campaign increased brand awareness by 5% points and consideration by 2% points – but what does this mean? Is that a good result? How much is a 1% point increase in a brand health metric actually worth in terms of revenue and profit? By connecting the dots between the brand health metrics and one or more KPIs further down the funnel, you can start to establish the return on investment (ROI) for more activities. This also provides additional insights into the customer journey, especially for products with a long path to purchase, while giving you a more accurate view of the financial returns for your marketing activities.

New insights for your Marketing Mix Models
When you add brand metrics to your Marketing Mix Models, you unlock a world of new insights. For example, by linking together the various metrics for a brand, you can gain a greater understanding of the steps on the customer journey and how marketing activities work together. This methodology will also help you avoid over-attributing the impact of those activities that are easier to measure when looking at sales and under-estimating the impact of those activities that have most of their impact higher up in the funnel. This can be particularly useful for products that have a long path to purchase; it can help track the impact of advertising through the various brand health metrics all the way to sales.
Effectively adding metrics to your models
Now that you better understand the “why” behind adding brand health metrics to your Marketing Mix Models, it’s time to cover what tools you’ll need to do it effectively.
Let’s begin with tracking data. A lot of quantitative research is conducted monthly or just pre-and post-marketing campaigns. To be able to incorporate tracking data into your Marketing Mix Models, you need to have it collected on a consistent basis. Marketing Mix Models are typically created at the weekly or daily level to make use of the daily/weekly variation in marketing activities and the related KPIs. Ideally, the brand health data should be available at the same frequency as the other KPIs used for the MMM. There are also some brand tracking surveys, such as the YouGov Brand Index, which are conducted regularly, making them ideal for use in Marketing Mix Modeling. In the case of the YouGov Brand Index, the data is collected daily, across a large number of brands and markets.

It’s also not enough to have surface-level data you’ll need more detailed insights. Although 20% of businesses use spreadsheets as the principal method of daily data communication (Forbes, 2016), they fall short when it comes to visualizing and reporting your data. You often must choose between including all data, thus making it so big and complex that no one can actually read it, or simplifying it and losing valuable information. Either way, insights are lost, and that hinders your decision-making. This means you’ll need specialist software for creating detailed and understandable models. Many different tools can be used to create Marketing Mix Models, but later in this blog, we’ll show you an example of our solution, strataQED.
Another important element is sales data, but this can include any other KPI that can be converted into profit, which, in the end, enables you to determine the ROI for your marketing investments. That being said, you must also consider other influencing factors, so, data for any other factors that you believe will influence sales, brand health, or your other chosen KPI(s), such as marketing activities (not only for your brand but also for competitors), price, seasonality, macroeconomic, etc.
Finally, you must have a good knowledge of the data, brand, category, and market to conduct a sound analysis. A basic understanding of statistics can be helpful but is not required, especially if your software has statistical analysis available.
The steps for adding metrics to your model
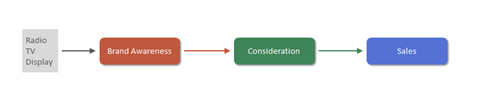
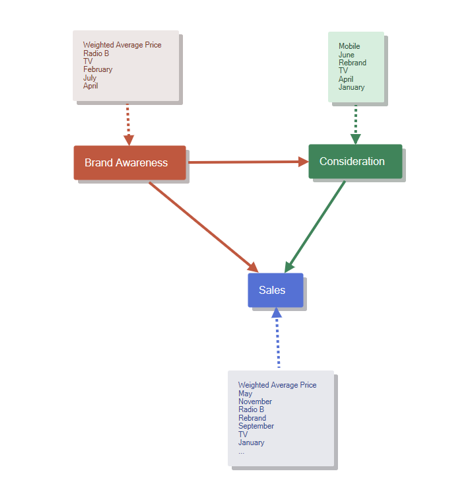
So, what steps do you need to take to add brand metrics to your Marketing Mix Models? You’ll want to start by collecting and carefully checking your data. From there, create models for each of your chosen KPIs, including the relevant brand health metrics. Where possible, measure the impact of one KPI on another. For example, you might create:
- a model for Brand Awareness that includes media as a driver of awareness
- a model for Consideration, that includes Brand Awareness as an explanatory factor
- another model for Sales, that includes Consideration as an explanatory factor
In the Consideration model, replace the impact of Brand Awareness with its drivers (as identified in the Brand Awareness model). And, in the sales model, replace the impact of Consideration, with its drivers including those that have already been reattributed from the Brand Awareness model. You should now have a model for sales that contains the impact of all the factors that have been identified along the customer journey. Some of these uplifts may be quite small – too small to have been measured separately within your sales Marketing Mix Model but made possible by creating multiple models at different stages. This process, of having the KPI from one model as an explanatory factor in another, is called Nested Modeling.
Using Nested Modeling in your Marketing Mix Model
A nested model, sometimes called a Network Model, represents an interactive relationship between independent drivers and multiple connected KPIs. For example, you want to know if TV advertising and Paid Search each lead to an increase in Sales, but you also want to know if TV advertising impacts the performance of Search. With nested modeling, you can account for these interactions but still get separate planning ROIs for each tactic. With nested thinking, you recognize that TV has a direct effect on Sales as well as an indirect effect on Sales via Search.
So, how do you reattribute the impacts from one model to another? You can create charts or slides to show how the impact of brand awareness on consideration can be broken down into other factors. Whilst interesting, and useful for storytelling, visual aids on their own are not overly helpful when it comes to deciding where to invest your budget.
For that, you need cold, hard numbers. The numerical reattribution of the impacts can be done in Excel, but this can be very laborious. The number of models and the intricacy of the relationships between the different KPIs will determine how large and complex this file needs to be. Having a diagram to show how the different models fit together will help ensure that the calculations are done in the correct order and that no steps are missed out.
Even for the most experienced Excel user, it can take several days to set up a file for reattributing the impacts of each activity on the various KPIs. Once it is complete if something does not quite look right, working back through the formulas to find any errors is time-consuming and tedious work. This has been the reality for many analysts for too long. Just because something is possible, doesn’t mean that it is a good idea or a fun part of the job.
Having seen some of the incredibly intricate model networks and corresponding Excel files created by various analytic consultants, we have decided that there had to be an easier, faster way to tackle this issue. Hence, we have created the Nested Models module within our Marketing Mix Modeling software, strataQED.
The benefits of Nested Modeling
With this new Nested Models module, you can:
- Link models that have been created in strataQED together
- View a diagram of how the various models interconnect and see which activities drive each KPI
- Visualize the impacts of each activity on each of the modeled KPIs, including the reattributed effects (indirect effects).
- Quantify these effects to see the return on investment (ROI) for each activity and how the response to an activity changes as you increase its weight (response curves)
And all of this can be done with a few clicks of your mouse – not an Excel spreadsheet in sight! Create your MMM models as normal and if you have a series with the KPI being explained in one model and an explanatory factor in another, these models can be linked within the Nested Models module.
Any series, where the data is identical across models will automatically be linked (this is for both dependent and explanatory variables). Once the models and series are linked, you can review the results of your nested model, using all the standard reporting screens within strataQED. On top of that, there are some additional options to see the direct and indirect effects of each activity, as well as the model path diagram showing how the models interconnect.
And that’s all! No exporting things to Excel. No complex calculations for you to perform or intricate diagrams of model networks to create. Our software takes care of all these things for you. All you need to do is review the reports and decide how you want to tell the story to your client.
If you are interested in learning more about our new Nested Modeling module, you can watch a recording of our Nested Modeling webinar below:


.png)