Performance Tools and KPIs to Help You Crush Your Marketing Goals


The business world is all “data, data, data.”
Ok, but what does it mean? What goals are those numbers tied to? Choosing the right performance tools and KPIs to measure your marketing goals doesn’t have to be difficult. We can help.
Your company has marketing goals, right? So let me ask you something: how are you measuring the performance of all the different things you do to achieve those goals? I bet you’re using KPIs, or key performance indicators, to assess your tasks.
The data tied to one or a set of indicators tells you whether or not what you’re measuring is working. KPIs can help determine if a task supports traffic growth or if a certain social channel is best for lead generation.
Choosing the right performance tools and KPIs to measure your marketing tasks is critical. Why? Because they’ll paint a clear picture of the pathway you take to achieve your goals.
Crunchin’ the numbers, crushin’ the goals.
Indicators, when appropriately applied and understood, tell you all kinds of things. Ultimately, they reveal decline, stagnation, or progress.
A KPI, according to Investopedia, is “any metric that indicates how well a specific goal or objective is being achieved… and can be created for any activity with mathematically measurable results.”
But just because a business uses KPIs to measure their goal-driven tasks doesn’t mean the data is relevant. As an SEO agency, we have our heads in data all day long. Not all data is created equal and there is no shortage of it. More often than not, you have far too much data.
When it comes to crunching the numbers, missed opportunities are a huge problem. If you’re gauging your marketing efforts with KPIs but can’t make sense of the data, you could be measuring the wrong things. The other possibility is that you’ve applied the wrong indicators.
There are about as many performance tools and KPIs out there as stars in the night sky. But based on your goals and the channels you’re using to reach them, not all will be useful.
To help you better understand these tools and indicators, we’re going to break down three common marketing goals into smaller, measurable bits: increasing brand awareness, improving the user experience & increasing qualified leads.
Along the way, we’ll give you our picks for the right tools & KPIs, and offer expert advice whenever possible.
1. Increase brand awareness with asking & listening tools.
What does it take to increase awareness of your brand?
In terms of tasks, the list can get lengthy. Some common ones include producing print and digital materials and using on-page optimization to appeal to a local audience. A more effective task is to regularly publish original, high-level content that appeals to people’s interests and needs.
The quality of a finished product depends on your focus and effort. Likewise, the effectiveness of a particular task–did it actually increase brand awareness?–goes only as far as your drive and your tools take it.
Asking Tools & KPIs:
One of the most common tools for measuring awareness is a survey.
If set up correctly, a survey can be very effective at gathering user-end feedback. The feedback you gather should both inform and support actionable items that are tied to goals.
Of course, the downside of a survey is that many people will opt out. But that’s ok: all you need is a sample. The small percentage of people who actually respond will attach real-world value to your brand, products & services.
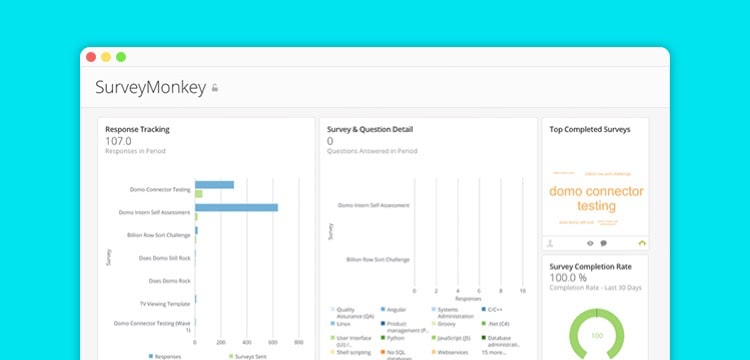
SurveyMonkey: SurveyMonkey has a great (and free!) platform for creating amazing surveys. You get real-time data population and in-depth analyses. Plus, you can export your data and create reports.
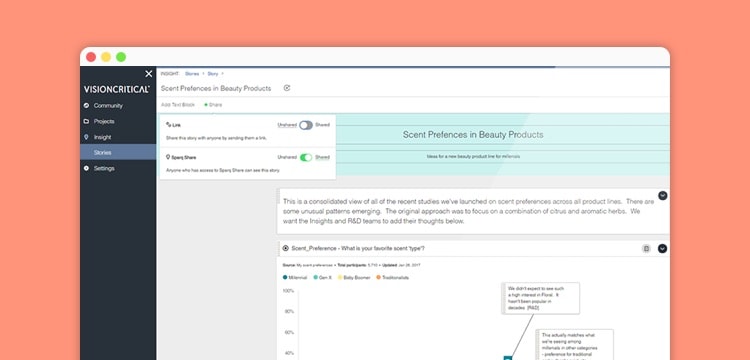
Vision Critical: As asking tools go, ye of little faith in traditional ad-hoc surveys have a better option. Vision Critical’s cloud-based platform collects the “real-time actionable customer intelligence that [you] need to build better products, deliver better services and achieve better business outcomes.”
KPI: The apex of brand awareness is customer satisfaction. We suggest that you check out this page for a detailed explanation of satisfaction KPIs & why you should be using them.
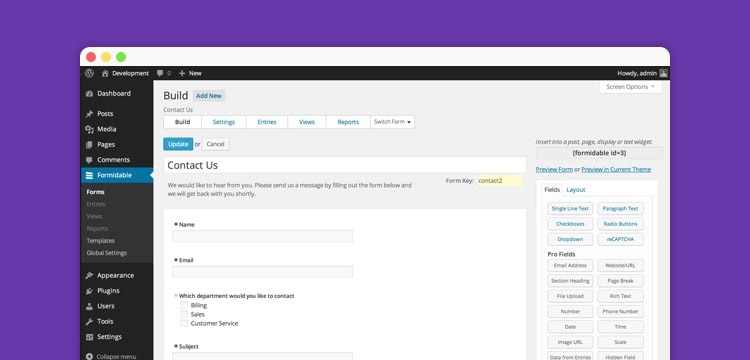
Expert advice: Many of you probably have a form builder on your website already. There are countless ways to leverage what you already have in order to reduce overhead.
Listening Tools & KPIs:
We could all be better listeners, right?
For businesses, this means listening to what people say and share about brands, products, services & experiences on social media. What people say and share about your brand across all social platforms collectively reflect your social reach.
The content you publish on social media has great potential to increase awareness and reach. And the further your reach goes, the larger your audience becomes. You can track reach on each individual platform, if you’d like. But we recommend measuring reach comprehensively.
You can use a social media listening tool to identify, collect, monitor & report on company mentions across all social media platforms.
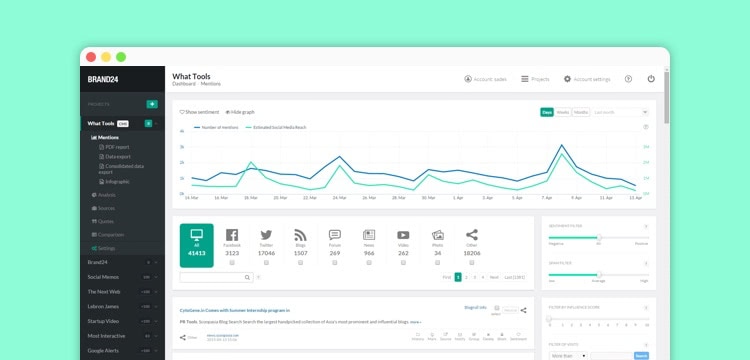
Brand24: Brand24 is “the most effective method of monitoring your brand or product on the Internet.” The key features of this tool are its mentions feed and discussion volume chart. The dashboard is clear, intuitive & organized.
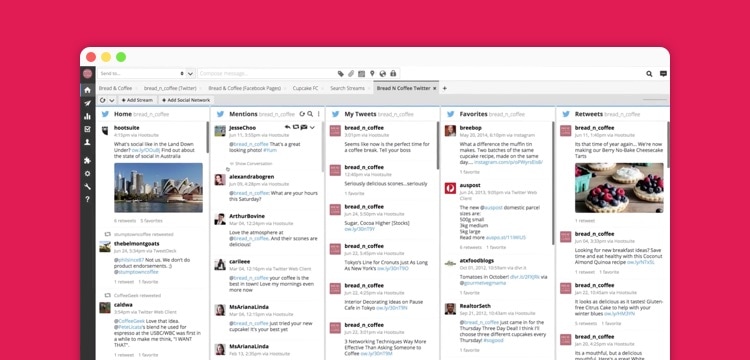
HootSuite: This is the most widely used social relationship platform in the world. With HootSuite, you can execute organizational strategies while managing existing content. You can even schedule new content to be published across your social platforms.
UTM Codes: If you’re not a fan of paid tools, you can track your marketing campaigns with UTM (Urchin Tracking Module) codes. A UTM is a bit of code that you attach to a custom URL. Paired with Google Analytics, UTMs tell you where your visitors came from and what specific campaign led them to your site.
KPI: Sentiment Analysis (Brand24) Pop quiz! What’s the apex of brand awareness? Customer satisfaction. It’s not enough to know the exact number of people who talk about your brand. You need to know why.
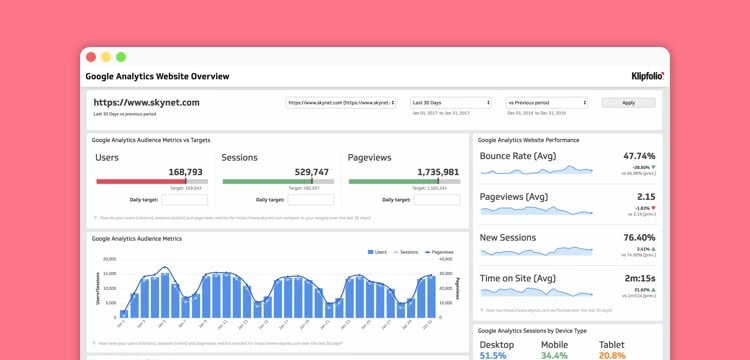
Other KPIs: Conversions / Conversion Rate (Google Analytics) To measure social conversion goals, actions on your site have to come from social media activities. Check out this page for instructions on setting up social conversion metrics in Google Analytics.
Other tools that measure brand awareness:
Expert advice: Listening tools can be pricey. Price depends on the size of your brand and amount of information you want to collect & make actionable. Be sure to check out as many tools as possible and compare features before you commit. In the end, listening is always worth it.
2. Improve user experience (UX) with heat map & split testing tools.
Increased brand awareness leads to increased user traffic. One thing we know about users is that not all have the same online behaviors. Much of that has to do with site architecture and content. But really, UX is the sum of every interaction between your users and your business. So while you might think that your architecture and content are perfect, do your users agree?
UX is the sum of every interaction between your users and your business.
How people interact with your site depends on their needs, goals & online acumen–AKA how well they “internet.” In a perfect world, everyone would click through every page, load up on info & convert.
But this world ain’t perfect.
You can’t please everyone, but by choosing the right performance tools and KPIs to measure your current UX, you can adjust to support the most common user goals.
Heat Map Tools & KPIs:
Let’s say you’re currently in a work sprint for a big project. Something that will affect UX, like a design overhaul. It’d be good to know how most users navigate your current site before you go making changes. Functionality should always be tied to UX.
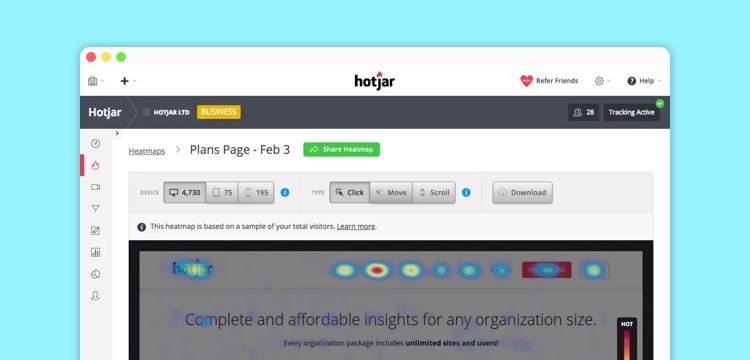
Hotjar: We love Hotjar. Give it a page to monitor and it spits out heat maps tied to specific behaviors performed on specific devices. Above all, Hotjar show you what your users do and don’t care about. On that note, we want to mention that people spend way less time on a website than you’d think. Really. So don’t get your hopes up.
KPI: Readability (Yoast SEO for WordPress) While being one of the best SEO tools on the market for your WordPress site, Yoast is also a great tool for UX. Use this plugin with Hotjar to cross-reference whether or not users value your site copy.
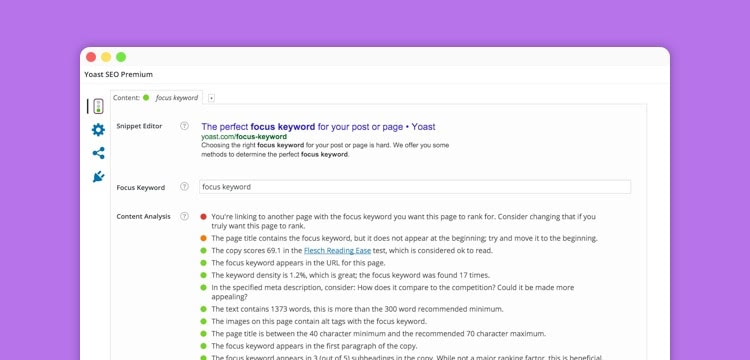
Expert advice: Improving UX means understanding who your audience is and speaking their language. If catering to people with a postgraduate reading level is not one of your goals, you shouldn’t have a reading score of 30% or less. Don’t make rocket science of your content unless you’re discussing actual rockets with bonafide scientists.
Split Testing Tools & KPIs:
Let’s say again that you’re in the middle of a continuous improvement design sprint for a big project.
Rather than assess behaviors on an organic page, you can set up a split test. In a typical A/B split test, traffic is directed at random to two versions of the same page.
From there, you can determine which is better for UX and therefore better for business.
HubSpot: You want to drive more traffic to your website, right? HubSpot is the tool you need if you intend to optimize your landing pages based on UX. You’ll even get keyword suggestions to help with SEO after you identify which page version drives more people to convert.
Google Analytics: With Google Analytics, you don’t just perform typical A/B split tests. Google’s Content Experiments uses the A/B/N format. This means you can test up to 10 different page versions and truly maximize on your UX-driven redesign.
HubSpot KPI: HubSpot’s dashboard is full of data that goes beyond split testing, so it’s an all-around awesome tool. On that note, we’re not going to suggest a single in-tool KPI. We think it more useful to share this page about how to set up a split test in HubSpot.
Google Analytics KPIs: CTR & Bounce Rate These two are easy. CTR is how often people click into your site from search results. Bounce rate is how often users left a page or your site entirely. On average, a bounce rate of 35% is ideal. So if you compare the two rates for a page and get a much higher percentage, you’ll know how compelling your content is.
Other tools that measure UX:
Expert advice: If yours is an e-commerce site, split test the page that has the greatest potential to drive conversions. If most users start at your homepage, create a version that highlights the service or product you want to sell more of.
3. Increase qualified leads (QLs) with a buyer persona, chat & feedback tools.
So you’ve measured the awareness and reach of your brand. After that, you worked hard to present the best site structure and content to your audience. The next step is to turn your visitors into customers.
Users who are more likely than others to convert are called qualified leads, or QLs. So what criteria “qualifies” a lead? Well, you choose those factors. They’re the demographic and behavioral factors that make up your ideal customer. All of these factors together make up your buyer persona.
On the subject of choosing the right marketing performance tools and KPIs for increasing QLs, a buyer persona is not something you want to be without. Around 40% of companies fail to make and use a buyer persona.
Don’t be like them.
Buyer Persona Data Collection Tools & KPIs
“Who your ideal customer is” is defined by geographic, demographic & technographic information.
It’s where they live and where and who they work for; their sex, age, marital & parental statuses; and the devices, channels & mediums they use to browse, consume, connect & make purchases.
Lucky for you there’s a ton of performance tools and KPIs out there that collect and organize this stuff.
Google Analytics: Google really has the internet all figured out, don’t they? With GA, you can drill down into specific identifiers, including cookie-related interest information. And not, like, chocolate chip cookies. We’re talking about the cookies that track your activities on the web.
KPI: The entire Audience report drop-down menu There is no one KPI that’s best for determining who your ideal customer is. So take advantage of all the Audience subcategory data to inform your buyer persona.
Expert advice: Ultimately, the value of your site, products & services is defined by your visitors and their activities. On that note, you should want to know whether and how you stack up against other businesses in your industry. Start at this page to learn about setting up Benchmarking KPIs in Google Analytics.
Chat and Feedback Tools & KPIs
Customers stall on completing CTAs for all kinds of reasons. Some will make repeat visits but still not convert.
They want what you’ve got, that’s clear. But maybe they’re not sure you’re the right provider or vendor. Or maybe they’re questioning the cost or the commitment.
Either way, you should be there to provide answers. Never leave a QL hanging.
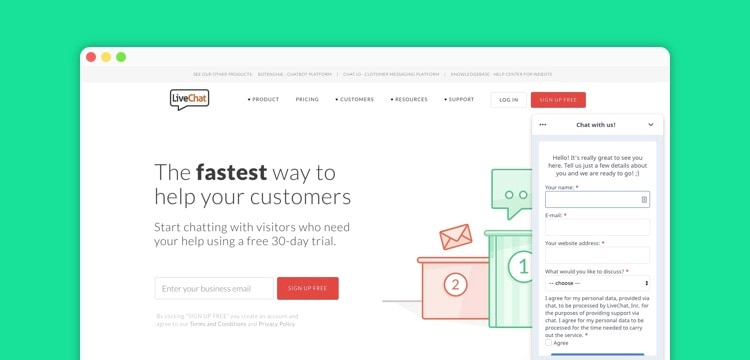
LiveChat: This goes a leap beyond gauging awareness and satisfaction with a survey. Use LiveChat to answer questions in real-time and make users feel good about their experiences while they’re happening. Engage, assist & compel. If this isn’t your motto for getting QLs to convert, it should be.
Reevoo: Data analytics tools show you the what, but Reevoo tells you why. “Customers convincing customers. That’s not marketing–that’s life.” Couldn’t have said it better ourselves. People LOVE to talk about and review the brands, products, services & experiences they love and hate. Reevoo captures customer-to-customer conversations, product reviews & user experiences so you can use and learn from them.
KPI: There isn’t just one or a few. There are all kinds of indicators that point to everything going smoothly and heading toward conversion. But sometimes, it’s gonna take muscle to keep the interaction from stalling and dying out.
Other tools to help you discover and connect with your ideal customer:
- Adobe Analytics
- Mixpanel
- Google Search Console (for keyword queries)
- Intercom
Expert advice: It takes effort to elevate yourself above your competition. You have to actually value what you’ve learned from the data. In the end, communication is key. If you want to beat your competition, you have to out-message them and engineer a better experience.
Seriously, it’s go time.
If you make a list of all the marketing performance tools and KPIs mentioned in this article, that list will not be exhaustive.
However, in performing your research–and do your homework!–you will find a good bit of overlap when it comes to tool capabilities and the marketing goals that each KPI informs. Which is exactly why choosing and using the right ones is invaluable.
Why? Because the data they produce ultimately informs whether or not your business processes are sound.
At the end of the day, the best advice we can offer is this: whatever you do, just don’t rely on bad data.
If you need help getting up to speed on your marketing goals, tools, or KPIs, we can help.
Fully transparent. Rapid testing. Growth minded.
Fully transparent. Rapid testing. Growth minded.
Schedule your 15-minute free consultation
WE•DO is ready to put our minds to work to drive your growth.


