

Whither Read Rates and Why?
By John Landsman, Director, Strategy & Analytics
Over the past 9-12 months, we’ve been watching a fairly steady and widespread erosion in email read (open) rates connected to marketing emails. We’re documenting and analyzing this downtrend more extensively, but we wanted to share our topline thoughts on what we’ve been seeing, what may be causing it, and what you might want to do about it.
To begin, take a look at the graph below. It shows recent-period year-over-year (YOY) read rate performance for ten national multi-channel retail brands. Five of them are in the big box/major retailer category. The other five occupy the specialty/apparel-accessories space. Nine of the ten (Brand “F” is the only exception) show read rate declines.
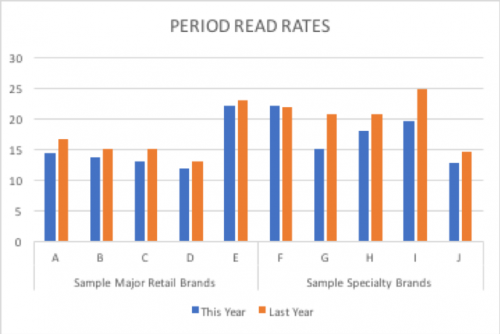
There’s no single, clear answer as to what’s driving this pattern. As we all know, a great many factors drive email engagement rates and their trending. All of these brands are well-known and sophisticated mailers. It’s unlikely that they all decided to get sloppy at the same time.
One working hypothesis is that the erosion in engagement may be related to intensifying customer inbox activity and contention; simply stated, more senders deploying more email.
- More Senders? Very likely. Our Overlap Analyses show the extent to which a given brand’s email subscribers are receiving email from other brands. We looked at how one retail brand’s Overlap Analysis changed YOY. Of their 35 top overlapping brands one year ago, 28 remained In this year’s top 35 overlaps. Of those, 64% showed a higher percentage of overlap this year than last year. Interpretation? This brand’s email subscribers are definitely receiving emails from more senders than they were a year-ago.
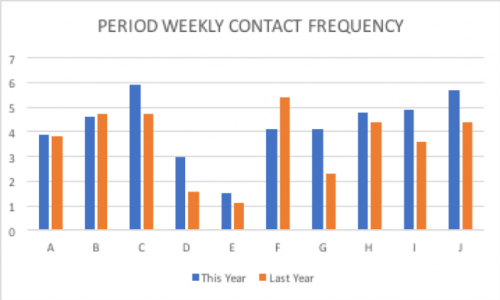
- More Email? The below graph shows year-over-year weekly contact frequency (i.e., number of the brand’s campaigns received weekly per subscriber for the same ten brands as shown in the graph above. All except Brands “B” and “F” increased their weekly contact frequency, and also saw read rates decline. Brand “B” had a read rate decline, even with a decrease in contact frequency. But Brand “F” — the only one above showing a read rate increase — also shows a significant decrease in contact frequency.
- Deliverability? Not likely a factor. Inbox performance improved year-over-year for all the above brands over the same comparison period.
So, what have we actually proven here? Not much. If there’s more inbox contention than ever, would that surprise any of us? Brands sending more email? That’s hardly breaking news.
But what to do? Some brands deliberately mail more, willing to live with the tradeoff between acquiring more actual read events, while risking lower read rates and even perhaps higher unsubscribe rates. But we should all be managing this kind of tradeoff based on data, by testing which of our audience engagement segments can best tolerate which level of email contact frequency. It’s a song we’ve sung often in this space. More engaged subscribers tolerate more frequent contact, and vice versa. The challenge is to identify those various groups within your subscriber base, and create appropriate mailing cadences to each of them.
Otherwise, we’re left with the classic “best practices” drill including:
- Responsible subscriber acquisition, welcome and onboarding.
- Message content optimized for relevance, based on customer location, behavior, preference and with related personalization reflected in subject lines.
- Limiting campaign audiences to 90-120 day email actives.
More to come on this conundrum, as we dig deeper into our data. In the meantime, stay tuned for upcoming coverage of July 4th email activity and this year’s Amazon Prime Day.