
Email Client Market Share in August 2021: Email Clients Hold Steady
It’s that time again: Here’s our monthly recap on the shifts and trends that happened last month with email client market share. Compared to our annual email client market share blog post, this series takes a look at the data on a month-to-month basis.
All eyes are on August as we dig through the data and bring you the insights that matter. What did we find? Well, no major shifts happened, but we did take a close look at the details in between.
Let’s dive in.
Top 10 email clients overall
The top 3 email clients remain the same: Apple iPhone (iOS Mail), Gmail, and Apple Mail (macOS Mail).
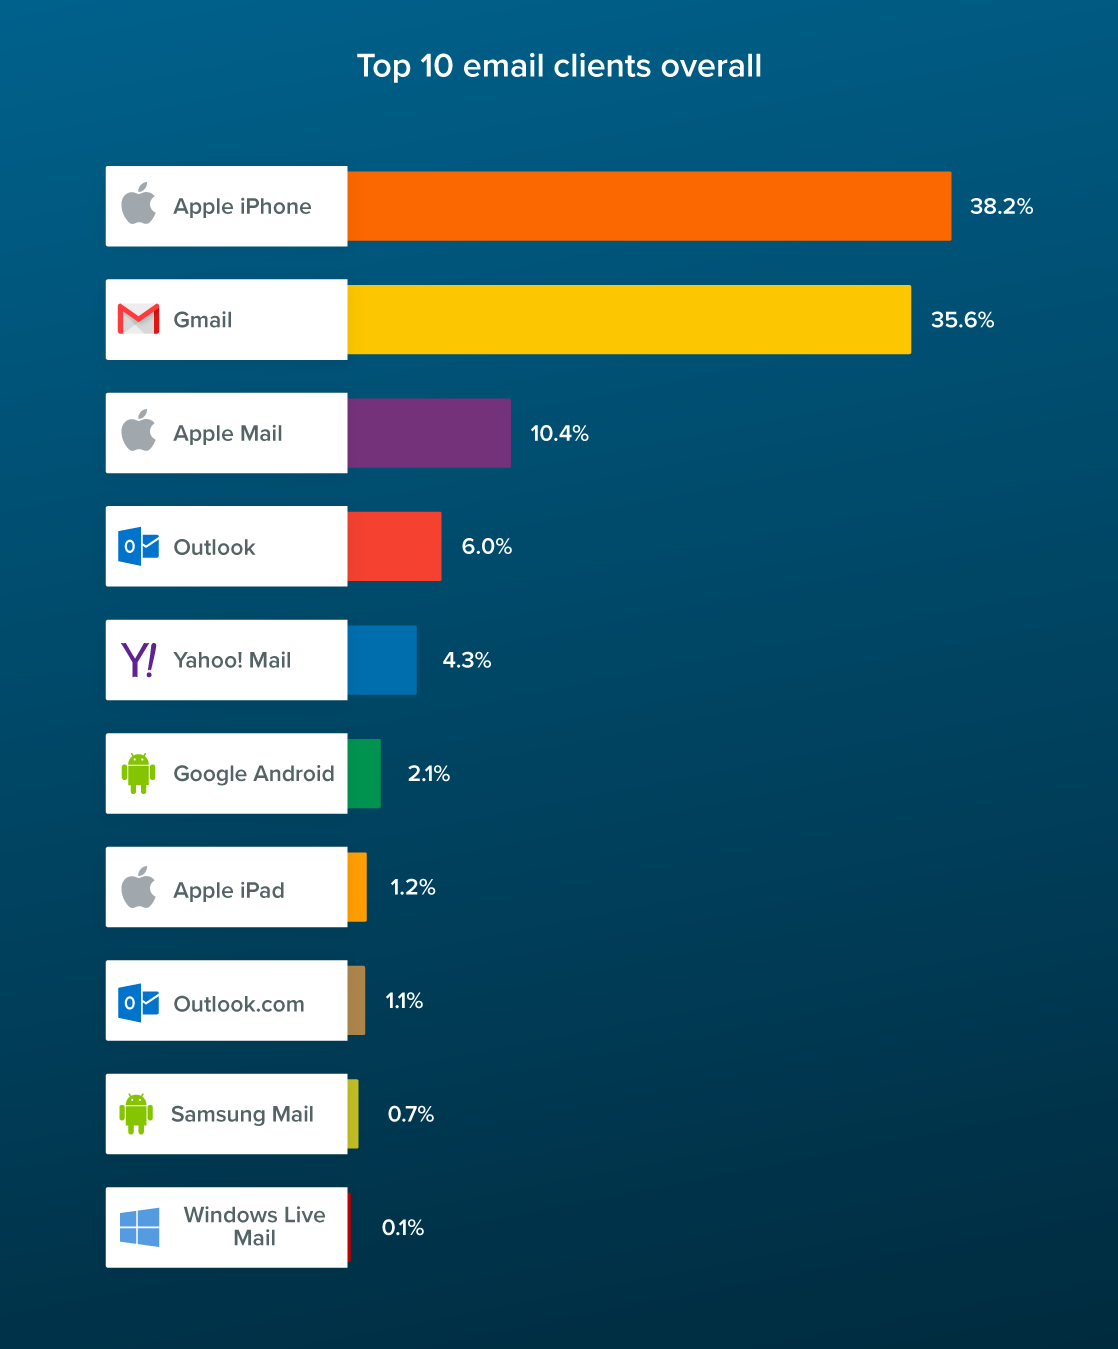
Apple iPhone (Apple Mail on the iPhone) decreased its market share slightly, less than half a percentage point. Since Q1 (January-March 2021), Gmail has been slowly climbing, growing from 28.2% to 35.6%.
All ranks have remained the same since July with one exception: Apple iPad and Outlook.com have swapped spots yet again, only by a small amount, with Apple iPad at #7 and Outlook.com at #8. This seems to be a recurring dance, as the top 10 email client rankings are back to what they were in June.
This month, Outlook.com decreased in popularity by 8.8%, while Apple iPad’s share increased slightly. When we reporting last on July’s email client market share, we noted how Apple iPad’s share was slowly waning with each passing month; however, we’re seeing it surface again with a small lift in August, from 1.16% to 1.24%. A question we asked ourselves: Could Apple iPad’s slight increase in popularity be due to back-to-school season in full swing?
- Apple iPhone (iOS Mail): 38.2%
- Gmail: 35.6%
- Apple Mail (macOS Mail): 10.4%
- Outlook: 6.0%
- Yahoo! Mail: 4.3%
- Google Android: 2.1%
- Apple iPad (iPadOS Mail): 1.2%
- Outlook.com: 1.1%
- Samsung Mail: 0.7%
- Windows Live Mail: 0.1%
Opens by environment
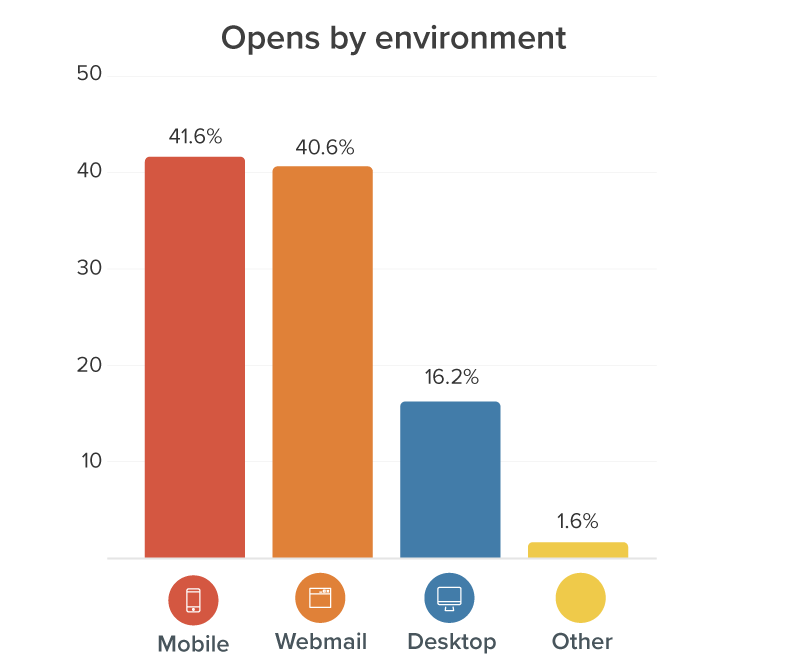
Mobile’s share hasn’t made any dramatic shifts since July—just a slight decrease of less than half a percentage point, from 42.0% to 41.6% in August. Earlier this year in our Q1 review, mobile’s share was 43%.
As for webmail, we’re seeing the opposite: Although the increase is minor (from 40.4% in July to 40.6% in August), there’s an overall increase in market share when compared to Q1. Webmail was at 36.1% when we looked at the end of Q1, and sits at 40.6% for August.
Something interesting we’re seeing? The margin between mobile and webmail has been pretty tight over the past few months. In June, mobile and webmail were only 0.79 percentage points apart. In July, the margin grew to a 1.56 percentage point difference, but in August, the two are head-to-head again, back to a small margin of 0.98%.
As for desktop, not much has changed from July—it’s increased slightly from 16.1% to 16.2%.
- Mobile: 41.6%
- Webmail: 40.5%
- Desktop: 16.2%
- Other: 1.6%
Most popular mobile opens
Although mobile’s market share decreased by a hair, no significant changes happened for mobile opens. The top 3 mobile email clients remain the same as they typically are.
Apple iPhone holds steady at the top at 90.5%, the same as the previous month. In second is Google Android, which decreased ever so slightly, from 5.0% to 4.9%. Apple iPad increased, from 2.7% to 3%.
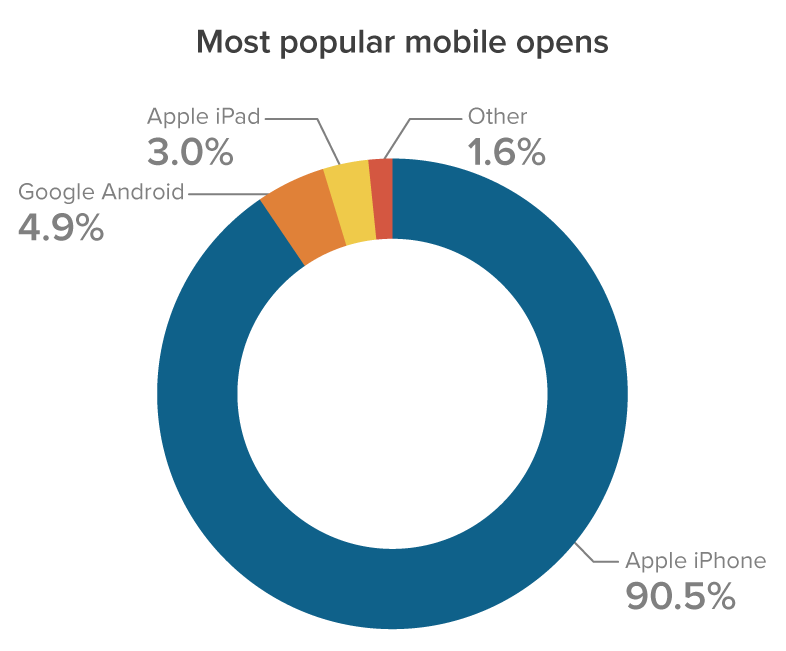
- Apple iPhone (iOS Mail): 90.5%
- Google Android: 4.9%
- Apple iPad (iPadOS Mail): 3%
Something to consider: nearly 65% of our data comes from the United States. As we mentioned in July’s email client market share blog post, when we dig into non-US mobile apps (like GMX and Web.de), the number of Android users is significantly larger, nearly 5 times more than looking at iPhone and iPad combined.
Most popular webmail opens
Webmail increased a slight amount, but the ranking of webmail remains the same.
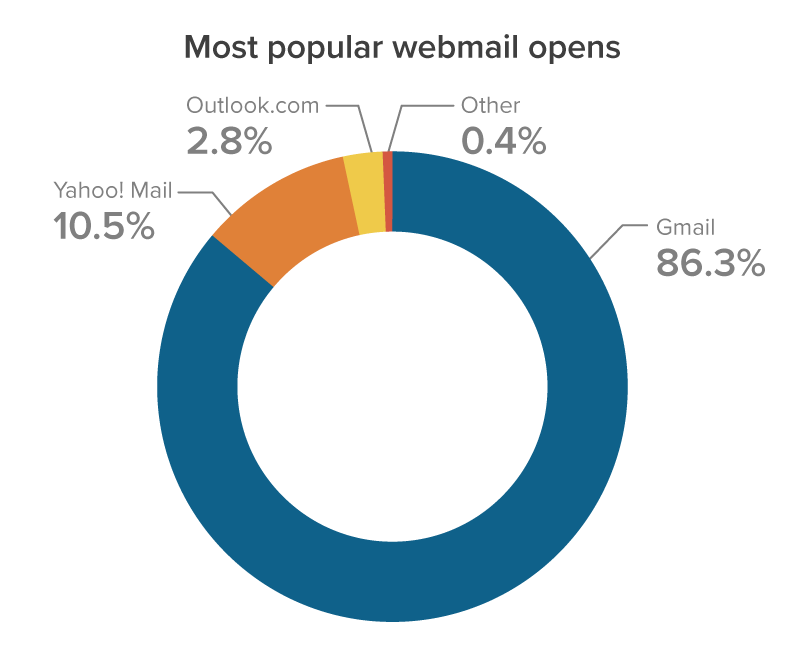
What happened between the lines? Gmail increased from 85.2% to 86.3%, Yahoo! Mail decreased from 11.4% to 10.5%, and Outlook.com decreased from 3.0% to 2.8%.
- Gmail: 86.3%
- Yahoo! Mail: 10.5%
- Outlook.com: 2.8%
Something I’ll have my eye on for next month is Yahoo! Mail. In June, its share was 11.5%, then 11.4% in July, and 10.5% in August. As for Gmail—wondering why we place Gmail under the webmail umbrella? Learn how Gmail opens are reported in Email Analytics.
Most popular desktop opens
Out of the three reading environments, desktop was the most steadfast with only a 0.1 percentage point increase. This holds true when we took a closer by each client.
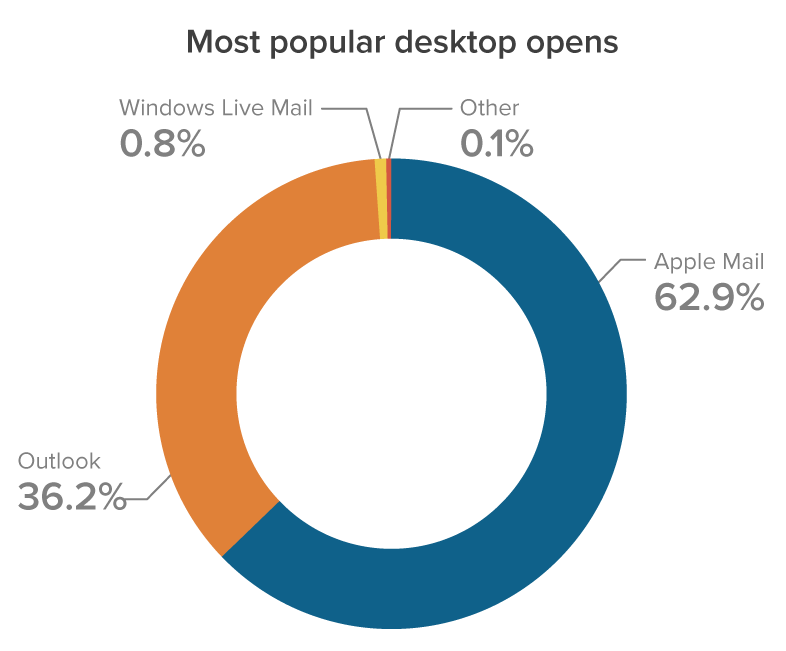
Apple Mail holds its spot as number one, increasing slightly from 60.4% to 62.9%. Outlook saw a minor drop, from 38.6% to 36.2%. Windows Live Mail remained the same at 0.8%.
- Apple Mail: 62.9%
- Outlook: 36.2%
- Windows Live Mail: 0.8%
What’s next?
Over time, little shifts can lead to big changes down the line. And, although we didn’t see any seismic shifts from July to August, we’re curious about how things will change moving forward.
Will things change in September, with school back in session or the changing of the seasons? Tune in next month as we share our findings and for our 2021 State of Email Engagement report, where we look at the data for the whole year together.
Where did we get all this data? Our email client market share stats are pulled from over a billion email opens, anonymously collected and aggregated with Litmus Email Analytics from August 1-31, 2021. It highlights global trends across all industries and verticals. Some email clients may be over- or under-represented, particularly with mobile and webmail. This is due to image blocking or image caching, most notably with Gmail. Still curious? Learn how we get this data.
Kimberly Huang
Kimberly Huang is a Content Marketing Manager at Litmus