When rummaging through a marketer’s toolbox, few tools are better than Google Analytics’ content insights to sharpen your company’s marketing strategy. Identifying the right insights to achieve your goals, though, is the first step you must take before you plan your brand’s content strategy for the coming months and years.
Data insights lie at the heart of any successful enterprise’s content marketing strategy. When you make your customers the focus of those insights, discovering the ones that make the best sense for your company becomes a lot easier.
The data that marketing teams need most involve their customers’ preferences, behaviors, motivations, needs, and pain points. If your company offers a wide variety of products and services, it probably has a similarly wide range of customer segments, each of which has its own data set.
These deep insights from content analytics can help you and your teams create personalized content that meets your customer segment’s needs and satisfy their thirst for knowledge. Becoming a thought leader in your industry is a given for any company that wants to succeed. But when you personalize that thought leadership content to each of your segments, it’s marketing magic on steroids.

B2B enterprises, too, need to take into consideration the specialized needs of each decision-maker within their client companies, particularly if they intend to pursue account-based marketing. Account-based marketing produces highly personalized content for each decision-maker, content that’s targeted to their specific questions, pain points, role, and preferences.
The best place to find that information? Google Analytics. Learn what insights will help you and your team simplify your content planning and creation processes.
1. Track Each Content Group’s Performance with Content Grouping
Whether your company is primarily B2B, B2C, or both, you probably publish content in several categories. Take John Deere, for example. Although it manufactures high-end farming equipment for major agricultural firms, it also makes tractors and lawnmowers for smaller family farms and personal use. With Google Analytics’ content grouping feature, the company can track blog posts’ performance in diverse categories for its wide range of customers, such as large-scale agricultural economics for its B2B customers and lawn maintenance for its B2C ones.
Although we’re primarily a B2B company, we publish content in several categories, including content strategy, content analytics, content management, and more. Similarly, a B2C company that makes household chemicals might create blog posts in several categories to meet its customers’ needs. They might include:
- Proper care and maintenance of flooring
- Window materials and care
- Wallcovering and painted surfaces cleaning and maintenance
Your company probably does, too. When you can analyze how content for each of your main categories performs, you can identify new markets, tweak categories that underperform, or find new categories when you add new products or services.
You can also group your content by types. Depending on your customer demographics and preferences, you might discover that one customer segment prefers video content, while another wants to read deeply researched written pieces, such as white papers or ebooks.
2. Use Geographical Tracking to Identify Your Visitors’ Top Ten Countries
Google Analytics also tracks your blog visitors’ location. For enterprises that do business internationally, that insight can be a game-changer. Take a look at how that might affect a company that manufactures nutritional supplements and wants to take its business global.
Suppose it manufactures joint supplements for both pets and humans. It makes its pet supplement from pig cartilage, but it uses bovine (cattle-sourced) cartilage for its human one. If the content team notices that blog subscribers from Israel and Turkey number among its top ten visitors, it might emphasize its bovine source to build trust among people whose culture forbids pork consumption.
The Google Analytics geo-tracking function can also identify the need to translate content into other languages if the numbers show that lots of people from non-English-speaking countries are frequent visitors. Or, if most of the blog visitors are from the UK, for instance, you might want to use UK English in your copy.
3. Drill Down into Your Data to Fine-Tune Your Strategy
Discovering new value in existing content can help you plan your future content strategy. To find these little nuggets of marketing gold, you need to use Google Analytics’ powerful drilldown report.
What boggles my mind is that so many companies neglect this powerful tool. It’s easy-peasy.
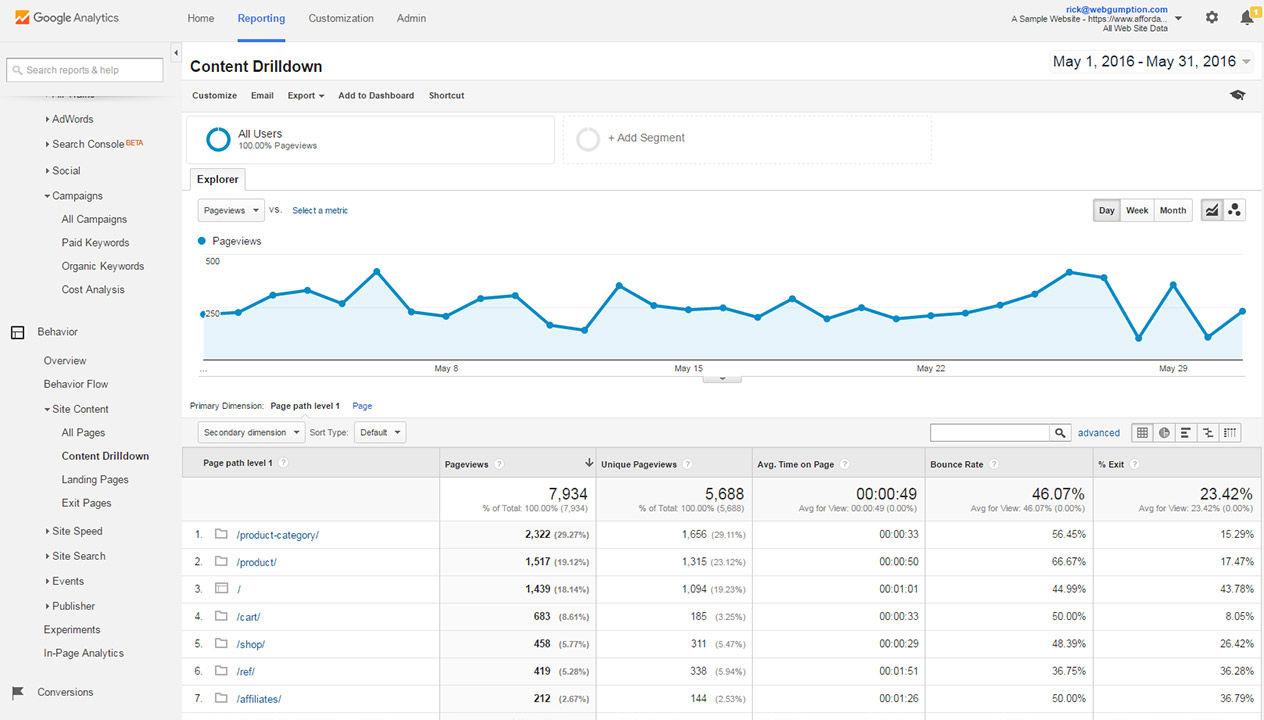
Simply start with a page or directory. Click on the next level to go down. At each step, you can look at the metrics, looking for how your audience engages with each piece of content.
You might find that certain topics get a crazy number of people engaging with them. Topics you might have thought to be yawnfests turn out to be just what your audience wants to read and share.
(Note to self: Plan more blog posts and videos about those topics. Get them on our content calendar. Create and amplify them on social and in our email newsletters.)
On the other hand, that piece you researched so meticulously lost readers about halfway through the post. Oops.
Now, that well-researched piece might just attract more readers if you simplified your language and got off your ivory tower. Even more readers might stay on through the whole thing if you peppered it with a few visuals throughout.
But you’d never know what went wrong and what went right if you didn’t drill down into the details. That’s why we highly recommend that you use this tool to gain the kinds of insights that will help you reach into new markets with the topics they want to learn more about.
4. Leverage Referral and Social Shares Data to Identify High-Value Content
Although referrals (from backlinks) and social media shares are two different metrics in Google Analytics, they are two sides of the same coin: content that brings your audience so much value that they’re willing to share it with others.
Referral Data
Referrals measure the number of visits received from third-party websites due to those websites citing (linking) your content as a trusted source in their own content. Getting backlinks links to your site is mostly an organic process that happens when A) you’ve published great content, and B), people find you as part of their research (searching) when creating their own content. As more third-party websites link to you, the more referral traffic you will see. The key insight here is two-fold:
- Identifying which pieces of content are getting the most links, and in turn, more referral traffic
- Understanding why they are doing well
This insight should help you plan and create more content with similar attributes, which should result in more links and referral traffic.
Social Engagement Data
Social shares, on the other hand, are signals that your audience is finding value in specific pieces of content and are willing to take the time to share them with their social media followers.
This data is very valuable for your ongoing content ideation and content planning, but capturing this data might require some technical prowess. In particular, Google Analytics requires that a social plugin be connected so that these social shares (interactions) can be collected and tracked. For those companies who use a CMS like WordPress, many social sharing plugins are available that should make the connection to GA simple.
Others may have to rely on their web teams to set up the connection in a more manual or hard-coded fashion. Another alternative is leveraging the social engagement data provided directly from the social platforms or third-party tools.

Example: Screenshot of engagement data from Quuu Promote
The Bottom line
Both referral and social sharing metrics identify the kinds of content you need to create more of. Much more.
These pieces of content mark you as a thought leader, an authority in your field. Not only do these shares build trust, but they also expose your brand to new prospects. It’s a win-win strategy, one you need to put front and center in your content toolbox.
That toolbox works best when you have a comprehensive content marketing platform to pull all this data together, create new content based on it, schedule it, publish it, and then amplify it on all the channels where the right people will find it. From the spark of inspiration to analyzing insights from the final product, you need one place where your team can do it all.
That place is DivvyHQ. Having a single repository that covers the entire content marketing process changes the playing field. Try it for 14 days and see the difference it makes for your team.