
How To Get Actionable Email Insights and Share Results… Fast
Getting an email built and out the door is a challenge. Getting the reporting you need and sharing what you’ve learned with other members of your team? That can be even harder.
There’s no question that sharing what you know about your subscribers can help your marketing team make informed decisions in every aspect of marketing, but sometimes that data can be hard to see. You might be using multiple Email Service Providers (ESPs) that report on different metrics, or it can be nearly impossible to see an aggregated view of your campaigns to compare them against each other. And even then, you still have to put all of these numbers in an Excel spreadsheet to be able to share them with others.
Not anymore!
The latest enhancements to Litmus Email Analytics make it easier to get the email insights you need to improve future campaigns and share those insights to drive success across your marketing portfolio. Here’s what’s new.
Quickly add previously used tags to email tracking codes
When creating a new tracking code, you already had the ability to add tags to your Analytics report in order to sort your email campaigns by a specific tag.
Now, you’ll see previously used tags when you’re setting up new tracking codes. This new feature makes it easier to apply tags that you use often—like “newsletter” or “2020” or “promotion,” for example—saving you a small amount of time that adds up over multiple tracking codes and emails.
![]()
Group and compare campaigns to get the insights you need
Last year, we released Aggregated Reporting in Litmus Email Analytics, making it easier than ever to view all of your emails in one place and compare them to one another to see which performed best.
But now, we’ve made email reporting even better. You can now create and save custom reports, filtering your analytics by:
- Opens in the last 30, 60, 90, and 120 days (or a custom date range)
- The name you chose for your tracking code
- Tags you added to your email
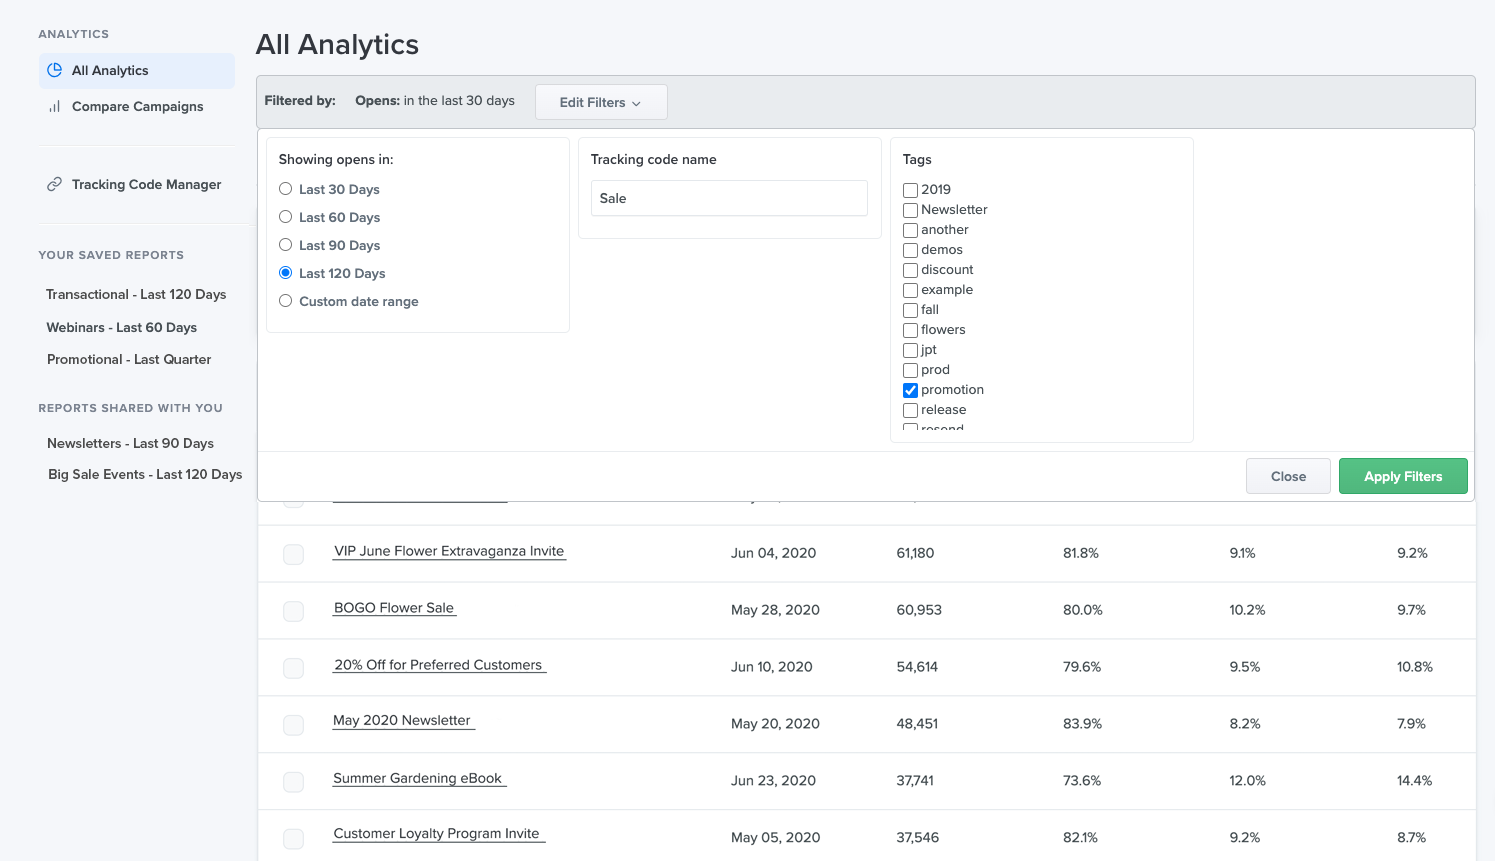
You can then sort by date or opens to easily identify top-performing emails. This is a great way to drill down to specific types of email campaigns. For example, you can see how your newsletters have performed all year, or if your summer sale email performed better than your winter sale one.
Easily create and share reports across the team to boost visibility and collaboration
Any unique reporting view you create in Litmus Email Analytics can be saved as a custom report that you can go back to again and again. As the user who created the report, you can also adjust parameters or rename the report (or delete it) as needed. Just click the one you need under “Your Saved Reports” on the left sidebar.
What if you want to share those sweet insights with the rest of your team in a way that doesn’t involve a lot of manual work? We’ve got that covered too.
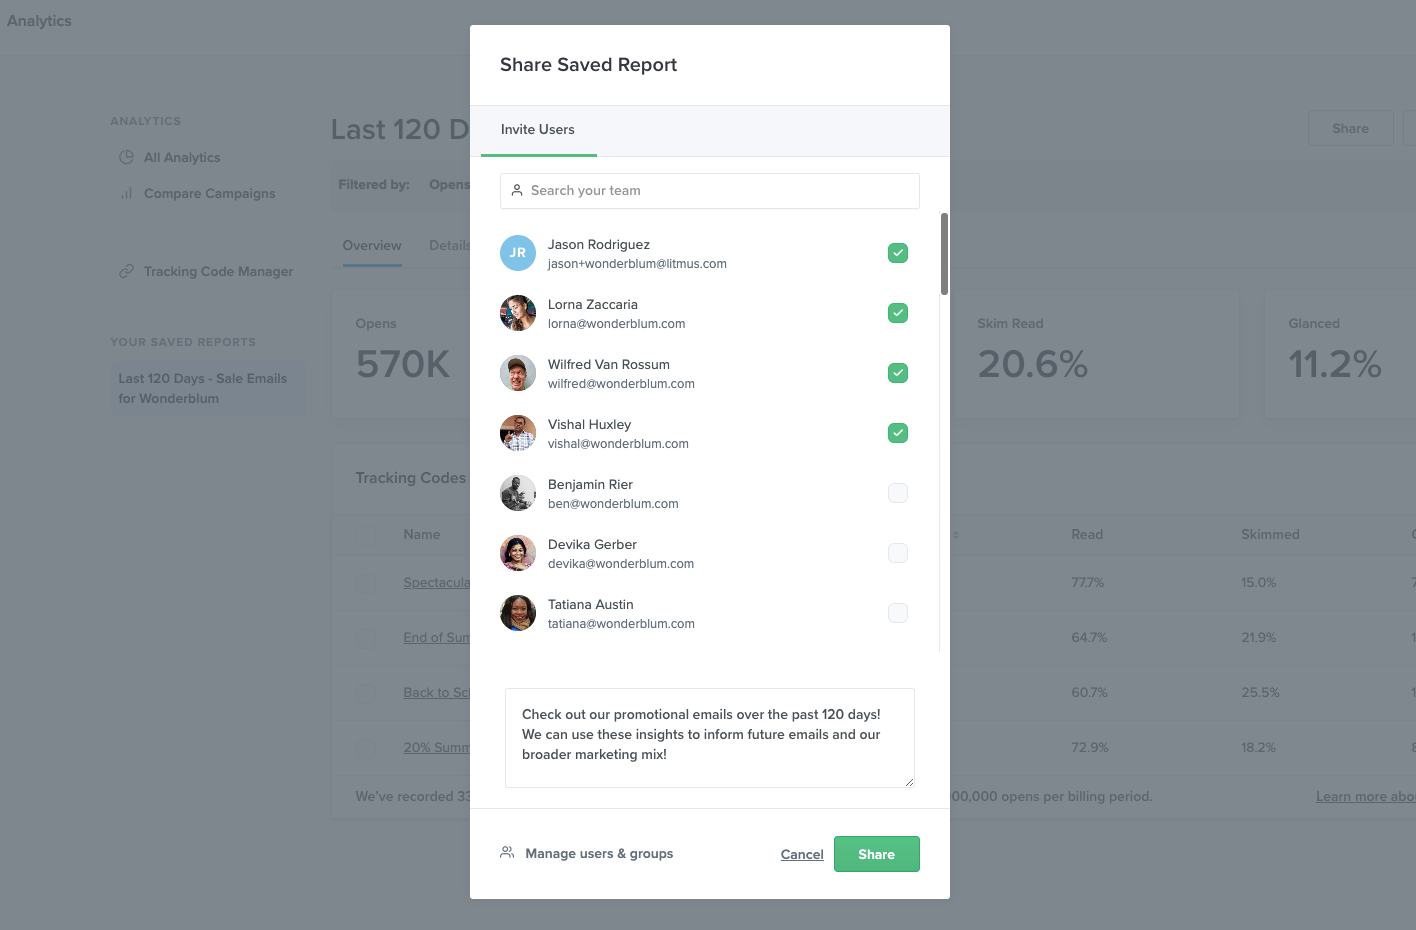
To share your report, click “Share” in the top right corner of the saved report you’d like your team to check out. You can share your reports with any team member who has a Litmus login and analytics access.
When you share a report with your team members in Litmus, they will get an email notification that looks a little something like this:
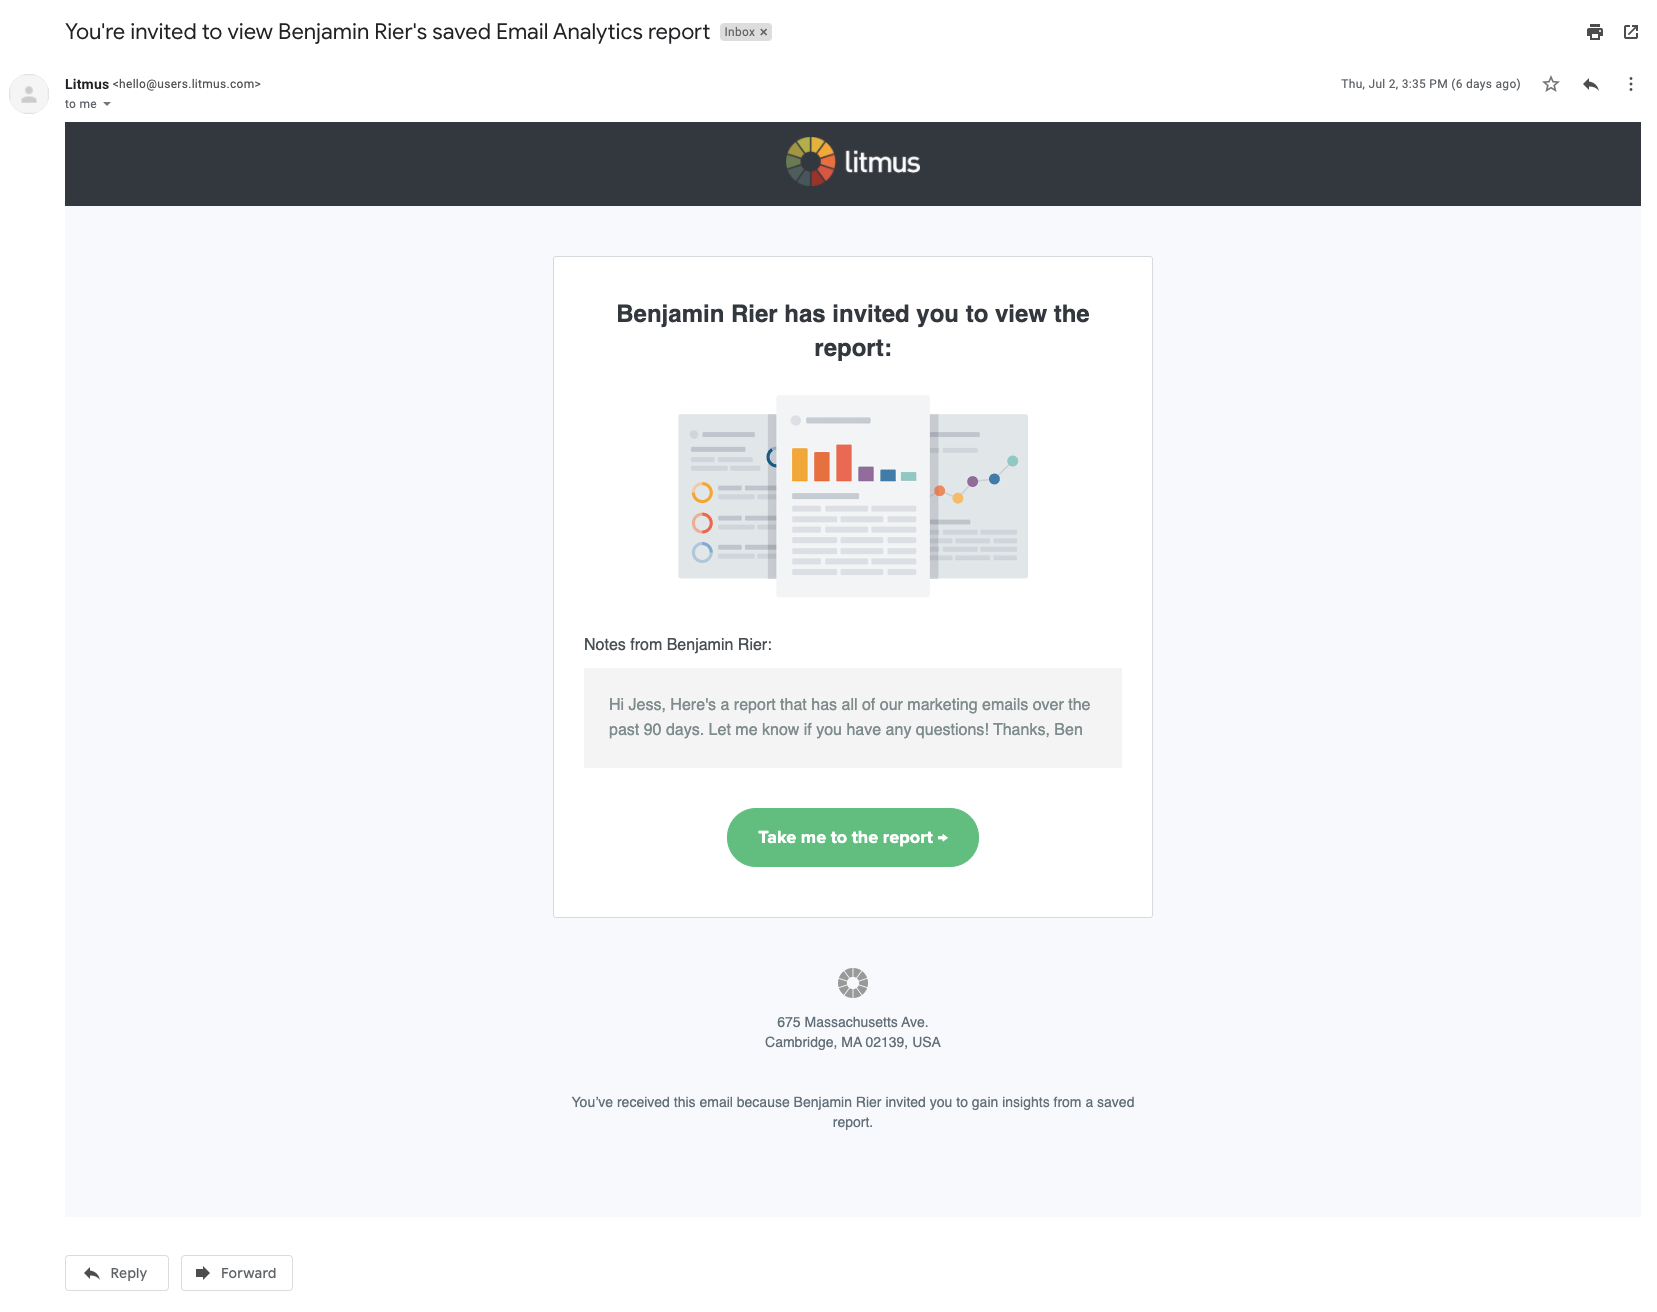
Not only will those users get an email notifying them about the shared report, along with any notes you added, but they’ll also be able to access shared reports easily in their analytics dashboard under “Reports Shared with You” on the left sidebar—no need to go back and find that email again and again.
It’s time to analyze and share!
These enhancements to Email Analytics are available now in your Litmus account.
Don’t have a Litmus account yet? Start a free trial or talk to a Litmus expert to get started.
Whitney Rudeseal Peet
Whitney Rudeseal Peet was a Digital Marketing Specialist at Litmus