Google Analytics is the most popular web analytics tool worldwide and is used by almost every webmaster. It has the largest market share of around 85.4% when compared to other analytics tools. The reason it’s so popular is because it’s free to use, data comes directly from Google and you can make concrete business decisions based on the data it provides.
But, due to the tremendous popularity of Google Analytics, we often overlook the presence of other analytics tools that are just as good.
Maybe you want to ditch GA because of issues related to data privacy (Google tracks your data to use it for advertising purposes). Or you’ve realized that GA data is often based on a percentage of your overall data, meaning that it does not report all of it (this is called data sampling). Or you just want to see what else is out there and whether it can show you anything different about your business.
Whatever the reason, if you are looking for an alternative to Google Analytics, here are the 9 best analytics platforms that you might want to consider.

1) GoSquared
GoSquared is simple and easy to use web analytics platform with beautiful, intuitive dashboards. You only need to install GoSquared on your website – no further setup is required. It offers easy integrations with several platforms like Twitter, Slack, Zapier, Shopify, WordPress, Joomla and others.
Top Features
This web analytics tool offers different dashboards for each purpose. The various types of dashboards offered by GoSquared are:
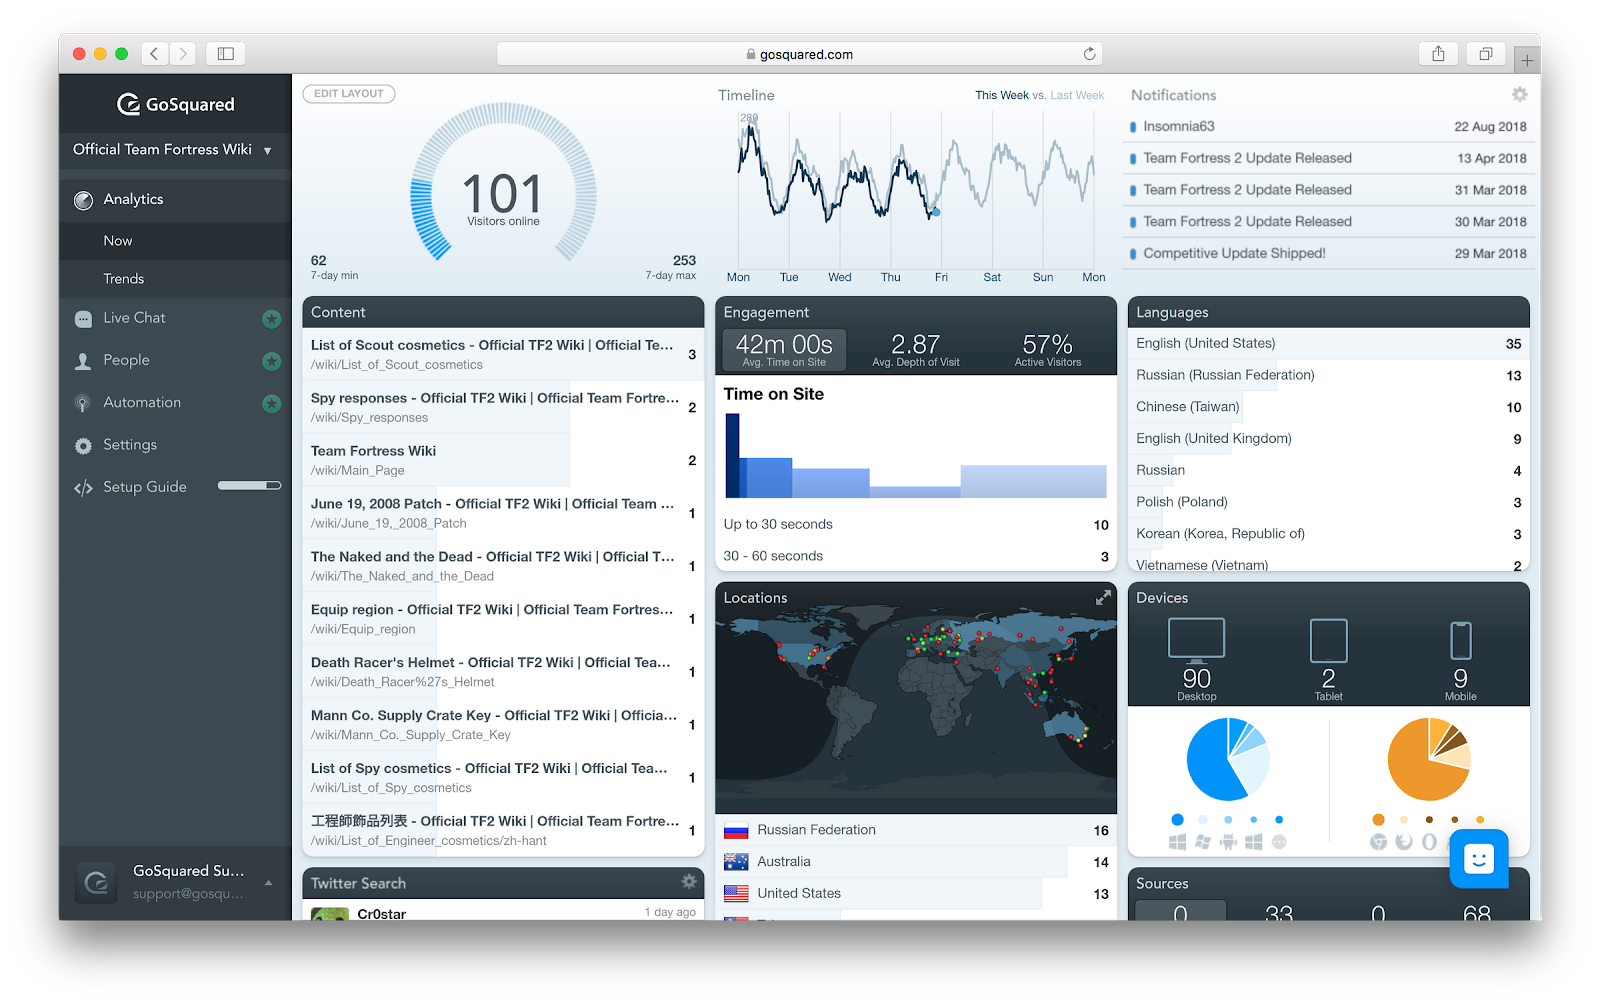
- Now Dashboard – This is a real-time web analytics dashboard that lets you see what’s happening on your website right now. You can see the number of concurrent visitors and compare it with a previous time frame. You can discover the top traffic sources in real time and identify the top pages on your site:
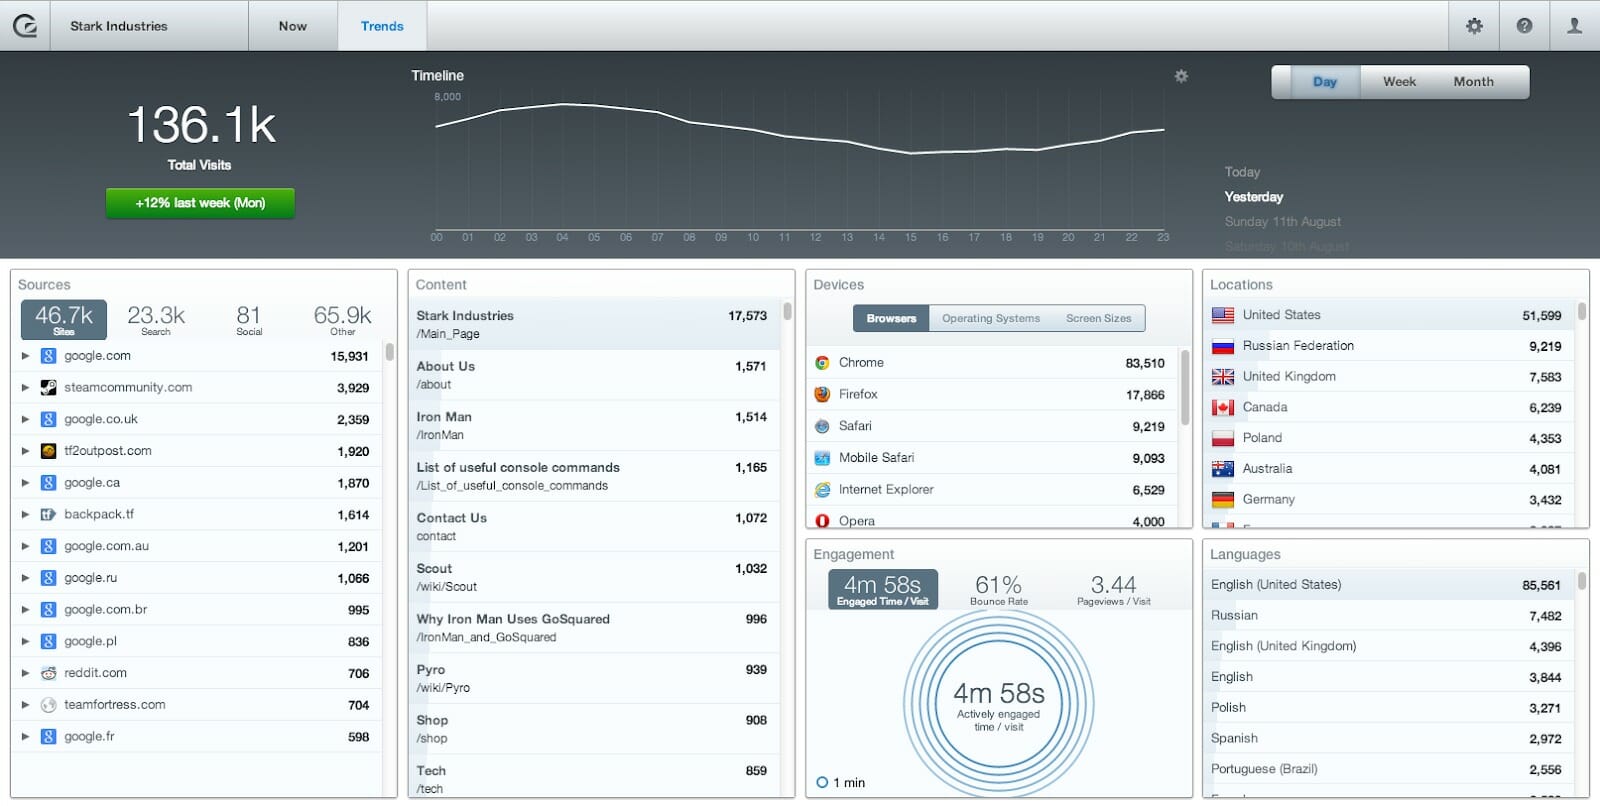
- Trends Dashboard – This dashboard has a built-in historical reporting feature that answers the question “What happened on your site on any given day, week, month or year?” It also displays the IP address of your visitors to give you extra information that most analytics tools don’t offer:
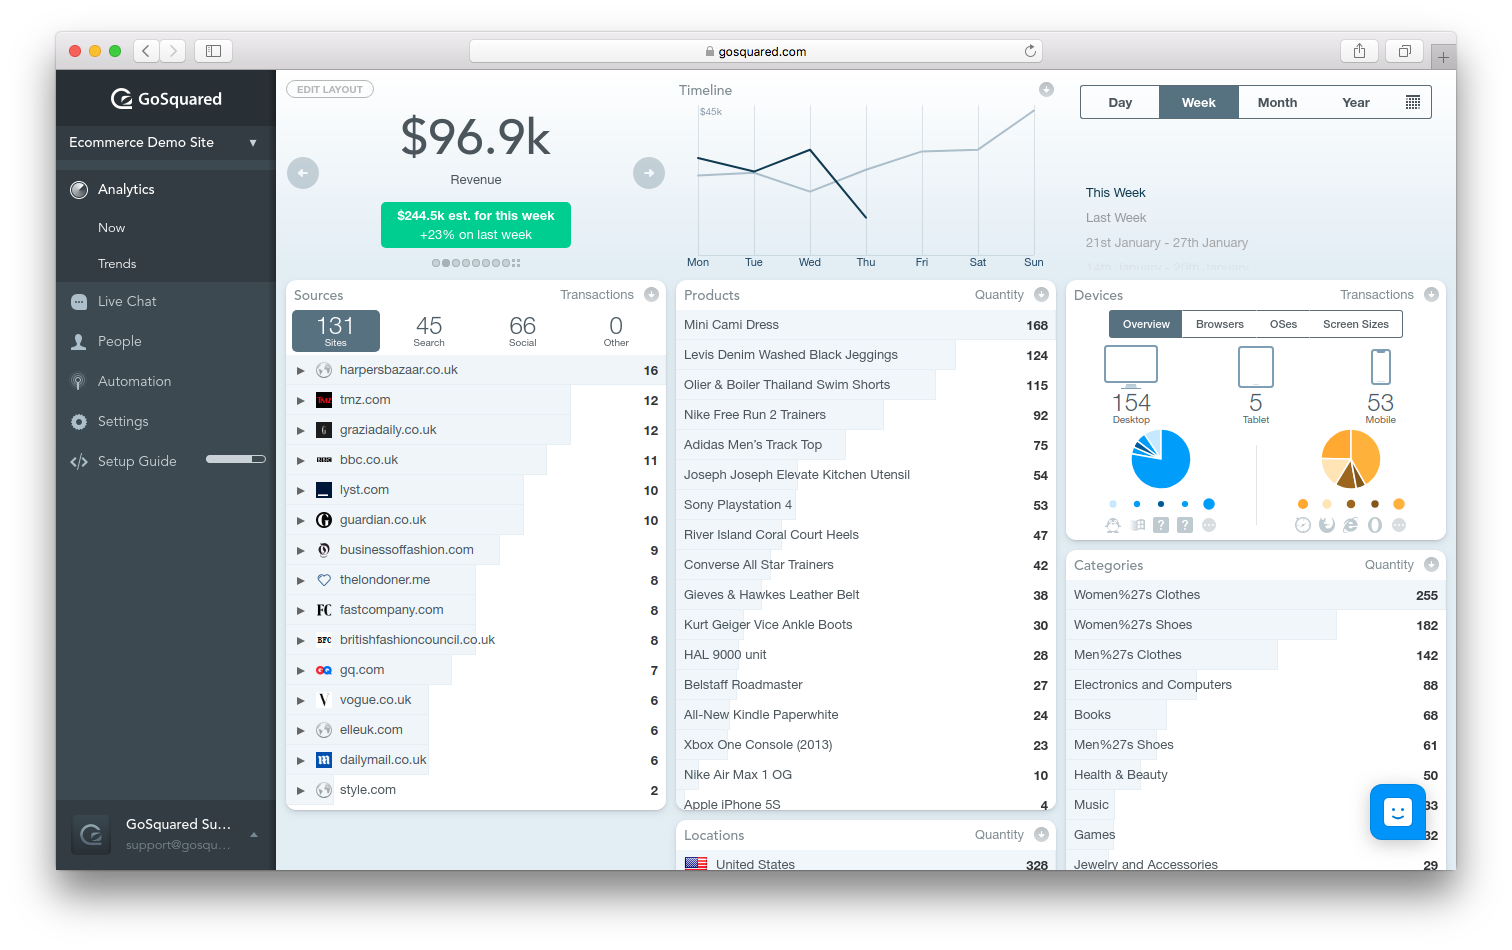
- E-commerce Analytics Dashboard – This is one of the newest forms of dashboard that is extremely useful for e-commerce site owners. It lets you answer the question: “What happened on your e-commerce site on any given day, week, month or year?”:
Price
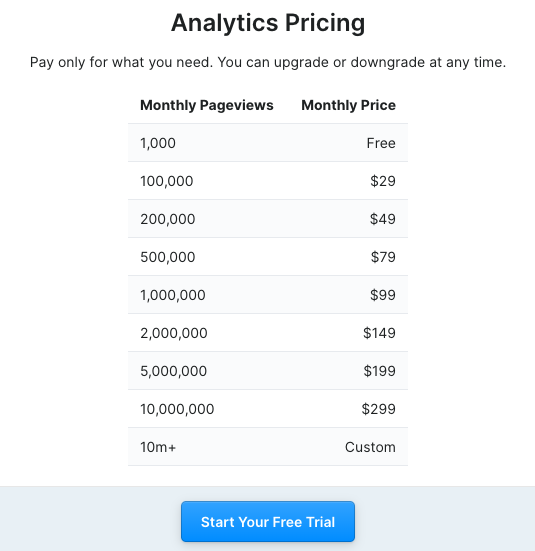
For smaller websites that get less than 1,000 page views per month, this tool is free to use. For page views above 100,000 each month, there is a charge of $29/month. Charges increase depending on the number of pageviews your site receives:
Why Choose GoSquared?
If you are looking for a faster real-time analytics solution for your website, then GoSquared is your best bet. There is no waiting time with GoSquared because this tool is not built around “batch processing.” Everything loads in a flash and your reports are ready to use within seconds.
Related Content:
- What Gets Measured Gets Managed: How to Use Metrics to Boost Performance
- Everything You Need to Know About B2B Performance Metrics
- How to Use Predictive Analytics for Better Marketing Performance
- How To Measure Your Content Marketing ROI With Google Analytics
2) Matomo
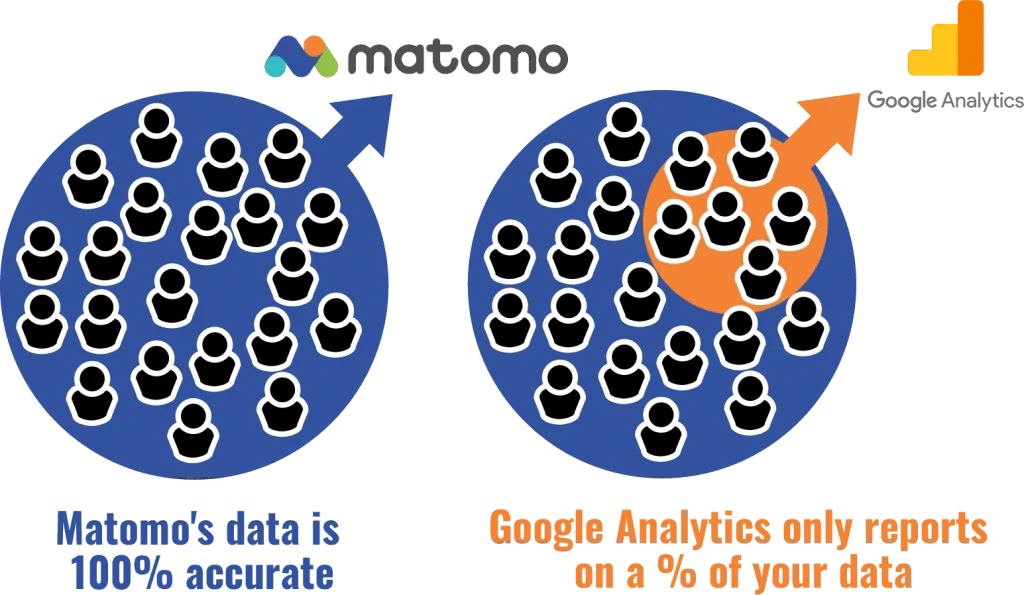
Matomo (formerly called Piwik) is a powerful web analytics platform that lets you take full control of your data. This platform is reliable and secure to use and provides log server analytics if required. All the guesswork related to your data is removed, leaving only 100% accurate data:

Top Features
- Every time you reach a particular limit in your Google Analytics account, the data reporting is capped, which means it then becomes a guess. This is not the case with Matomo. You get 100% accurate data every time without any limits:
- You can get the help of heatmaps, A/B testing, form analytics, white label reporting and enhanced visitor profiles to understand your data and make better business decisions.
- With the help of the visitor profile feature, you can see the exact life-time journey of an active user. You are able to see when the user returns, why the user returns, what action they take and when they prefer to purchase.
- Matomo displays the keywords that are sending traffic to your site along with ranking positions and unbiased search engine reporting.
Price
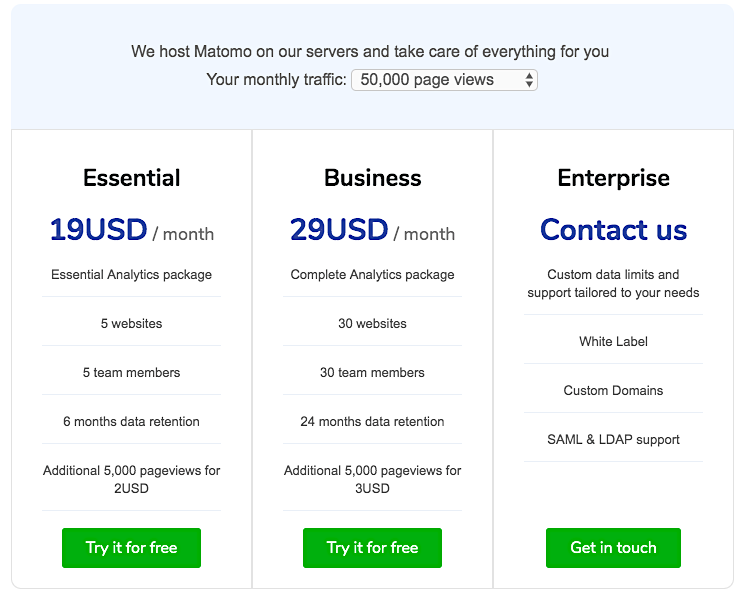
There are three packages offered by Matomo: Essential, Business and Enterprise. For a site with monthly traffic of 50,000 page views, you can start with the Essential option for $19 per month where you are able to capture data for five websites. The Business option starts at $29 per month that lets you capture data for 30 websites, and for the Enterprise option you must call them for customized pricing:
Why Choose Matomo?
This is an all-in-one premium web analytics platform where you get a whole range of features, including SEO, conversions and analytics. There is no data sampling, which means that all your data is reported 100% accurately. Last but not least, you and you alone remain the owner of your own data.
3) Heap
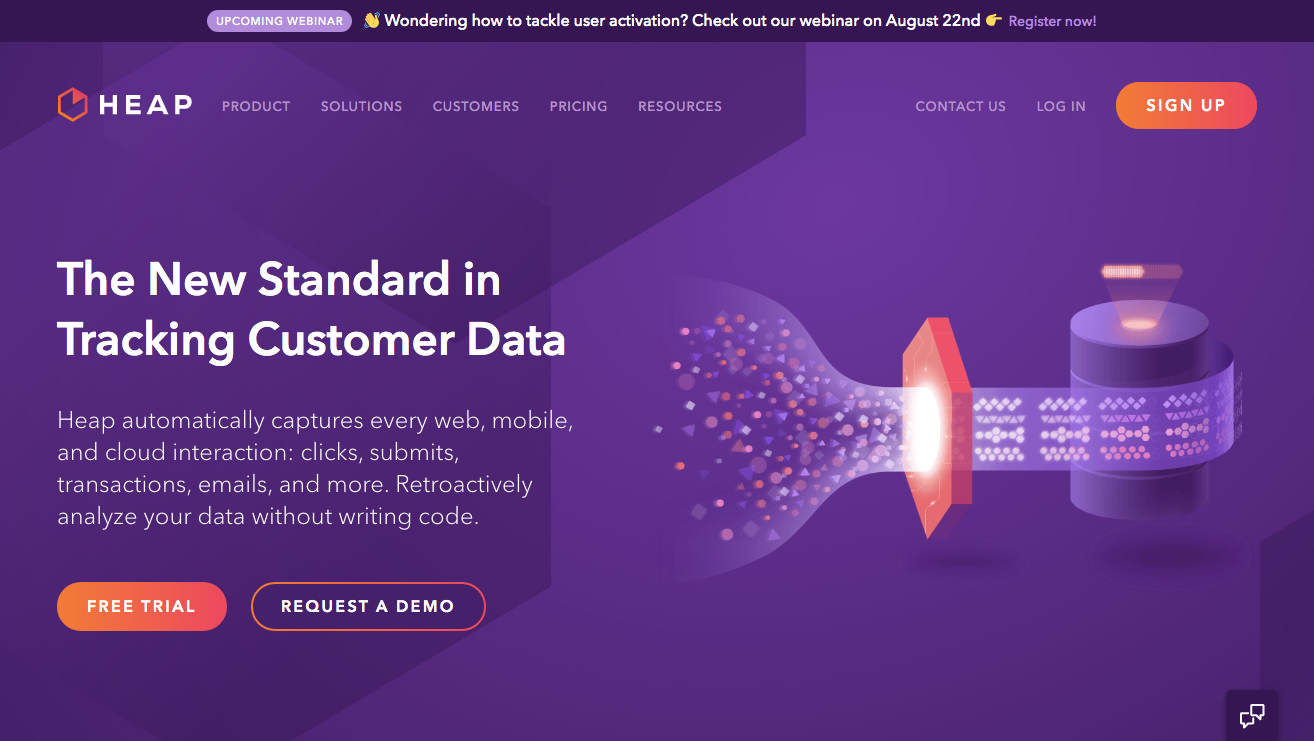
Heap is a new-age data analytics solution that aims to capture the complete customer dataset. The platform automatically captures every web, mobile and cloud interaction accurately:
Top Features
- Heap captures, virtualizes, identifies, connects and analyzes data for you. All this happens automatically and your dashboard presents you with a complete view of what’s happening in your website.
- The auto-capture feature automatically captures every click, form fill up and pageview. Every bit of information is captured on your website or mobile app without the need to add any extra pieces of coding.
- You are able to get data on every interaction retroactively, thereby ensuring high-quality data.
- The snapshot feature lets you codelessly capture data from a page without the need to change any code:

- You can leverage the power of product analytics to understand how users interact with your product and prioritize product enhancements.
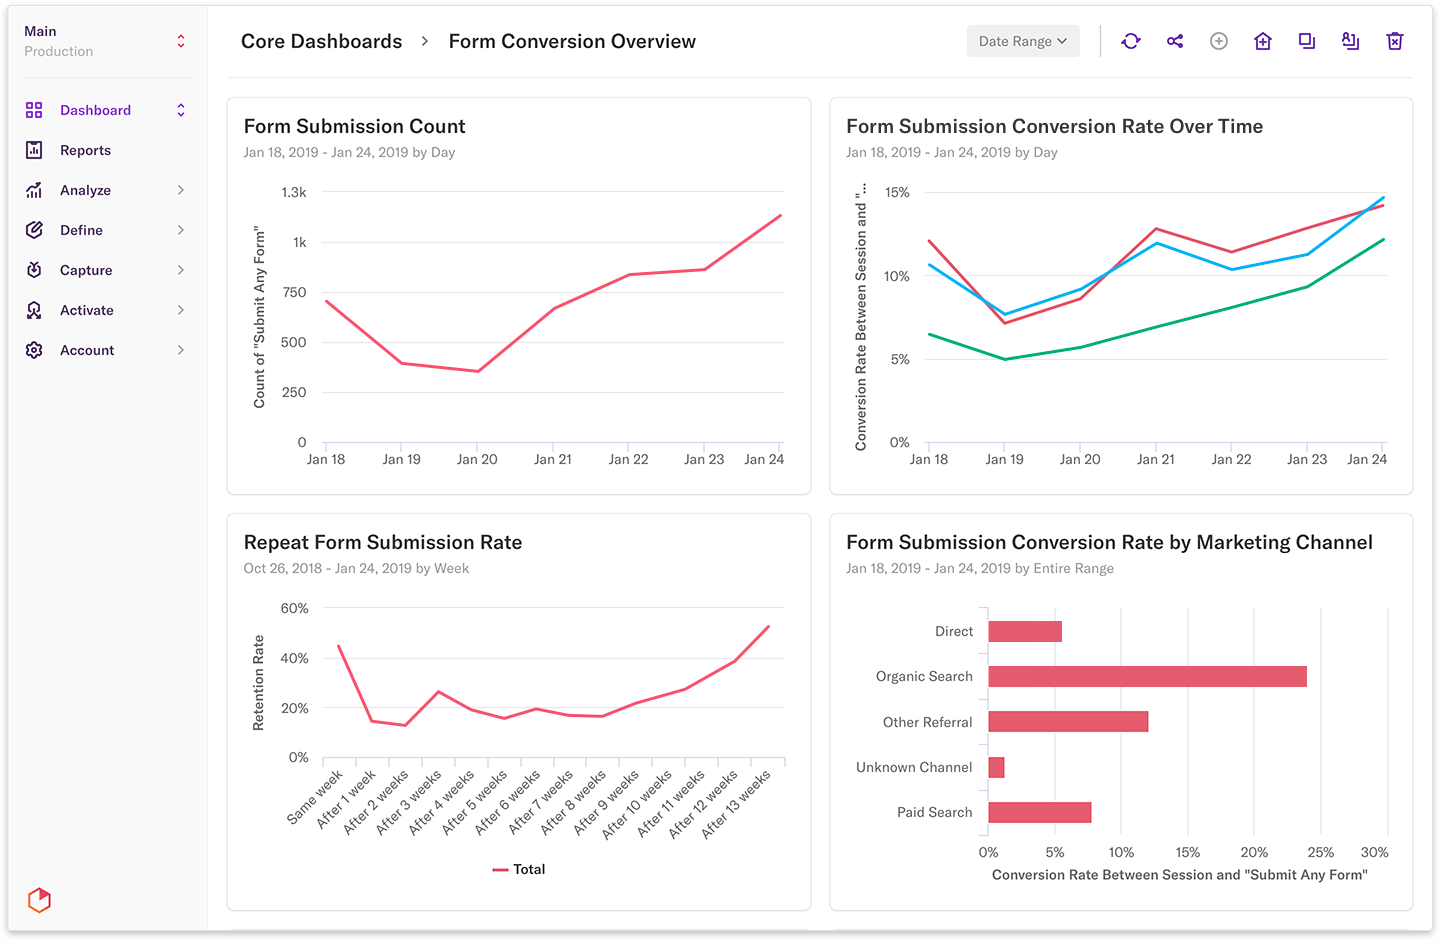
- The form conversion overview report lets you analyze the form submission and conversion data by marketing channel so that you know which channels are generating the maximum ROI:
- Heap offers single-click integration with CRO platforms like Optimizely and VWO so that you are able to analyze the effects of A/B tests.
Price
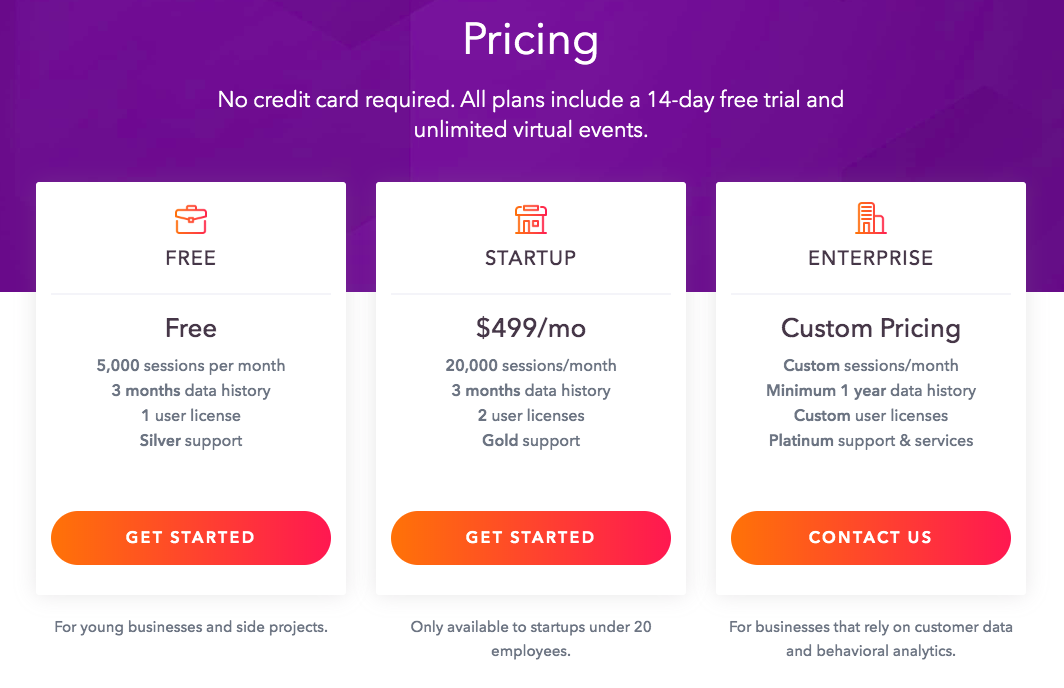
Heap offers three price packages: Free, Startup and Enterprise. The first 5,000 sessions are free with the aptly named Free option, for up to 20K sessions each month it costs $499, and if you have more than 20K sessions each month then you need to opt for the Enterprise plan with custom pricing:
Why Choose Heap?
Heap is an easy-to-use analytics platform that collects data from the very beginning. You don’t have to define all your data points because it starts collecting info from every data point right away and you can view it all at a later stage. You can even track minute data points like the click on any specific URL of your website even if it’s contextual.
4) Clicky
This is one of the most underrated analytics tool that lets you track, monitor and analyze your traffic data in real time. It is a powerful combination of simplicity, value and competence.
Top Features
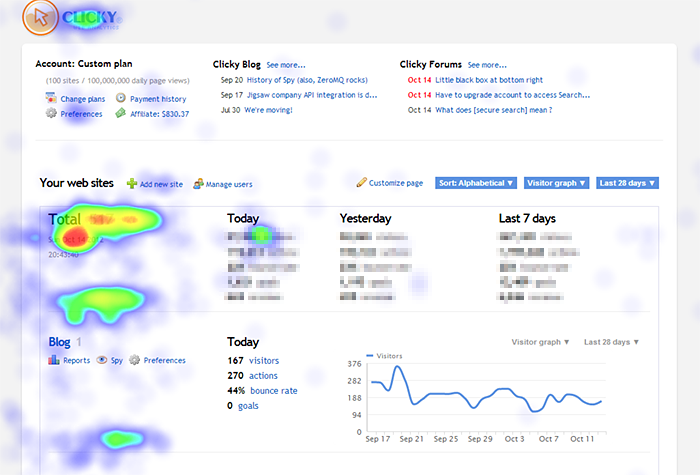
- Clicky displays visitor data from the current day (by default) so that you don’t need to filter the data every time you log in to the dashboard.
- This tool makes it easier for you to see what your visitors did when they visited your website.
- You have the power to launch heatmaps from the widget without the need to leave your site.
- You can view heatmaps by page, visitor or segment. The heatmaps display where visitors are clicking on your pages so that it becomes easier for you to optimize pages for more conversions:
- Clicky also monitors your website and sends you alerts in case your site is down or any other issue happens.
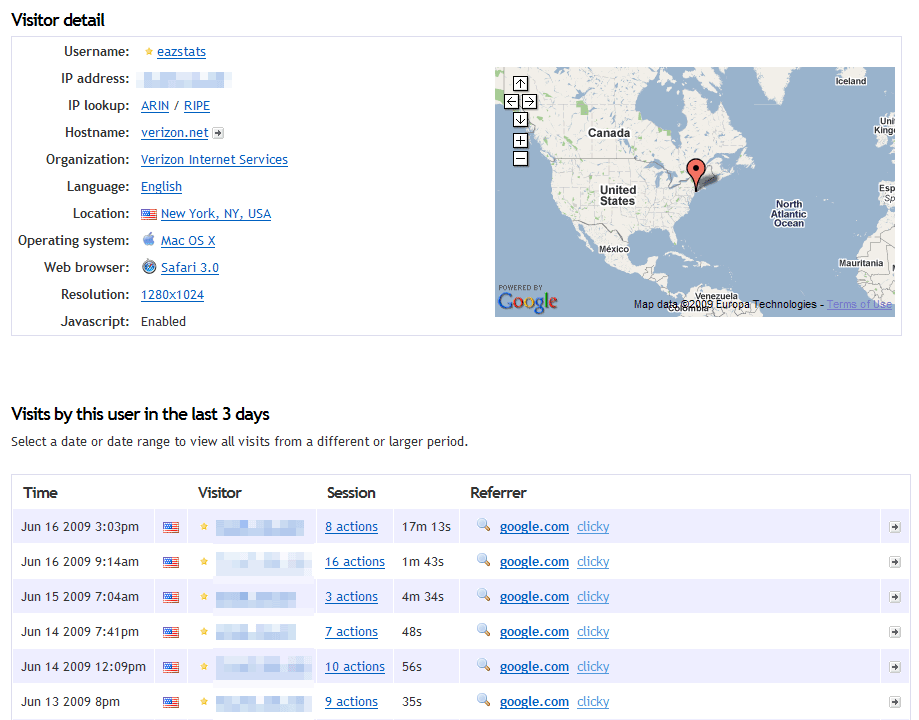
- It displays every visitor detail so that you know who your visitors are and what they do on your website:
- This is the first web analytics platform to offer real-time campaign tracking, which means that you don’t need to wait for 24 hours to start seeing the data. You will be able to know what’s happening on your website immediately.
Price
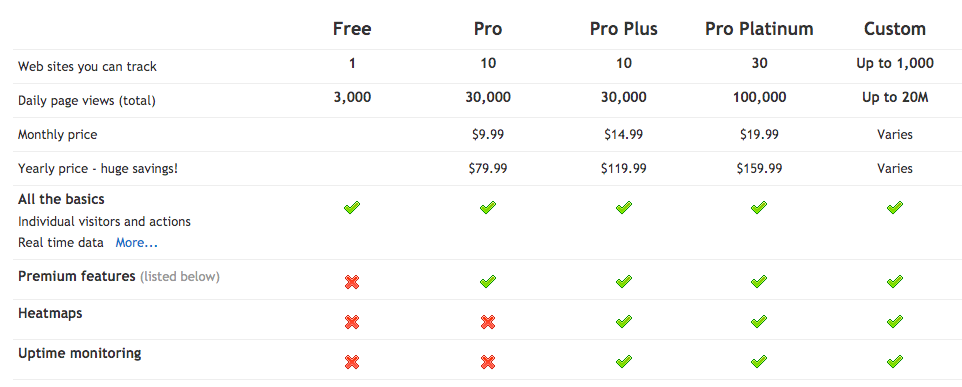
Clicky offers five pricing options, depending on how many websites you want to track or daily pageviews you get. Up to 3,000 daily pageviews is free. The pro plan starts at $9.99 and you can track 30,000 page views daily. If you want to use the heatmaps then you need to subscribe to the Pro Plus version which costs $14.99 per month. For 100K daily pageviews go with the Pro Platinum plan, and more than that (up to 20M pageviews) puts you at the Custom option with varied pricing:
Why Choose Clicky?
If you want to see high-level detail on every segment, then Clicky is the tool for you. Every single report is maintained in real time and you can see individual visitors and their actions.
The biggest advantage is that the tool automatically blocks spam bots through its advanced bot filtering feature. This means that the data you have in your dashboard is a real measure of the quality traffic your site is receiving. There is no further filtering required to eliminate spam traffic.
Related Content:
- How to Optimize Your Site for Search Ranking with Your Web Analytics Data
- How to Use Big Data Analytics to Grow Your Marketing ROI
- 9 Mission-Critical Lead Generation Metrics You Need To Track
- How to Optimize Your Content Strategy with the Buyer’s Journey
5) Woopra
Woopra is the analytics platform that lets you optimize for every touchpoint in your customer journey. It offers full funnel attribution, feature usage trends, cohort analysis and much more. It lets you easily understand what customers are doing on your website so that you can better optimize it to drive growth and customer retention.
Top Features
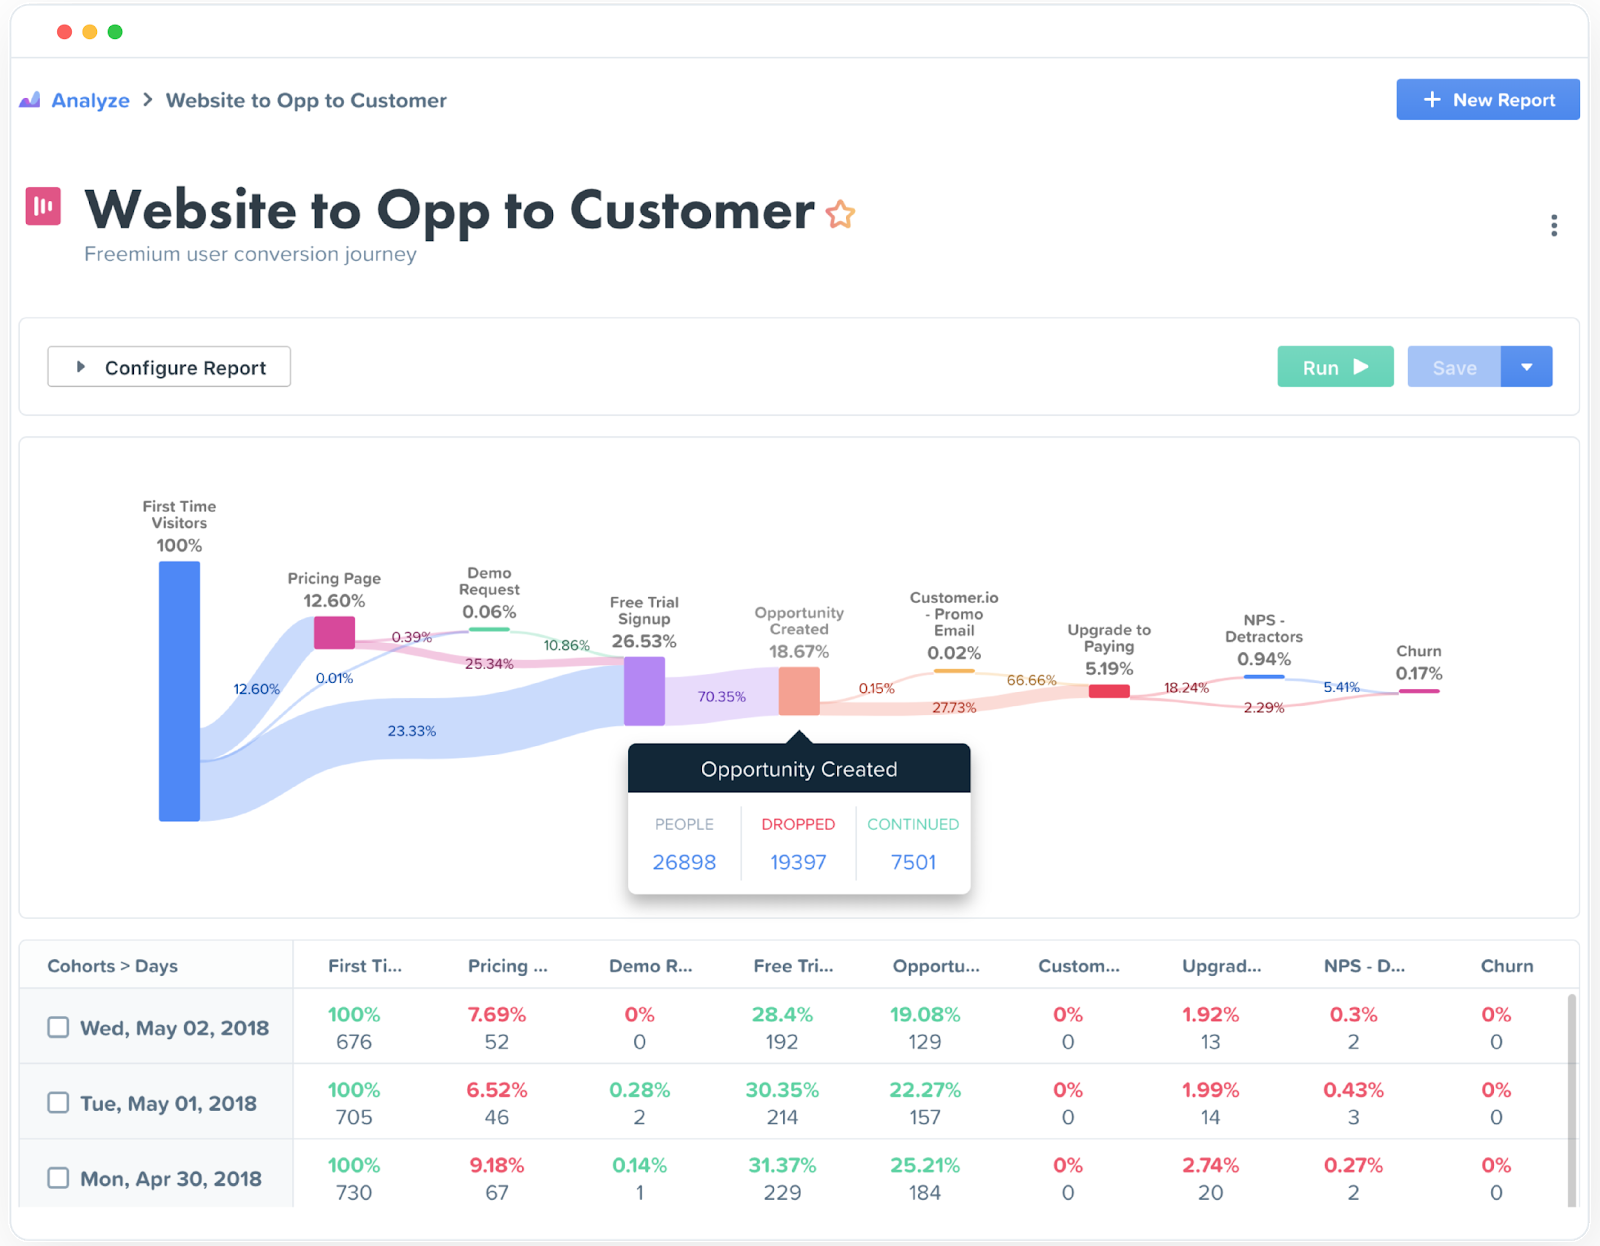
- Woopra analytics dashboards not only display data, but lets you find answers to questions like “How do onboarding emails impact conversions?”, “Which article topics gets the most pageviews?”, “Which channels drive maximum sign ups?” etc.
- With the help of the Journey reports, you can quickly identify customer behavior and respond to it. The report displays the journey of every unique customer visiting your site, thereby helping you drive more conversions and improved customer retention.
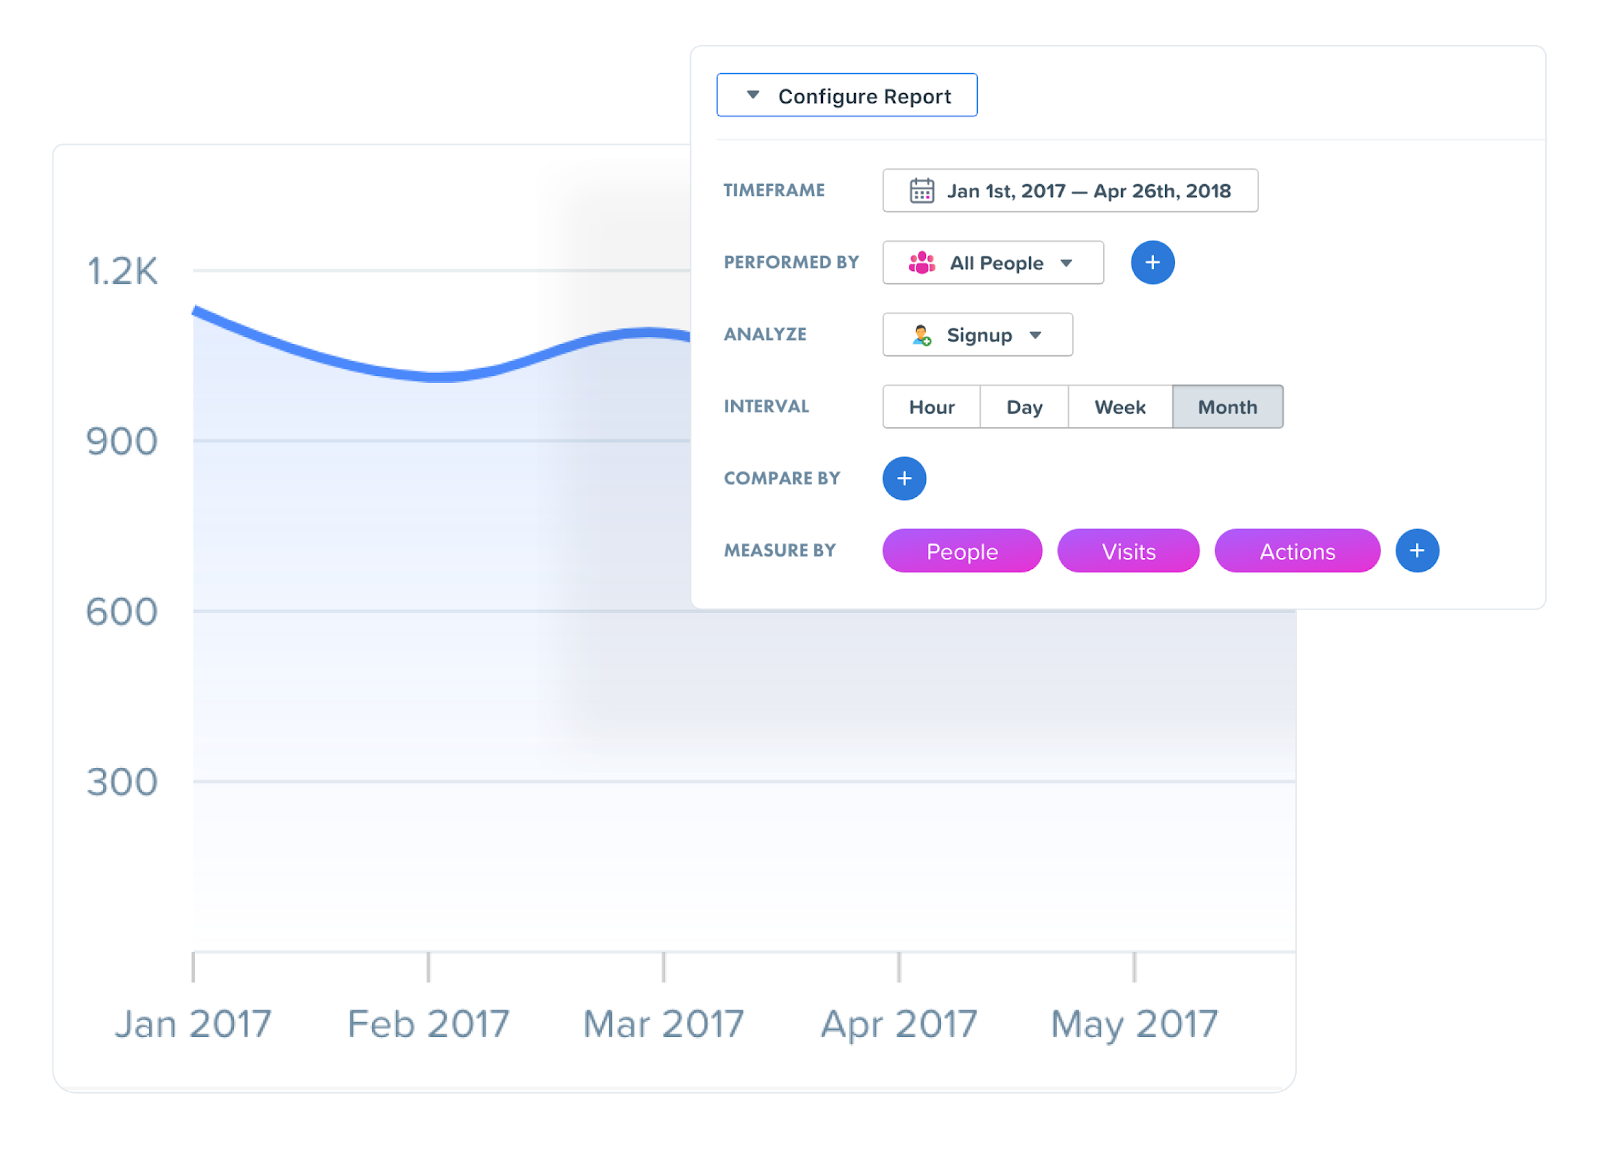
- The Trends report is particularly useful for e-commerce websites as they allow you to measure the performance of every product that drives long-term success and revenue. You can dig deeper to analyze data using different dimensions such as location, version, subscription type and more:
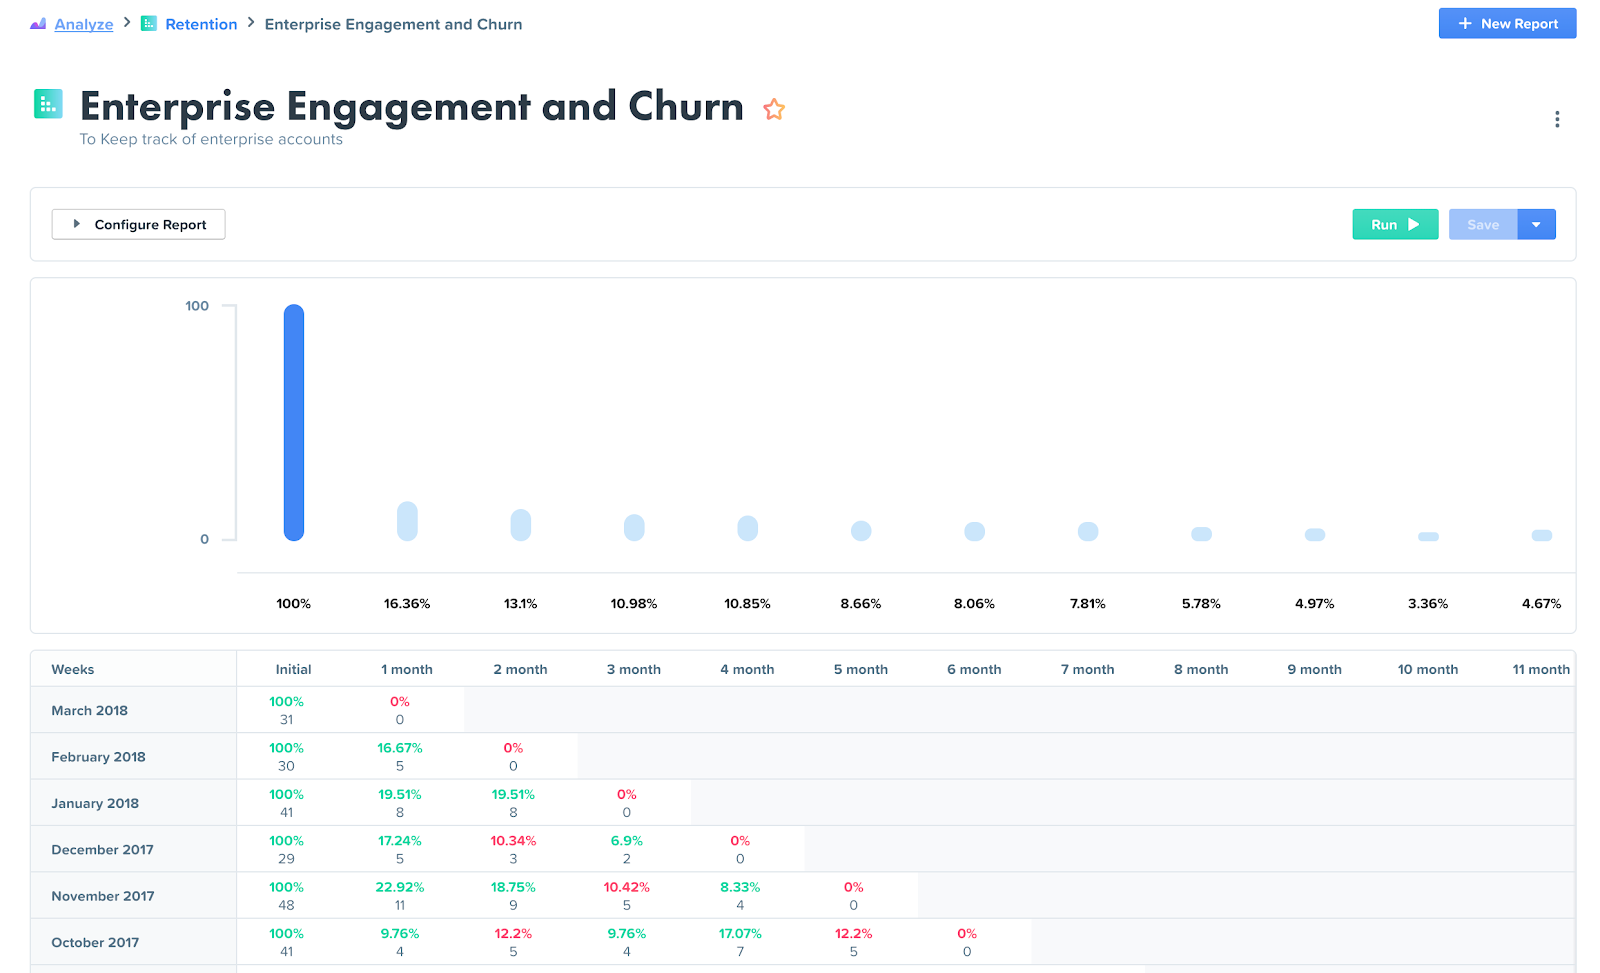
- The Cohort Analysis report will help you understand if users continue to perform actions like logging in, using product features or opening emails. You have the ability to measure the churn rate in seconds:
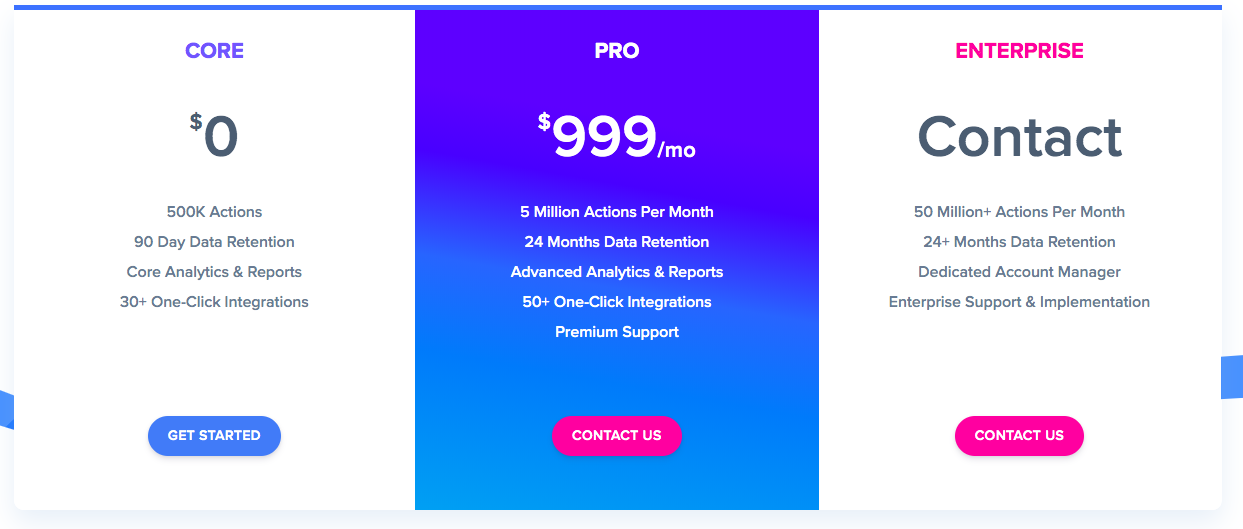
Price
The core version is free to use where you can track around 500K actions. The Pro version costs $999 each month and you have the option to track 5M actions each month. And the Enterprise version requires that you call for customized pricing:
Why Choose Woopra?
Woopra lets you analyze stats in real time and displays a stream of live updates of what users are doing on your site right now. You can also track the path of every individual user so that you can optimize the customer journey.
6) MixPanel
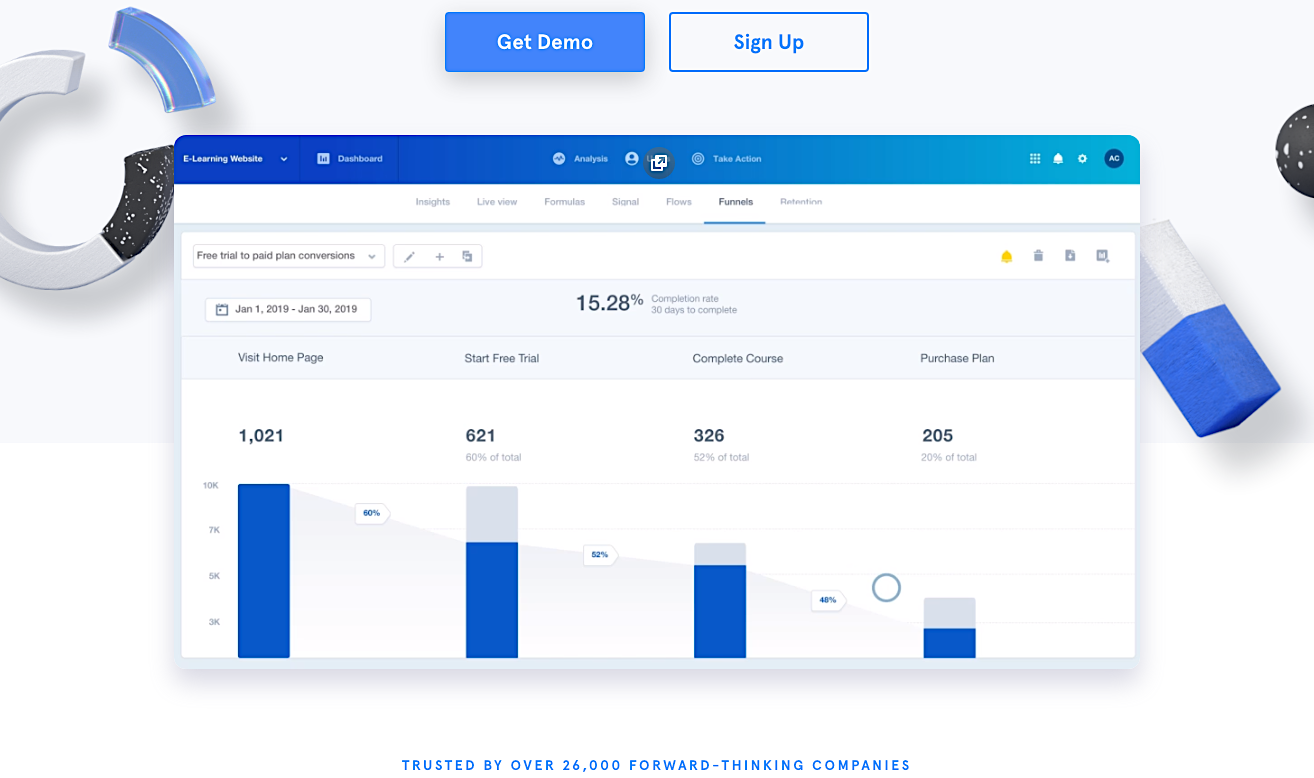
MixPanel is trusted by over 26,000 companies, including Samsung and Expedia. It is much more than just an analytics platform: It is a complete package to build and make decisions as a product or service team. You can measure user behavior and its impact on your business goals.
Top Features
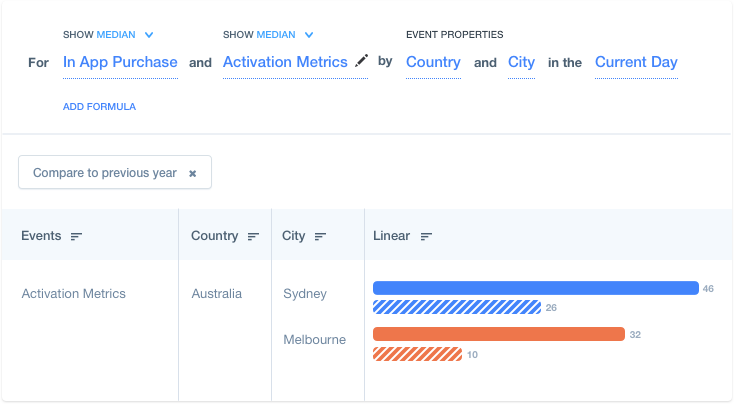
- You can quickly segment the data on the basis of time, browser, device or any other metric, and even visualize your data by comparing it with the performance of the previous year:
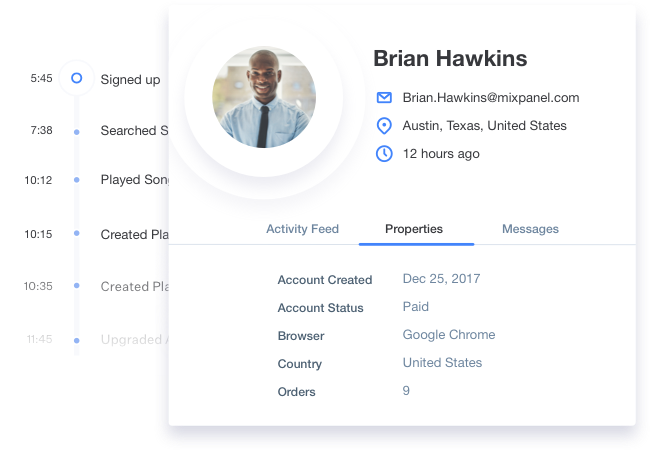
- You can get complete data about every user who visits your website. You are able to see what actions they take on your site and what roadblocks they encounter when trying to convert. This helps you to better optimize your website for every individual visitor:
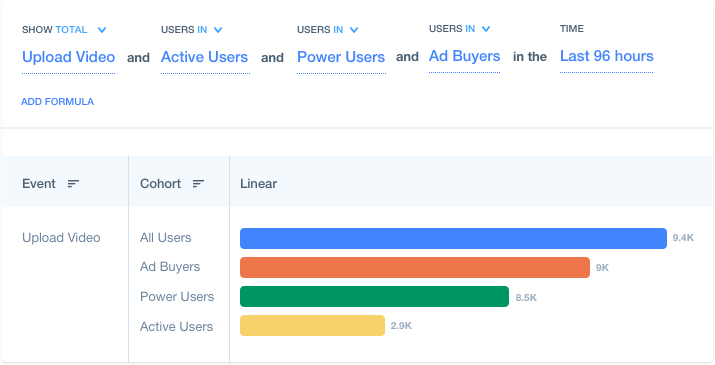
- With the help of Cohort Analysis, you are able to compare how different groups of users behave:
Price
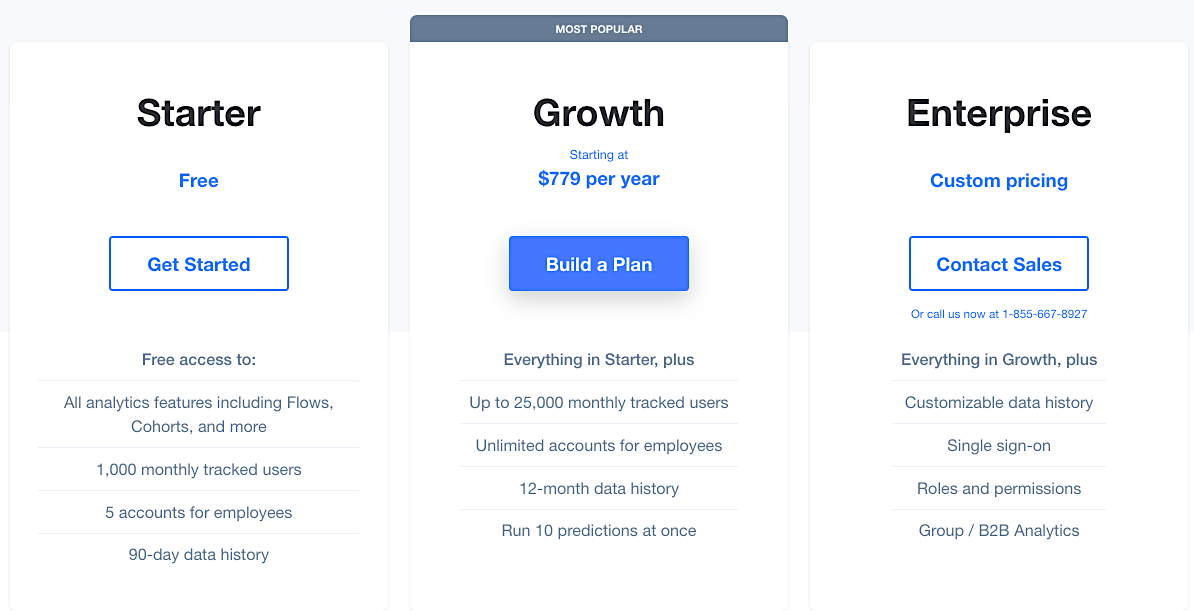
The Starter package is free for up to 1,000 monthly tracked users. The Growth option starts at $779 per year where the tool will track up to 25,000 monthly users. For the Enterprise pack, you need to contact MixPanel for custom pricing:
Why Choose MixPanel?
MixPanel sees everything in terms of events rather than pageviews. It tracks each and every stage of the buyer funnel with unique events. Funnels can be segmented on the basis of properties and you can run reports instantly without having to wait. If you have a conversion funnel that requires handling many events, then MixPanel is the analytics tool you should definitely use.
7) GoAccess
GoAccess is an open-source web log analyzer that displays a real-time dashboard in HTML format. This tool makes use of log file parsing (the good ol’ technique) to measure traffic coming to your site.
Top Features
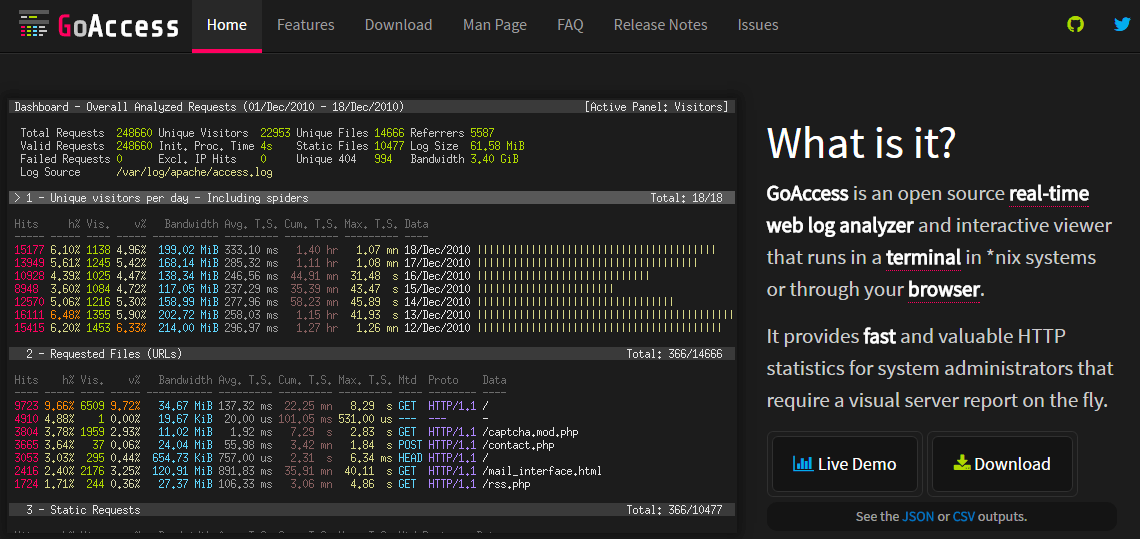
- GoAccess offers both terminal and HTML interfaces and can be used as a primary tool for identifying web server issues:
- It renders data rather quickly and the HTML display of reports is impressive.
- It continuously monitors web server logs and provides real-time analytics.
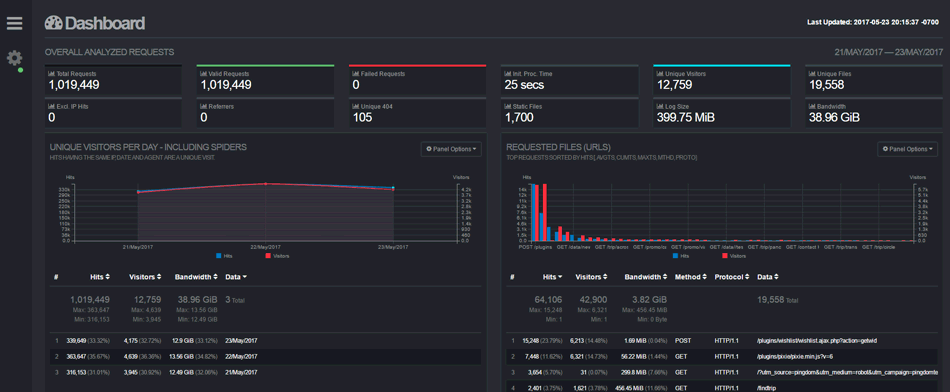
- You can see a dashboard similar to this one:
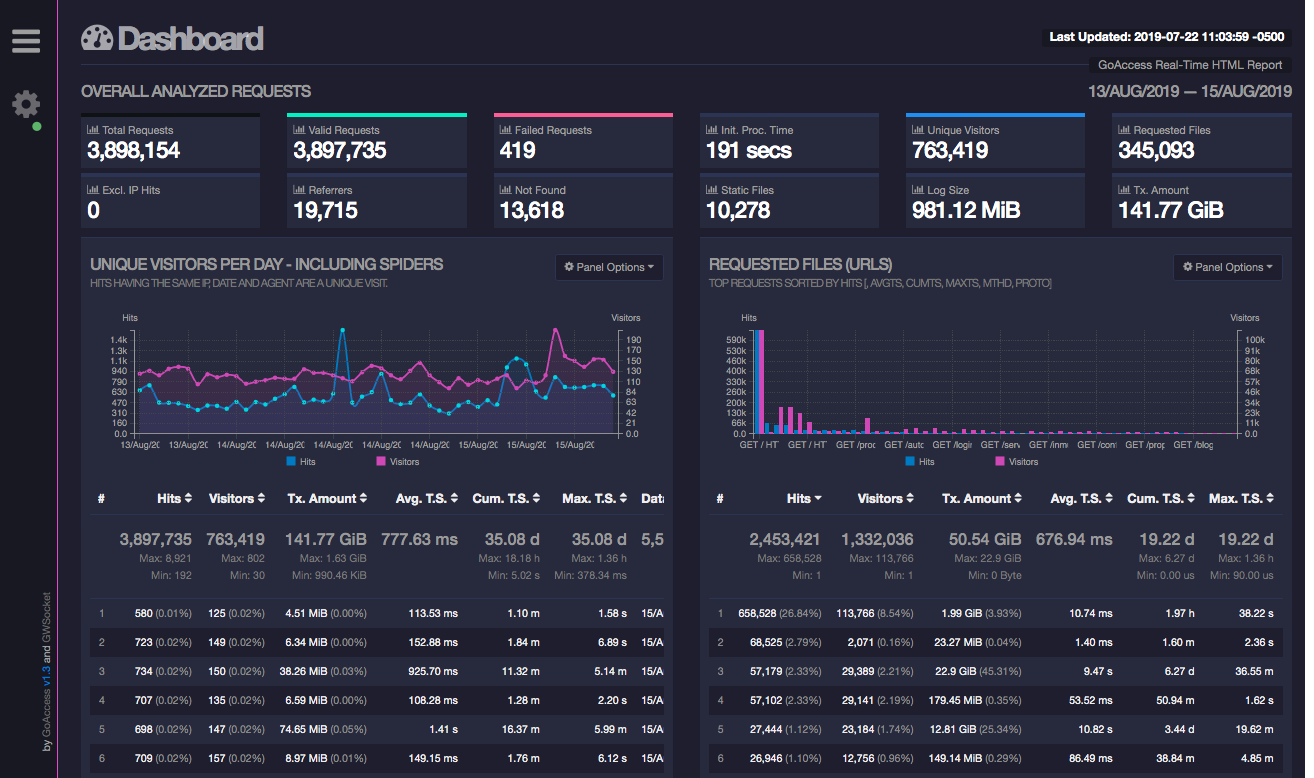
It displays the number of unique visitors per day including spiders, as well as a list of not found URLs, top referrer URLs, top keyphrases from Google, country sorted by unique hits and HTTP status codes.
Price
GoAccess is a free (MIT Licensed) and open-source tool.
Why Choose GoAccess?
GoAccess offers a simple HTML report where you can see all the real-time movement of traffic. If you are looking for an alternative GA tool for tracking user data with live updates, then this is the best tool for you. The HTML reports are clean and easy to understand.
8) Open Web Analytics
OWA is another great alternative to Google Analytics. It is simple, free to use and open source. You can download and use the software to identify how people use your website or applications.
Top Features
- The main reporting dashboard mimics the appearance of Google Analytics, which makes it fairly intuitive to use if you’re already familiar with GA. You can see the number of unique visitors, page views, average visit duration, total revenue, total transactions, bounce rate, etc.
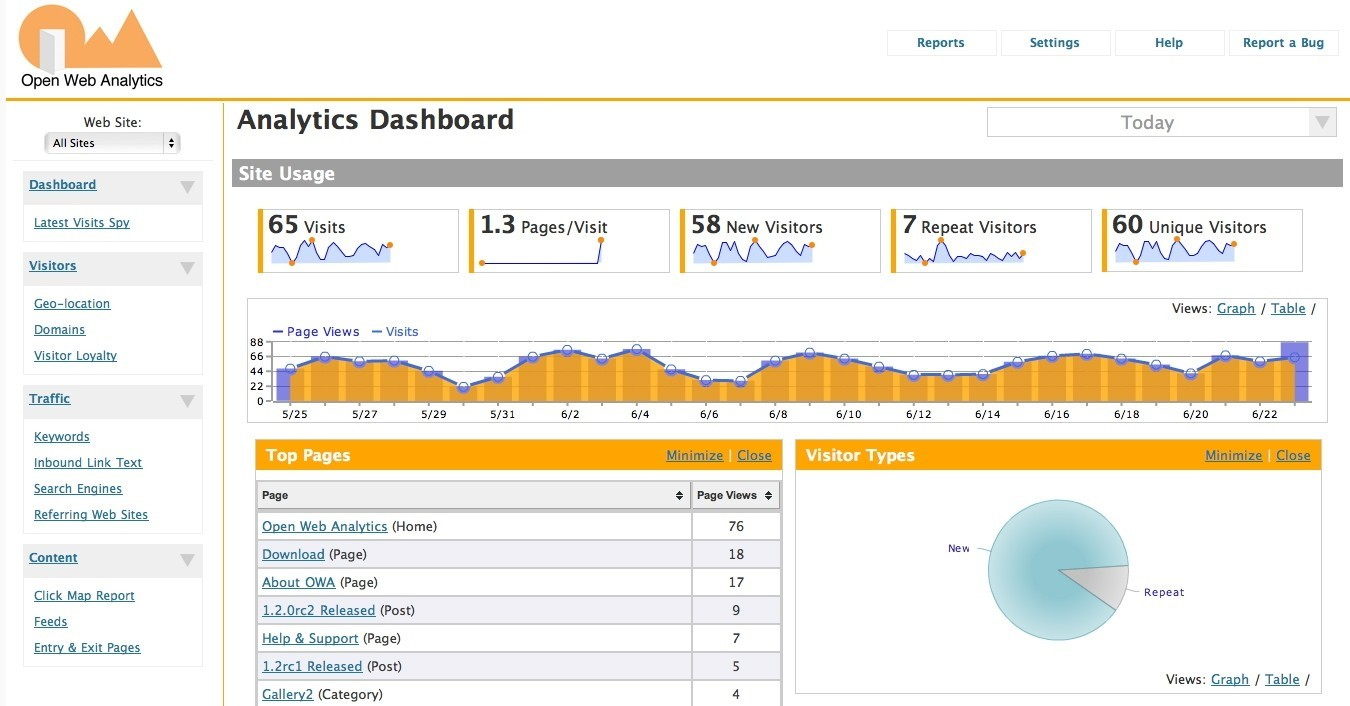
- The main report presents the top content on your site, the top referring sites, the top traffic sources and the latest visits.
- The e-commerce report displays the total revenue across all transactions sorted by date. You can also see the number of visits and the number of days that users took to purchase items from your site.
- You can track an unlimited number of websites and even use heatmaps to view the areas that receive the most clicks on your site.
Price
OWS is open source and free to use, although they do accept donations.
Why Choose Open Web Analytics?
OWS is a great Google Analytics alternative and the best part is, it mimics the appearance of GA. This makes it easier for people who have used GA to use this tool. There are some WordPress-specific features available, like tracking users by WordPress username or email address, tracking all page types by posts or archives, tracking the number of comments and tracking the number of subscribers.
Related Content:
- The 7 E-mail Marketing Metrics that Actually Matter and Why
- Creating Google Analytics Funnels and Goals: A Step-by-Step Guide
- 5 Ways to Track Your Website’s Revenue with Google Analytics
- Here’s How to Use Web Analytics to Boost Content Marketing Performance
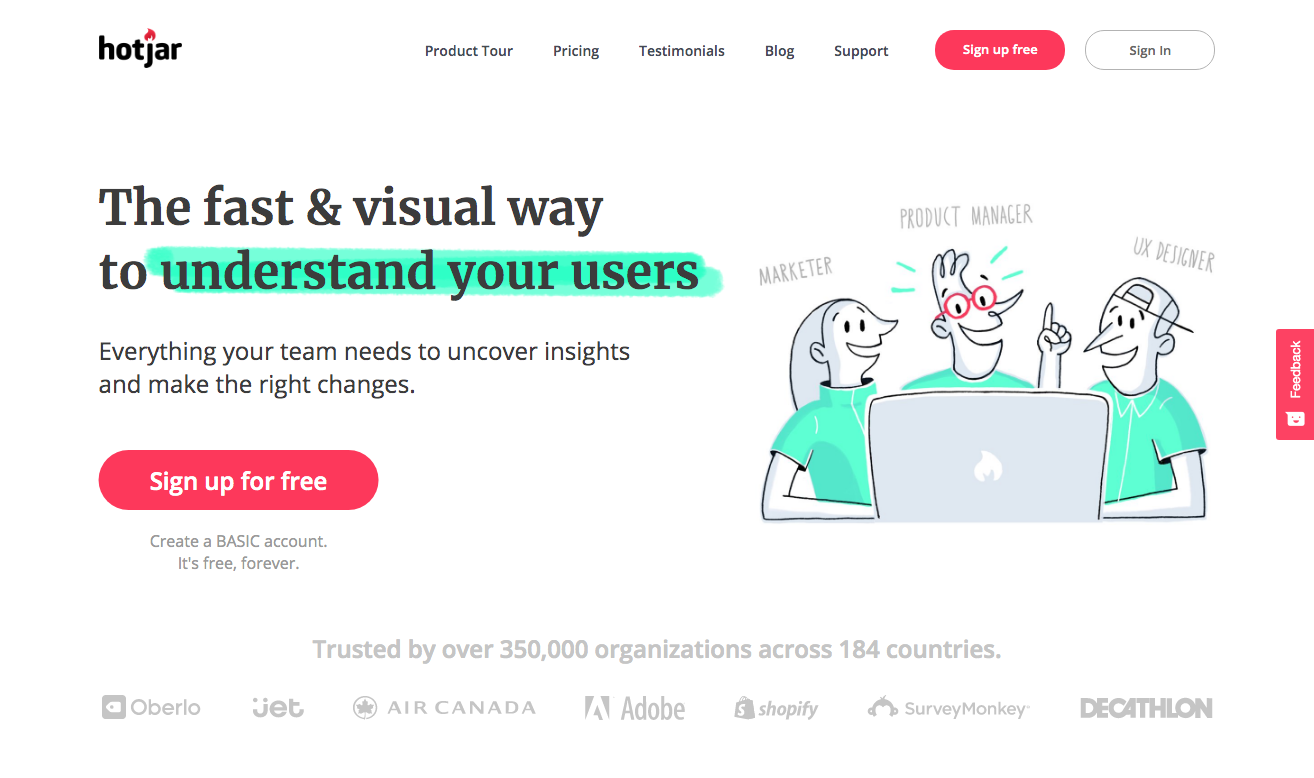
9) Hotjar
Hotjar is a visual analytics platform that not only gives you information about site visitors, but also lets you know how visitors react when they visit your site. You are able to understand what drives them to take action and which elements on your site receive the maximum engagement.
Top Features
- This tool helps you gather qualitative data instead of quantitative data, which means that it doesn’t show you just numbers that need further processing to extract meaning. Rather, it displays the meaning of the numbers so that you can make decisions instantly.
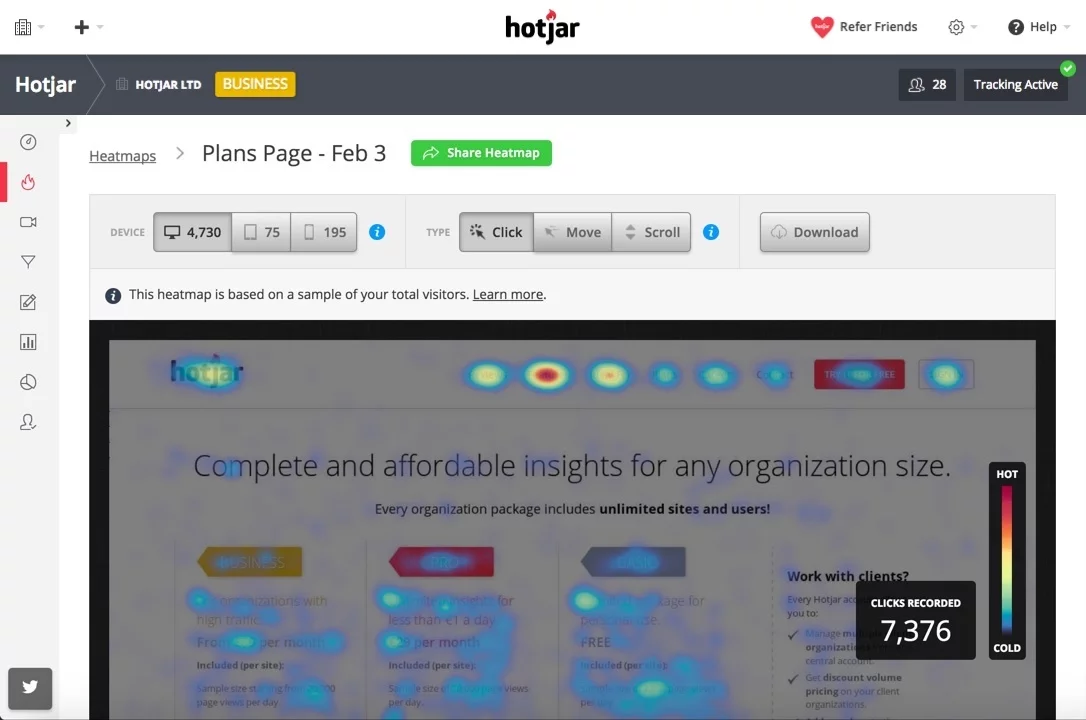
- It provides a visual representation of visitor clicks. With the help of heatmaps you are able to see the exact elements on your site that are liked by visitors the most.
- Hotjar lets you analyze user behavior with the help of different types of heatmaps like Click Heatmaps, Scroll Heatmaps, Move Heatmaps and Download and Share Heatmaps:
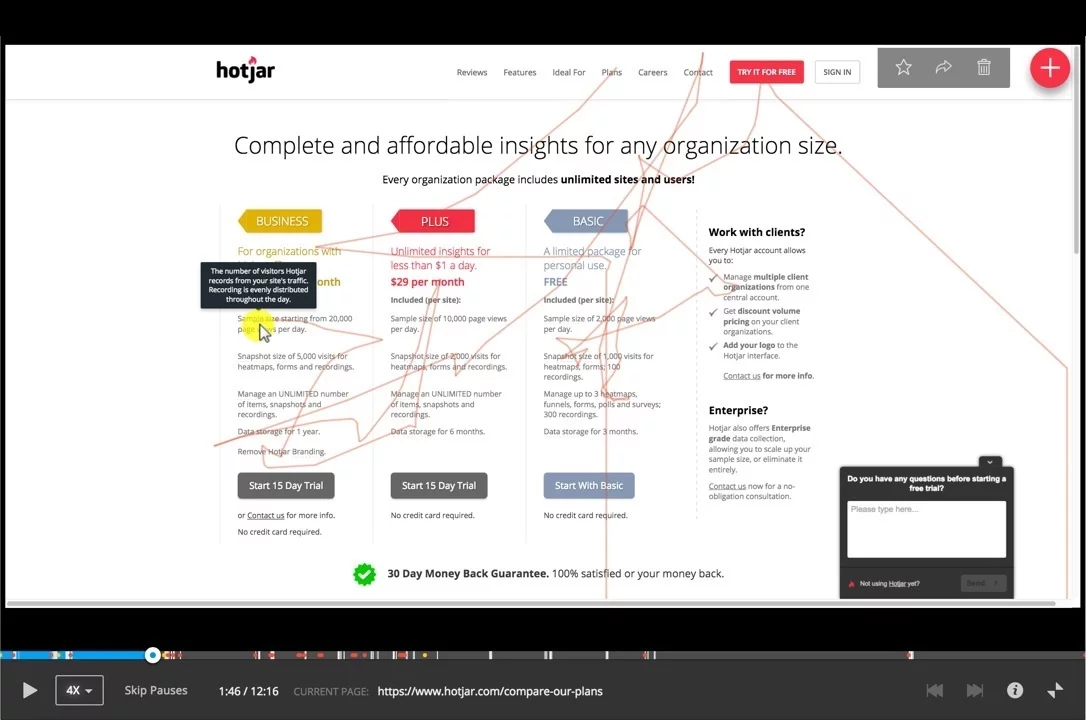
- The best feature of Hotjar that I like the most is visitor recording. You are able to see a video of how a user interacts with your website, like which pages they visit, what information they read, which links they click on, etc. This is a great way to understand user behavior and optimize your site accordingly:
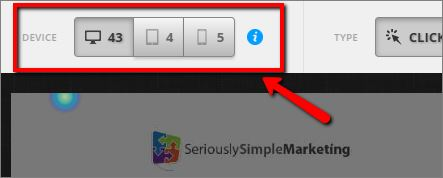
- Hotjar shows you categorized information on heatmaps. Visits received via desktop, tablet or mobile are shown separately, so that you know the difference in user behavior coming from mobile vs desktop:
- You can get user opinions in the form of surveys and make changes to your site accordingly.
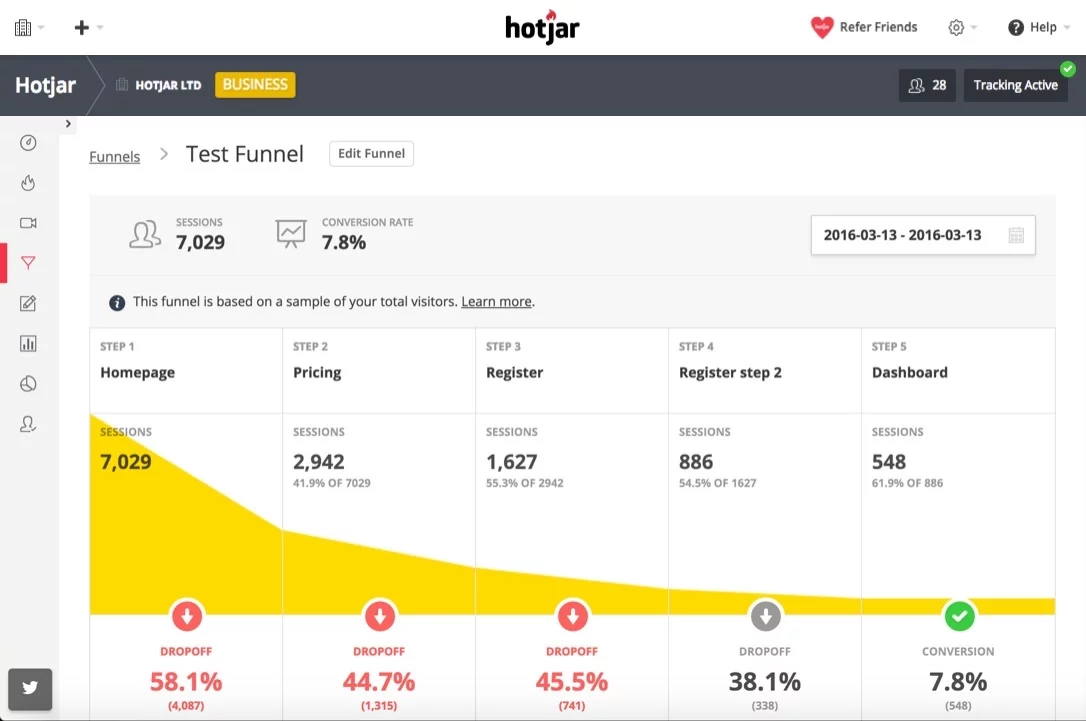
- With the help of properly defined conversion funnel reports, you are able to answer the question “Why are your visitors dropping off?” You can also watch recordings of drop-offs so that you can fix the issue immediately:
- You can perform A/B testing pretty easily and it provides support in over 20 languages.
Price
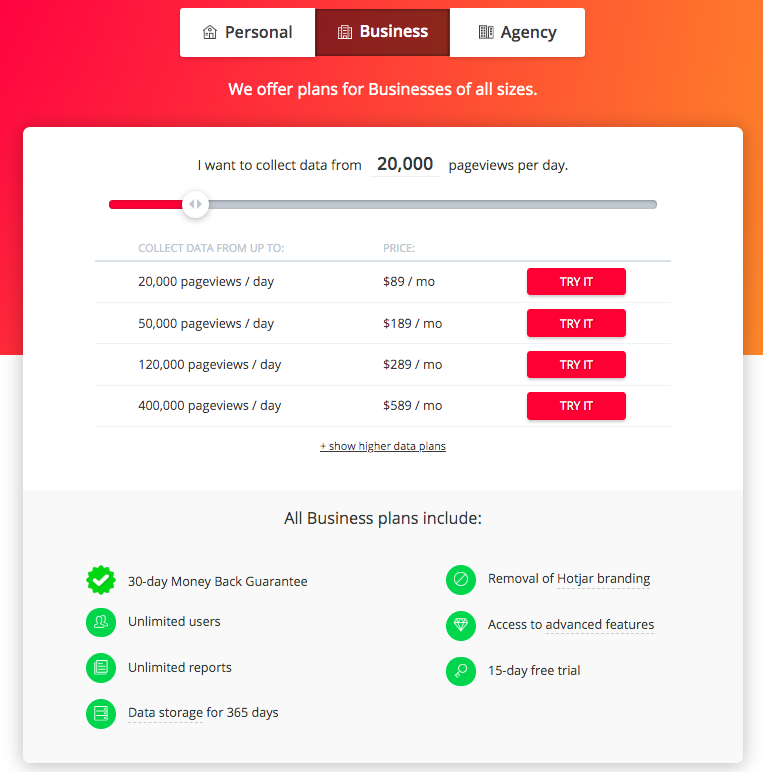
Hotjar offers different plans – Personal, Business and Agency – depending on the pageviews your site receives. For up to 20,000 pageviews per day, it costs $89 a month. For 50,000 pageviews per day, you will have to pay $189 a month. For 120,000 pageviews a day, the price rises to $289 a month. The price further increases with an increase in the number of pageviews:
Why Choose Hotjar?
You don’t need to be an expert to start using Hotjar, as it’s pretty easy to use. The visitor recording feature lets you see the real user behavior on your site, which is something you don’t find in any other analytics tool. You can replay sessions of visitors, tag recordings or share the recording with your team.
If you are struggling with conversions on your site, then Hotjar is definitely the tool to opt for. It offers a combination of analytics plus a feedback suite so that you don’t need to spend time or money on multiple platforms to improve conversions on your site.
Final Thoughts
Analytics platforms are absolutely essential for online business owners. Google Analytics is undoubtedly the most preferred choice but there are other good alternatives that you might choose in conjunction with or in place of GA.
The GA alternatives discussed in this article offer you unsampled data and are much cheaper to use when compared to Google Analytics Premium. Start using these and get complete ownership over your website data!