By Bonnie Crater and Birgitta Hendron
How do you see a customer’s complete journey? Can you see both Digital and Non-Digital Touches? How do I map that against key sales stages like when the Opportunity was created and closed? If you’ve been wondering about these questions, you’re in luck! With Full Circle’s Journey Explorer you can do this from any Salesforce opportunity as part of a tool we call Digital Source Tracker. The Journey Explorer combines all the digital and non-digital touch details into one easy-to-use, dynamic page, all right inside Salesforce.
Who is this Journey about?
The Journey details you’ll see in Journey Explorer are associated with the very first contact for the Salesforce Opportunity. Once you click into the Journey Explorer, you’ll notice it’s divided into 3 sections. Here’s a quick rundown of what each of those sections contains: the Journey Summary, the Journey Chart, and the Journey List View.
Journey Summary
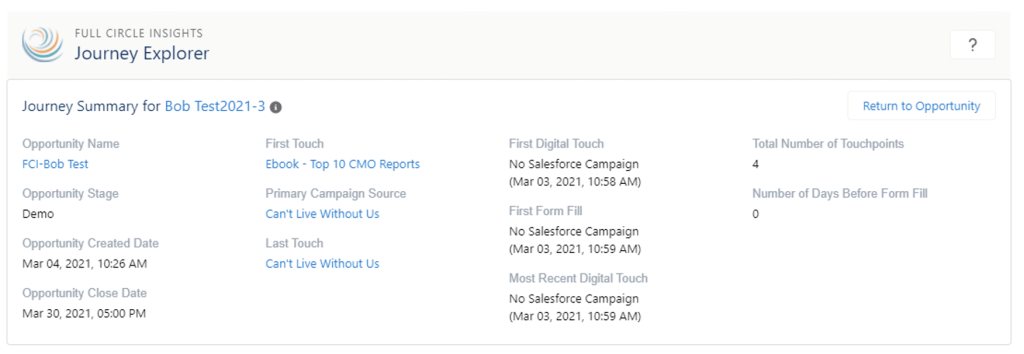
At the top of the page, you’ll find a Journey Summary that gives you an overview of the Contact, Opportunity, digital, and non-digital touches. This section has four columns:
- Farthest to the left, you have opportunity details(Opportunity Name, Opportunity Stage, Opportunity Created Date, Opportunity Close Date)
- Second from the left, you have Salesforce campaign details(First Touch, Primary Campaign Source, Last Touch)
- Second from the right, you have digital touch details(First Digital Touch, First Form Fill, Most Recent Digital Touch)
- Farthest to the right, you have digital touchpoint details(Total Number of Touchpoints, Number of Days Before Form Fill)
Here’s an example of a typical Journey Summary page:
Journey Chart
The Journey Chart section really lives up to its name: It plots the customer journey onto — you guessed it — a chart. But not just any chart! This chart is dynamic, and it shows all digital and non-digital touches. By default, the x-axis is grouped by Week and the y-axis is grouped by UTM Source, but you’re able to change the Time Grouping and the Digital Grouping to best suit your needs.
- Time Grouping options are Day, Week, Month, Quarter and Year
- Digital Grouping options are UTM Source, UTM Campaign, UTM Medium, UTM Content, UTM Term and Property Location
Here’s a sample Journey Chart, abridged for easier viewing in this blog post.
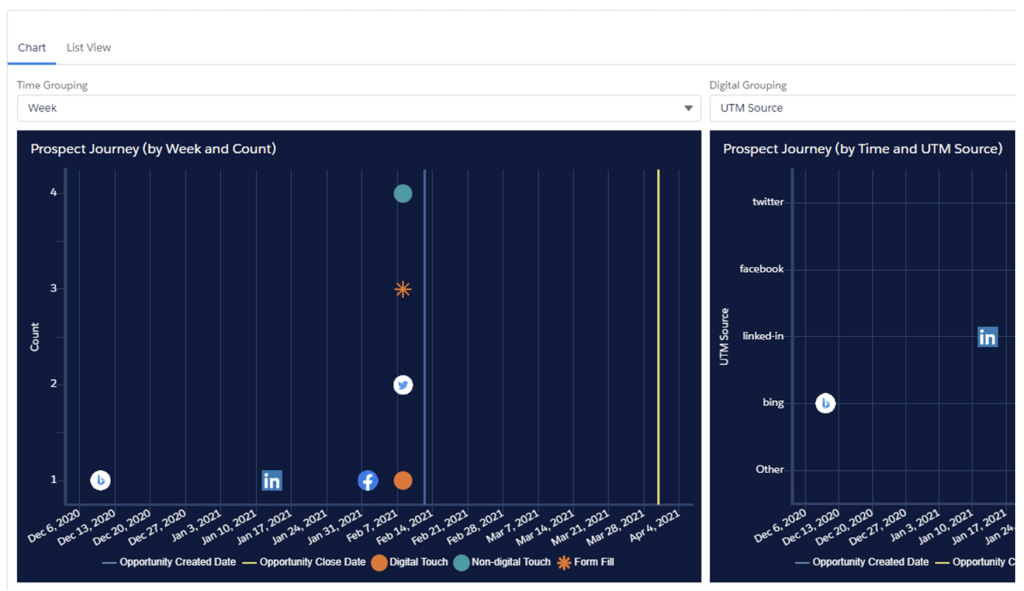
Note that the two charts are designed to give you two different perspectives on the same data. The left chart is designed to show you at a glance how many touches this user had in the selected time frame. The right chart allows you to view the touches based on a specific UTM parameter, or property location.
The chart is quite rich, especially if you have an prospect who is very actively engaging in your marketing. Whether they are clicking on paid or unpaid advertising, engaging in social media, email marketing or your latest webinar, Digital Source Tracker’s Journey Chart will plot every interaction so you can understand how that customer became a customer.
More tips on reading the chart are here:
- Social media icons: Each digital touch gathers available UTM parameter data — including social media touches. To make things easy, we show some of the most common social media icons on the chart where applicable.
- Hovering: When you hover over a data point, details about it will appear.
- Number within a touch: When multiple touches occur on the same day, a number appears on the data point to alert you. To see details on each of the multiple touches, just hover over the data point.
- Time Grouping: You have the option of viewing the graphs by day, week, month, quarter or year.
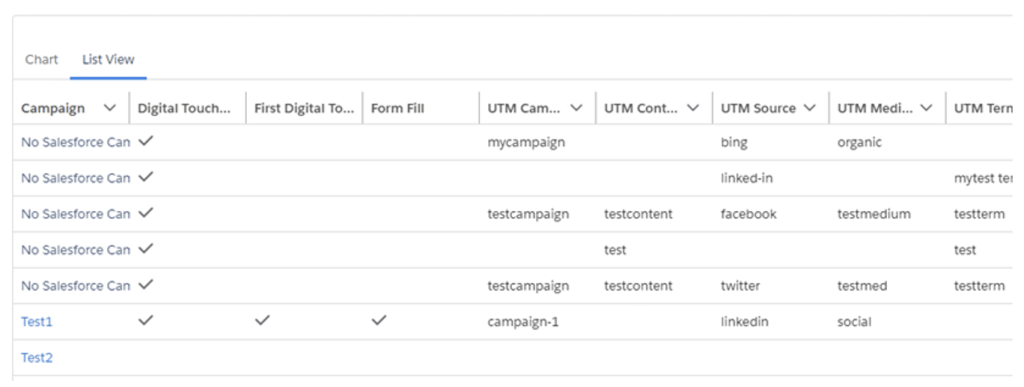
Journey List View
For those of you who prefer a list and not a chart, the Journey List View is for you. It provides a list of all digital and non-digital touches. It looks something like this:
The Journey Explorer answers the question, how did we get this customer? Or what did the customer do to learn about and buy our products? Enjoy this new Full Circle view of your marketing data.
Full Circle Insights Launches Journey Explorer for Digital Source Tracker, Giving Marketers Visual Insight into the Customer Journey
Transform how to track campaigns with out-of-the-box marketing attribution tools. Start making the right marketing decisions today.