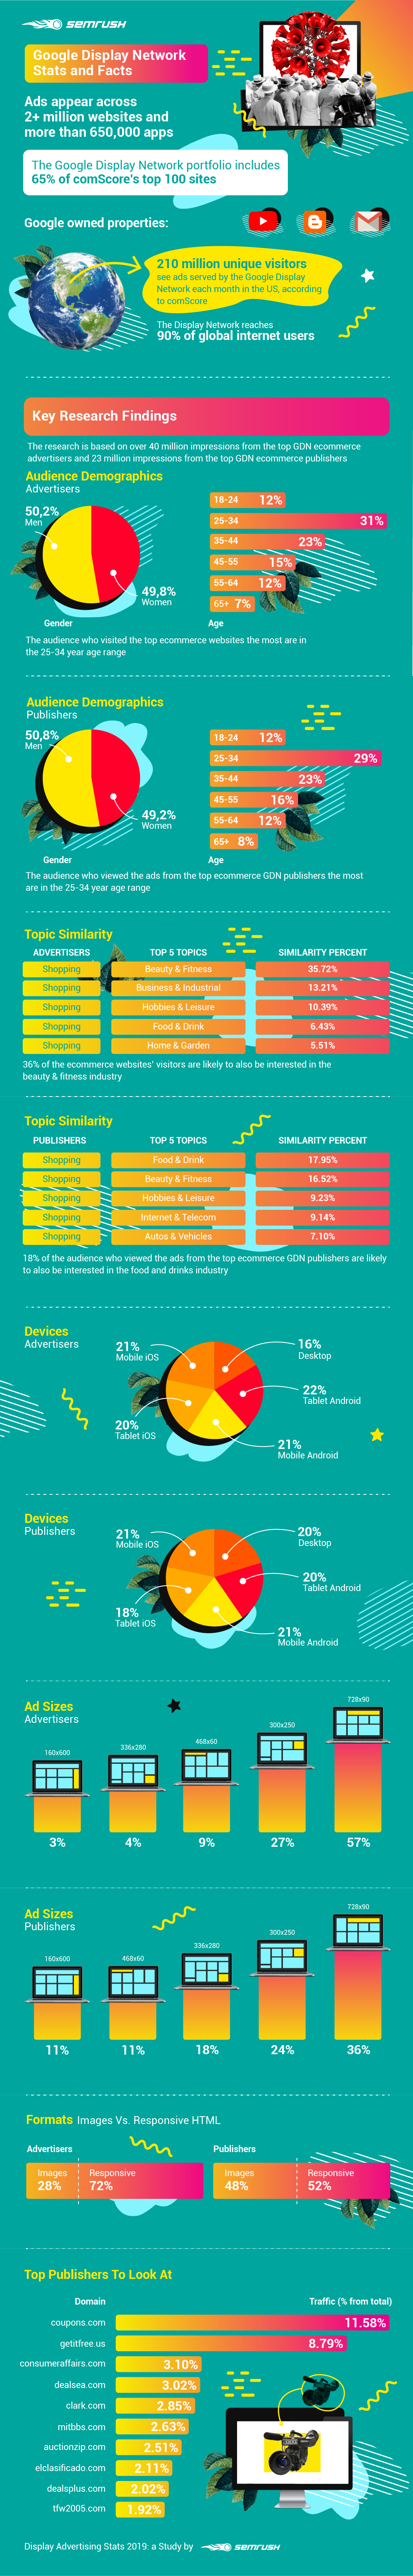
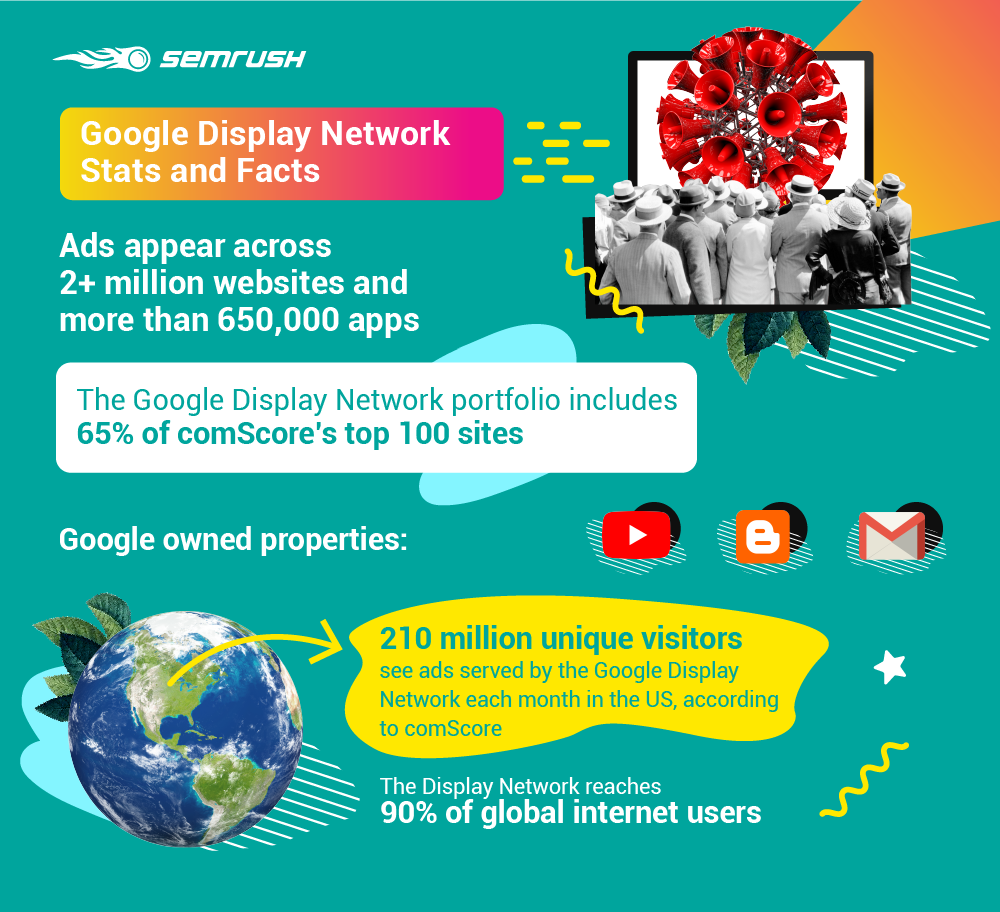
Google’s Display network is the largest in the world, with 90% reach across all internet users worldwide. Despite this, it is still not uncommon to find hesitation amongst marketers to use this part of the marketing platform.
If you are feeling a little intimidated or aren’t sure where to start, know that there is enormous potential on the platform. Your ads could potentially appear on more than two million different sites and more than 650,000 apps, meaning that you can follow your audience and connect with them anywhere they are online.
To hopefully help assuage some of that doubt, Semrush has compiled information from more than 40 million impressions from the top Google Display Network (GDN) ecommerce advertisers and 23 million impressions from the top GDN ecommerce publishers. All of this data was pulled from our Display Advertising tool, and it is all fresh, as it was sourced within the last three months.
As a result, we have uncovered insights to help ecommerce advertising specialists and businesses use the display network to their advantage while making more data-driven decisions, ultimately resulting in more leads, more sales, and more profit.
Research Methodology
Wondering exactly how we got these numbers?
We compiled a list of the top 61,462 GND advertisers and 63,823 top publishers, and then we divided them up by industry. We used our Display Advertising tool and collected relevant data from the past three months, and then rated each individual domain on a scale from 1 to 100. This score was based on internal algorithms, which defined how closely each domain related to the industry at hand. We added English-speaking countries like the US, UK, India, Canada, Australia, and the Netherlands to our case study.
When we say “ecommerce sites,” we are looking specifically at sites that are using the GDN to place ads online, and that belong to the Shopping niche. This is a big category that many can relate to, so many of our readers will easily be able to take this actionable data and apply it to their own campaigns.
Ready to take a look at some of this actionable data? Here is what we found.
The Data: Ecommerce Industry Stats & How to Apply The Findings To Your Campaigns
The viewing of your ads happens in a split second, with more than half of all online ads being considered for just a few seconds. Despite this, there is an enormous amount of strategy that typically goes into every campaign, weighing factors like placement, targeting, sizing, messaging, and medium.
When executed correctly, this strategy can pay off, even in five seconds or less; if the ad is successful, you get the click, and hopefully a conversion. The end goal, after all, is to develop a creative and show it to the right audience so it can capture their attention and lead to a sale.
Audience Targeting
Audience targeting is a crucial part of success for advertisers in the display network. Your targeting can help you target users by interest, demographics, their relationship to you, and the stage of the sales funnel they fall into. If your targeting is off, it can quickly derail your campaigns, so getting it right is a make-or-break situation.
During our research, we collected data on the audiences who saw the campaigns in the Shopping category from advertisers, and the audience that saw ads from publishers that displayed ads in the Shopping niche.
To start, let’s take a look at the breakdown in gender and age in these audiences.
Advertisers
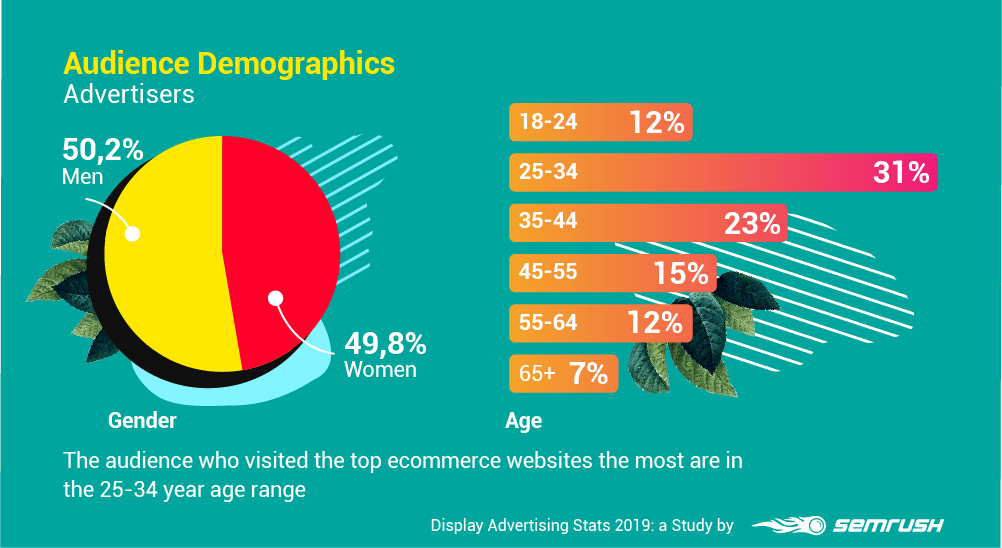
Based on the information we compiled, advertisers must take specifics of age and gender of their target audience into account and consider how these differences could impact how viewers are triggered by and consume specific creative content.
Women, for example, do more online shopping than men and click through ecommerce sites 30% more often than their male counterparts. Women approach it as more of a leisure activity in general. Men, on the other hand, are more inclined to cross-device shopping than women and prefer brighter colored ads to the women’s preferred soft colors.
As for age, 54% of the audience members that saw ads from ecommerce brands were between the ages of 25 to 44. Advertisers need to pay attention to this segment and ensure that they have relevant ads to show them.
These shoppers are typically more intentional about their purchases, doing more research before pulling out their credit cards, and they value quality over quantity. They also value authenticity and deals, so factor this into your marketing strategy; it may take them longer to shop, but they will convert when they find the right product.
Publishers
And now for the publishers, here is the demographic information you need to know:
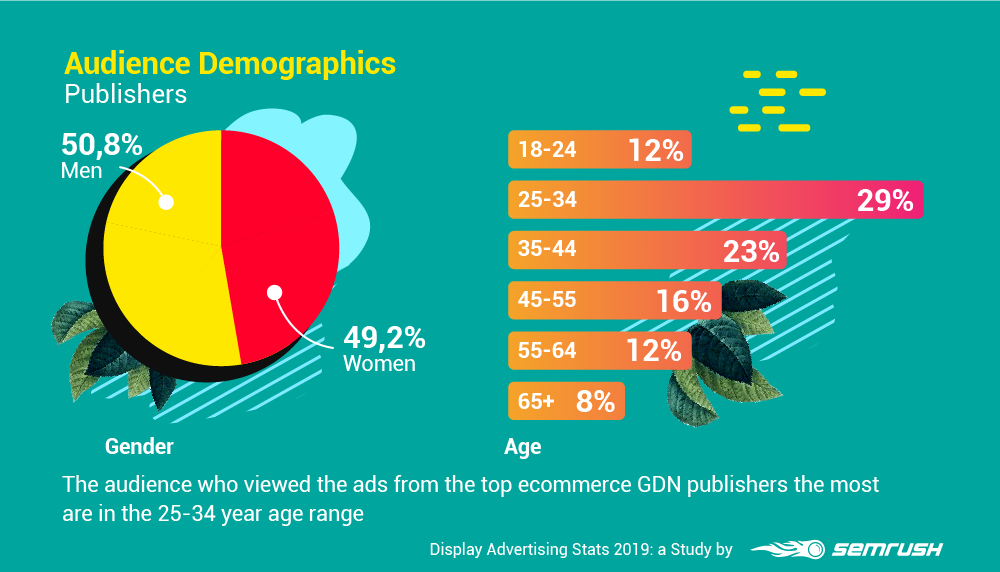
Publishers had a similar distribution in both age and gender to advertisers, which means that ecommerce brands are doing a great job at understanding and reaching their target audience.
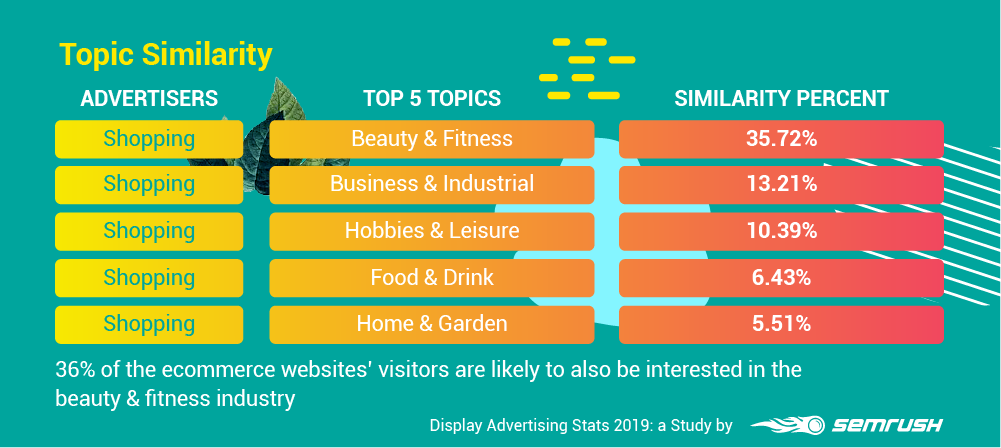
Topic Similarity
Finding new audiences to expand to is a common challenge for PPC specialists. To avoid audience burnout, they have to constantly test new interest combinations. In our study, we took a look at the most common interests of ecommerce site visitors.
Based on the research findings, the ecommerce websites’ visitors are likely to also be interested in the topics of beauty & fitness (36%), business & industrial (13%), and hobbies & leisure (10%).
We recommend using our Display Advertising tool to analyze strategies of the advertisers in these industries and snag the best ideas for yourself.
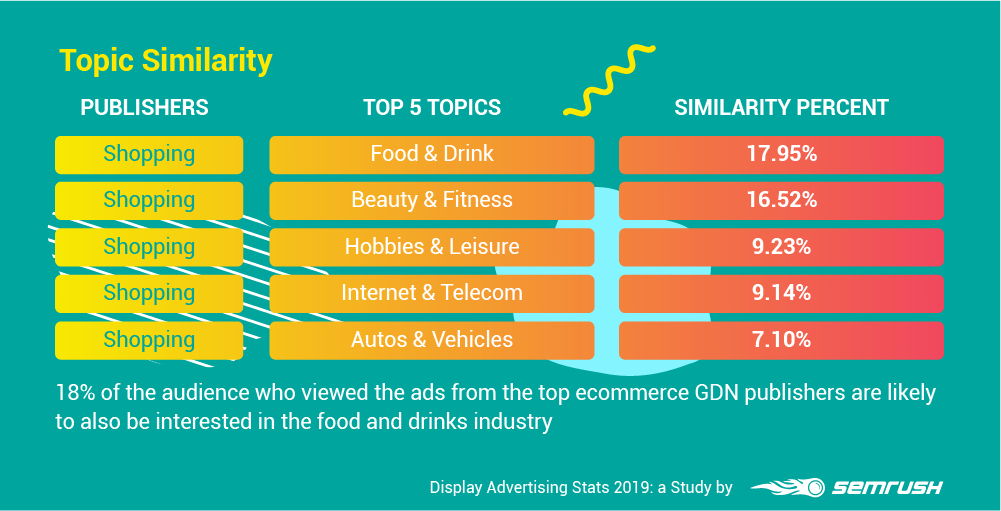
You should also pay attention to the publishers in the food & drink and beauty & fitness industries. Take a look at your strategies, add publishers from the industries below, tweak your campaigns if necessary, and run a few experimental ads.
Cross-Device Targeting Is Key
The topic of “desktop vs. mobile” is always a pretty popular one, but what is interesting is that the top advertisers in the Shopping niche don’t have strong preferences towards either one. We found that the impressions of their ads are distributed pretty evenly across devices, from 16-22%.
Cross-device ad targeting, therefore, is a popular strategy. It allows advertisers to capture their target audience at every stage of the ad journey; this is essential since the path to purchase is typically a little more of a meandering stroll than a straight path, and it happens across multiple conversions.
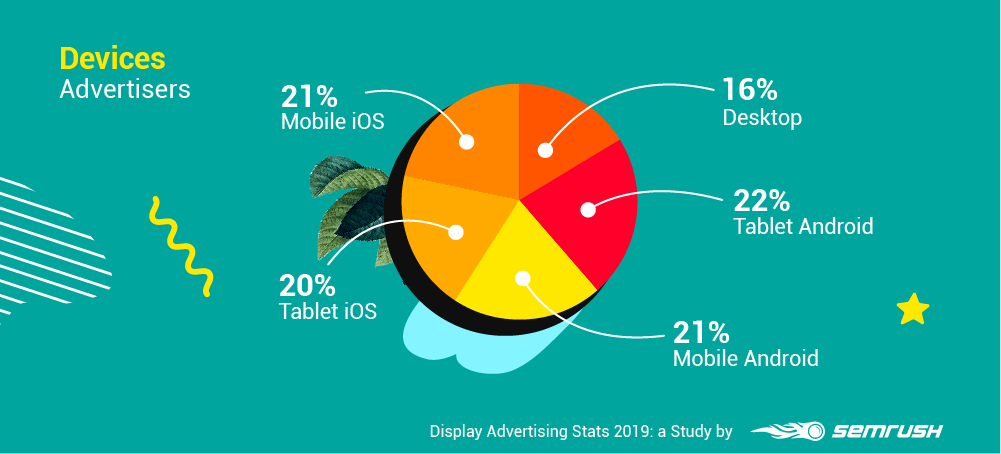
If you are an advertiser limiting yourself to specific devices, consider cross-device targeting for more reach and impressions.
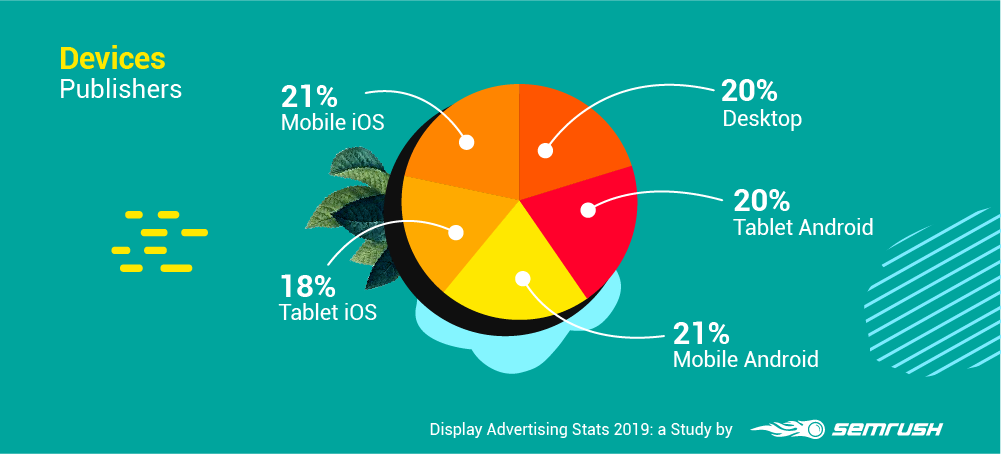
We found that more than 23 million impressions from the top GDN ecommerce publishers were distributed relatively evenly across all devices compared to ecommerce advertisers. This may be due to the fact that publishers’ sites are visited by different segments of that target audience, so ads on different devices are used to catch their attention and drive specific actions.
Leaderboard Ads Are Advertising Leaders
The size and the placement of the ads are unsurprisingly extremely important when it comes to trying to capture a user’s attention and earn their clicks.
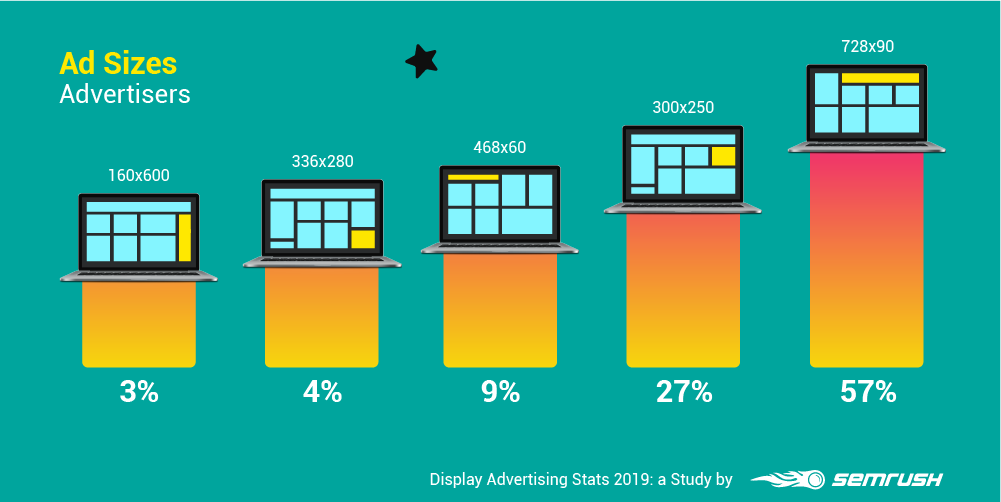
According to our analysis, we found that the top performing ad sizes identified by Google were also the most frequently seen ad size so far in 2019: 728x90 and 300x250.
We found that the 728x90 (or “leaderboard”) ads were hands-down the most popular ad size across advertisers in the Shopping niche in some English-speaking countries, and the other formats were far behind. It has proven to be most effective when placed above the fold on forum sites, helping to immediately attract the viewer’s attention before diving into the site’s actual content.
The 300x250 size (or “medium rectangle”) is also effective because it takes up a good chunk of space while showcasing text and display ads on both mobile and desktop. These ads may work best when placed in text-heavy sites towards the middle or end of the on-site content.
Advertisers in the industry should pay attention not only to the most popular sizes, but also the “large rectangle” ad format, which is 336x280 pixels. Publishers used them about as consistently as they used the “medium rectangle,” though advertisers prioritized the medium option. Take advantage of the gap so you can have your ads displayed by relevant publishers with less competition.
The “banner” ad format, which is 468x60 pixels and takes up a large, thin rectangle on sites, comes in as the third most popular placement option and should be considered to prevent a missed opportunity. These ads often appear towards the top of a site, making them highly prominent and more likely to capture user attention.
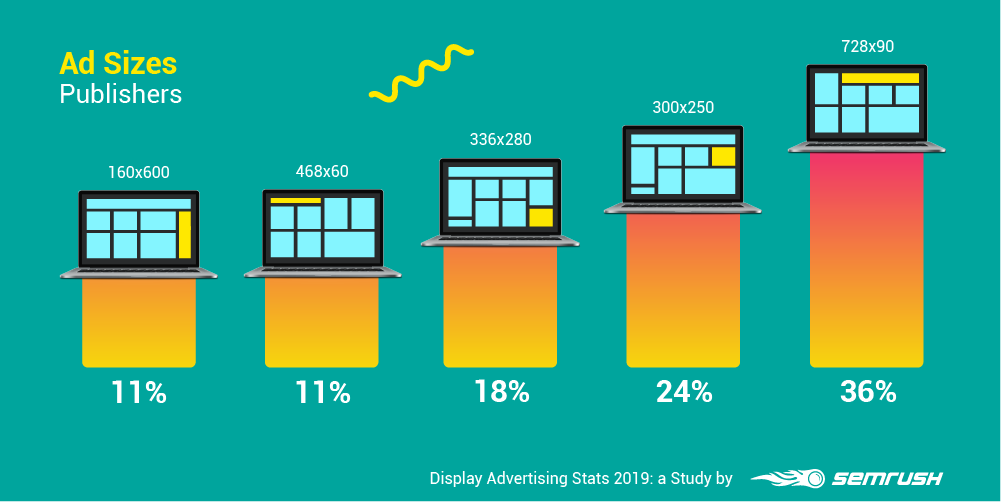
Top GDN ecommerce publishers are split relatively equally when it comes to “leaderboards” and “medium rectangle” ad sizes. This is because the 300x250 ads were clearly the most dynamic, deriving its effectiveness from the fact that it was the most widely available format online and cross-device, making it a popular choice.
That being said, many ad messages don’t fit into that small amount of space. Ads that are vertically longer are an excellent alternative in these circumstances, allowing advertisers to display larger messages and images. These ads also stay on the viewer’s screen for long, as they have to scroll down further to stop seeing it, maximizing viewability.
As a publisher, make sure that you are paying attention to the ad sizes your competitors are using.
There Is A Big Gap Between Images and Responsive Ad
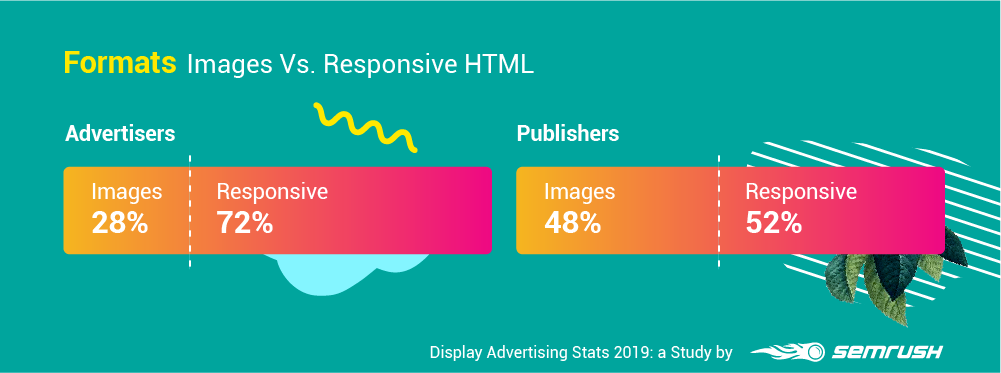
In 2017, things were different. Images dominated responsive ads by 68% to 32% in the retail industry; this is no longer the case.
In 2019, it is clear that advertisers in the ecommerce industry are putting a much heavier focus on responsive ads; 72% of the display ads we reviewed were from responsive ads, and this makes sense. Ecommerce advertisers have limited time and resources, but an overwhelming number of products to promote, and they found that responsive ads were the easiest ways to reach users in the display network.
If you are using image-only formats, you should consider switching this up.
When it comes to GDN top ecommerce publishers, ad types are split more equally between image and responsive ads, with publishers likely testing different ad formats to figure out which will yield a higher CTR.
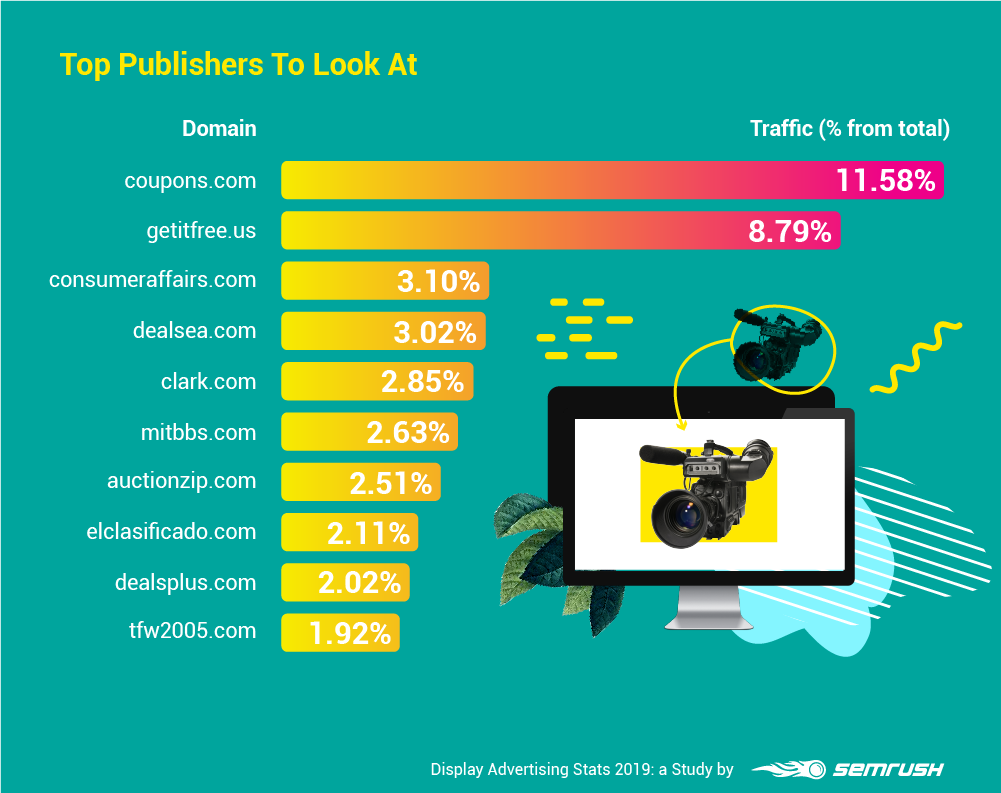
Top Publishers To Look At
After reviewing the most popular publishers in the ecommerce industry, we recommend that you add these placements in your display campaigns and see how well they work for you, as they were used by our top advertisers.
What This Means to Marketers
Advertisers in the ecommerce industry — both as publishers and advertisers — should take note of these finds to gain some information on what the top performers are doing on the display network. This data can provide some insight on why their campaigns are so successful and give you a few strategies you can apply to your own campaigns.
Adapt some of these best practices for your own display campaigns by doing the following:
-
Go cross-device
-
Focus on responsive ads
-
Add our recommended publishers and topics to your list
-
Test out those leaderboard ads, along with other popular ad formats.
These tactics are working well for the top advertisers, and so it is well worth testing to see if they could work for you too.
Note that it is always important to test these tactics before diving in head-first; display ads can be finicky, and split testing is crucial to make sure that your new campaigns are still working (and working well!) for your audience. At the end of the day, that’s what matters most.
What If I Would Like to Get Research Findings for My Niche?
In this study, we concentrated on the ecommerce industry. However, we did still collect data on 24 more industries. If you would like to receive data on other industries, let us know in the comments, and we can publish the research findings from your industry next!
In the meantime, we invite you to try the Semrush’s Display Advertising tool. It will help you take advantage of your rivals' best practices and get insights into the audience targeting.
Now it is time to explore the entire infographic!