
- Read rates in this sector have improved steadily for the last four quarters.
- Spam rate trends have been variable, but show strong improvement in the most recent quarter.
The sixth in our performance benchmark series covers the Household and Home Improvement industry. This analysis includes five key industry sectors we classify in this space: Home Appliances, Home Furnishings and Fixtures, Lawn and Garden, Mattresses and Bedding and Tools and Accessories. We analyzed promotional email over a two -year period for up to about 500 related brands we’ve tracked in these five sectors. (Additional methodology details can be found below.)
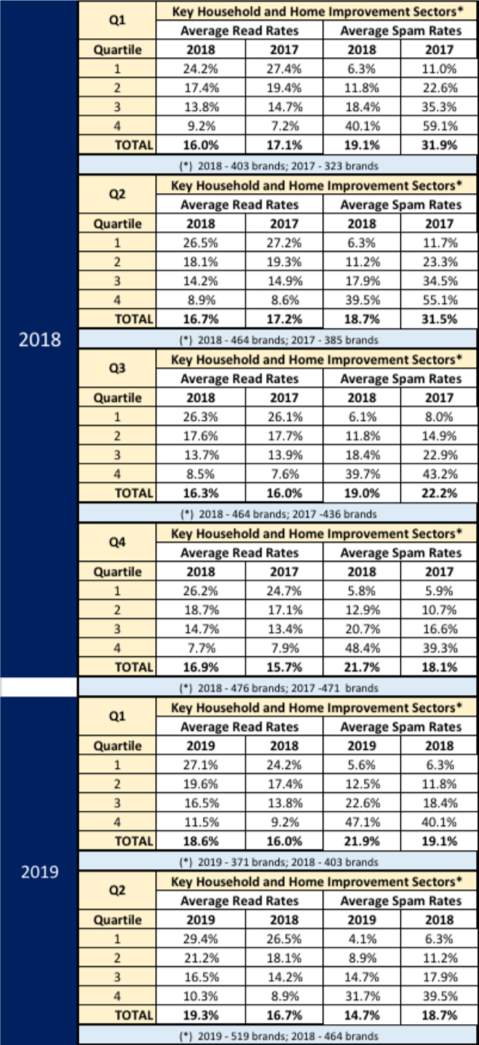
The tables below show overall read rate and inbox performance ranked best-to-worst by quartile for each quarter of 2018 and 2017, and for the first two quarters of 2019. Ranked quartiles are better than simple averages at showing the range of performance across the group. Highlights:
- Average read rates run from a high of 29.4% for brands in the top-ranked quartile for that metric (Q2 2019), down to 7.6% in the bottom quartile (Q3 2017).
- Spam rates range from 4.1% for brands in the top quartile for that metric (Q2 2019), up to more than 59% in the bottom quartile (Q1 2017).
- Spam rates consistently average over 30% in the two worst performing quartiles — half the tracked brands. For the worst quartiles, that can be more than 50% of email messaging going directly to spam. Identifying and fixing issues causing such weak performance would have an enormously positive business impact.
- Quarter-to quarter trends: Overall read rate performance improve between Q1 and Q2 of 2018, slip slightly in each of the next two quarters, and rebound strongly in Q1 and Q2 of 2019. Overall spam rates improve slightly over the first two quarters of 2018, erode again through Q1 of 2019, and then show dramatic improvement in Q2.
- Year-over-year trends: Overall average read rates eroded for the first two quarters of 2018, but improved with increasing strength for the next four quarters. Those trends are also reflected in most of the quartiles shown. Overall spam rates improved dramatically during the first three quarters of 2018, eroded somewhat over the next two, but improved strongly in Q2 2019.
Benchmark data help set a standard for understanding your own performance. If you’re sending marketing email in the Household and Home Improvement space, and your activity underperforms the best performance averages shown here, you may find considerable revenue and retention upside in identifying opportunities to replace, restructure or eliminate underperforming programs, and/or to remediate the send practices that drive poor inbox performance.