Appearances to the contrary, I do have work to do. But in reflecting on
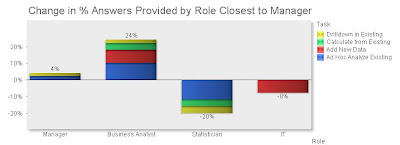
yesterday's post, I did think of one more way to present the impact of QlikTech (or any other software) on an existing environment. This version shows the net change in percentage of answers provided by each user role for each activity type. It definitely shows which roles gain capacity and which have their workload reduced. What I particularly like here is that the detail by task is clearly visible based on the size and colors of segments within the stacked bars, while the combined change is equally visible in the total height of the bars themselves.
In case you were wondering, all these tables and charts have been generated in QlikView. I did the original data entry and some calculations in Excel, where they are simplest. But tables and charts are vastly easier in QlikView, which also has very nice export features to save them as images.


No comments:
Post a Comment